MySQL之profiling性能优化
如果需要优化一条SQL,想了解一条sql的每个阶段的耗时分布,则可以使用profiling来进行分析,能很方便的定位在哪个阶段、什么资源引起的性能问题。
一、开启profiling参数
此参数默认是关闭状态,线上不建议打开,建议在会话级别的设置排查问题
# 查看参数的状态
mysql> show variables like "%profi%";
+------------------------+-------+
| Variable_name          | Value |
+------------------------+-------+
| have_profiling         | YES   |
| profiling              | OFF   | #未开启
| profiling_history_size | 15    | #保存的条数
+------------------------+-------+
3 rows in set (0.12 sec)

# 开启参数
mysql>  set profiling=1;
Query OK, 0 rows affected, 1 warning (0.04 sec)

# 将history设置大一点
mysql> set profiling_history_size=100;
Query OK, 0 rows affected, 1 warning (0.00 sec)

#再次查看,已经打开
mysql> show variables like "%profi%";
+------------------------+-------+
| Variable_name          | Value |
+------------------------+-------+
| have_profiling         | YES   |
| profiling              | ON    | # 打开状态
| profiling_history_size | 100   |
+------------------------+-------+
3 rows in set (0.01 sec)
二、执行语句进行分析
下一步则是执行一条具体的语句,以便分析使用
# 执行一条insert语句,分析耗时
mysql> insert into t1 values (3, 'kk');
Query OK, 1 row affected (0.02 sec)

# 查看profiles的信息
mysql> show profiles;
+----------+------------+---------------------------------+
| Query_ID | Duration   | Query                           |
+----------+------------+---------------------------------+
|        1 | 0.00332000 | set profiling_history_size=100  |
|        2 | 0.00814400 | show variables like "%profi%"   |
|        3 | 0.02193000 | insert into t1 values (3, 'kk') |
+----------+------------+---------------------------------+
3 rows in set, 1 warning (0.00 sec)
三、查看SQL语句耗时详细信息
查看具体sql的执行过程的每个阶段的耗时情况
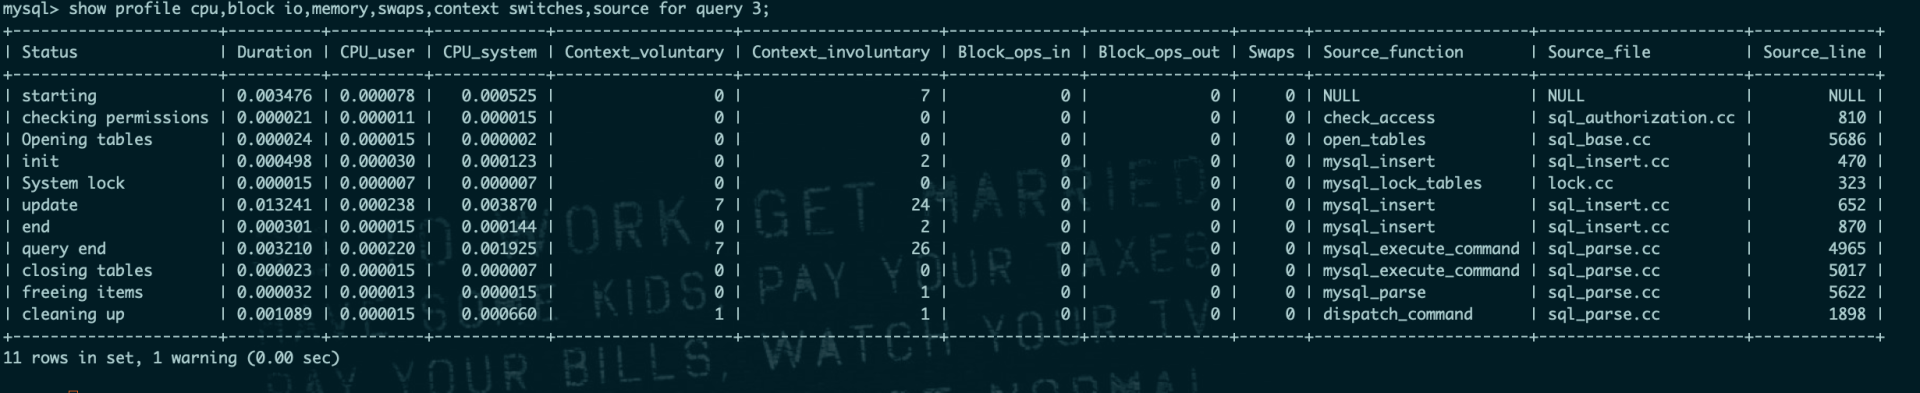
# 此处的query 3则为上面查出来的Query_ID,此处的时间单位是秒
mysql> show profile for query 3;
+----------------------+----------+
| Status               | Duration |
+----------------------+----------+
| starting             | 0.003476 |
| checking permissions | 0.000021 |
| Opening tables       | 0.000024 |
| init                 | 0.000498 |
| System lock          | 0.000015 |
| update               | 0.013241 |
| end                  | 0.000301 |
| query end            | 0.003210 |
| closing tables       | 0.000023 |
| freeing items        | 0.000032 |
| cleaning up          | 0.001089 |
+----------------------+----------+
11 rows in set, 1 warning (0.01 sec)

# 使用这条sql的执行 cpu、io、内存、交换内存等信息
show profile cpu,block io,memory,swaps,context switches,source for query 3;
原创作品,允许转载,转载时请务必以超链接形式标明文章 原始出处 、作者信息和本声明。否则将追究法律责任。
http://www.cnblogs.com/topicjie/

 浙公网安备 33010602011771号