

GraphX学习笔记——可视化
首先自己造了一份简单的社交关系的图
第一份是人物数据,id和姓名,person.txt
1 孙俪
2 邓超
3 佟大为
4 冯绍峰
5 黄晓明
6 angelababy
7 李冰冰
8 范冰冰
第二份是社交关系数据,两个人的id和社交关系,social.txt
1 丈夫 2
2 妻子 1
1 搭档 3
3 同学 4
3 好友 5
5 好友 3
5 妻子 6
5 好友 7
7 好友 8
使用SparkX和GraphStream来处理数据
package graphx

import org.apache.spark.{SparkConf, SparkContext}
import org.apache.spark.graphx._
import org.apache.spark.rdd.RDD
import org.graphstream.graph.implementations.{AbstractEdge, SingleGraph, SingleNode}

/**
  * Created by common on 18-1-22.
  */
object GraphxLearning {

  def main(args: Array[String]): Unit = {

    val conf = new SparkConf().setAppName("GraphX").setMaster("local")
    val sc = new SparkContext(conf)

    val path1 = "input/graphx/person.txt"
    val path2 = "input/graphx/social.txt"


    // 顶点RDD[顶点的id,顶点的属性值]
    val users: RDD[(VertexId, (String, String))] = sc.textFile(path1).map { line =>
      val vertexId = line.split(" ")(0).toLong
      val vertexName = line.split(" ")(1)
      (vertexId, (vertexName, vertexName))
    }

    // 边RDD[起始点id,终点id,边的属性(边的标注,边的权重等)]
    val relationships: RDD[Edge[String]] = sc.textFile(path2).map { line =>
      val arr = line.split(" ")
      val edge = Edge(arr(0).toLong, arr(2).toLong, arr(1))
      edge
    }

    // 默认(缺失)用户
    //Define a default user in case there are relationship with missing user
    val defaultUser = ("John Doe", "Missing")

    //使用RDDs建立一个Graph(有许多建立Graph的数据来源和方法,后面会详细介绍)
    val srcGraph = Graph(users, relationships, defaultUser)

    val graph: SingleGraph = new SingleGraph("graphDemo")

    //    load the graphx vertices into GraphStream
    for ((id, name) <- srcGraph.vertices.collect()) {
      val node = graph.addNode(id.toString).asInstanceOf[SingleNode]
      node.addAttribute("ui.label", name._1)
    }

    //    load the graphx edges into GraphStream edges
    for (Edge(x, y, relation) <- srcGraph.edges.collect()) {
      val edge = graph.addEdge(x.toString ++ y.toString, x.toString, y.toString, true).asInstanceOf[AbstractEdge]
      edge.addAttribute("ui.label", relation)
    }

    graph.setAttribute("ui.quality")
    graph.setAttribute("ui.antialias")

    graph.display()


  }

}
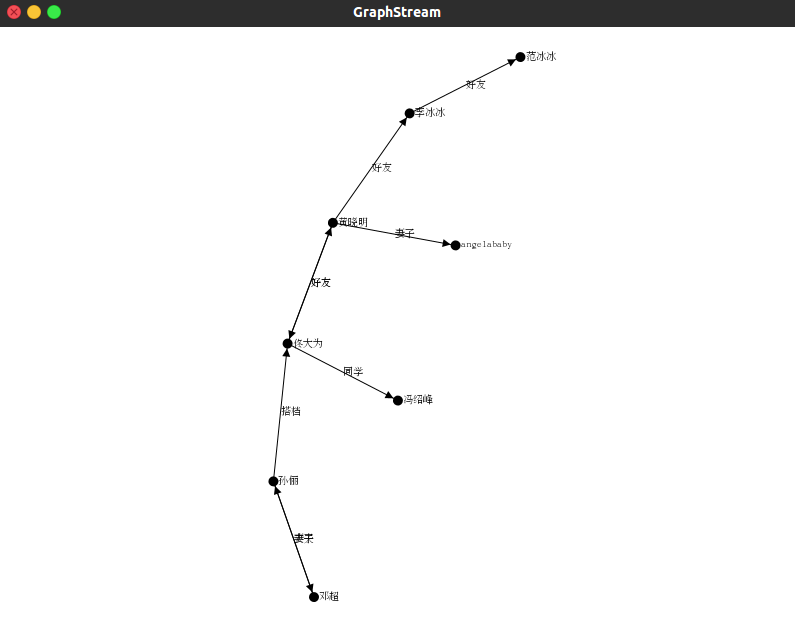
可视化的结果,该图数据节点数很少,本来想尝试一份百万节点的数据,结果遇到了爆内存的问题
后来发现爆内存是肯定的,而且显示的点太多也不太利于debug,解决方法是使用subgraph()方法来对图进行裁剪以减小节点和边的数量
本文只发表于博客园和tonglin0325的博客,作者:tonglin0325,转载请注明原文链接:https://www.cnblogs.com/tonglin0325/p/8338312.html

 浙公网安备 33010602011771号