


svg简介
Scalable Vector Graphics
可缩放矢量图形
SVG 图像在放大或改变尺寸的情况下其图形质量不会有所损失
svg知识点
svg如何绘图
svg和cnavas区别
svg如何实现动画效果
svg应用场景
1.图表
2.图标 icon
3.动效
4.矢量图:由点/线/图形(基本图形)
SVG元素
开始
<svg width=“500px” height=“500px”>
</svg>
使用
1. 直线
<line x1="100" y1="100" x2="200" y2="100"></line>
    <style>
        svg{
           border:1px solid #000;
        }
        line{
           stroke:red;
        }
    </style>
</head>
<body>
      <svg width="500px" height="500px">
         <line x1="100" y1="100" x2="200" y2="200"></line>
      </svg>
</body>
2. 矩形
<rect x="50" y="50" width="100" height="100" rx="10"ry="20"></rect> (rx ry 是矩形的圆角 ,不加也可以即没有圆角) (自动填充为黑色)
3. 圆形
<circle r="50" cx="220" cy="100"></circle> (自动填充为黑色)
4. 椭圆
<ellipse rx="100" ry="50" cx="400" cy="150"></ellipse> (rx 横轴半径 ry 纵轴半径 ,cx,cy圆心坐标) (自动填充为黑色)
5. 折线
<polyline points="60 50, 75 35, 100 50, 125 35, 150 50, 175 35, 190 50"></polyline> (自动填充为黑色,变折线可进行以下处理)
    <style>
        svg{
           border:1px solid #000;
        }
    </style>
</head>
<body>
      <svg width="500px" height="500px">
         <polyline points="60 50, 75 35, 100 50, 125 35"></polyline>
         //默认为填充样式
      </svg>
</body>
        polyline{
           fill:transparent;
           stroke:red;
        }
        //设置polyline变折线
6. 多边形
<polygon points="125 125,130 140,120 140"></ polygon> (原理同polyline 区别在于polyline是线 polygon是图形)
7. ⽂本
<text x="125" y="220">hello,world</text>
样式属性
1.fill 填充
2.stroke 描边
3.stroke-width 线宽
4.stroke-opacity/fill-opacity
5.stroke-linecap
6.stroke-linejoin

path元素
1. M指令和L指令 (moveTo lineTo)
<path d = "M 10 10 L 20 10" /> (d 路径 )
m指令和l指令
<path d = "m 10 10 l 20 10" />
大写表示绝对定位,小写表示相对定位
绝对坐标和相对坐标 相对于上一个移动距离
2.H和V命令
<path d="M 100 100 H 200 V 200"/>
水平(horizontal lineto)竖直(vertical lineto)方向移动距离
3.Z命令
<path d="M 100 100 H 200 V 200 z"/>
注:闭合 Z不区分大小写
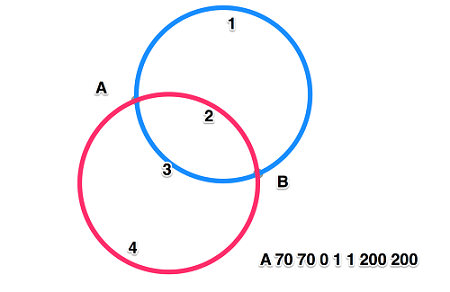
4.圆弧指令
A命令 (elliptical Arc) 七个参数
rx ry x-axis-rotation large-arc-flag sweep-flag x y
• rx ry圆弧的x轴半径和y轴半径
• x-axis-rotation 圆弧相对x轴的旋转角度,默认是顺时针,可以 设置负值
• large-arc-flag 表示圆弧路径是大圆弧还是小圆弧 1大圆弧
• sweep-flag 表示从起点到终点是顺时针还是逆时针,1表示顺 时针,0表示逆时针
• x y 表示终点坐标,绝对或相对
<path d="M 100 100 A 70 120 90 1 1 150 200"></path>
贝塞尔曲线
1. 二次贝塞尔
Q x1 y1, x y
T x y (拓展)
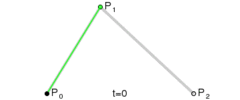
    <style>
        svg{
           border:1px solid #000;
        }
        path{
           fill:transparent;
           stroke:red;
        }
    </style>
</head>
<body>
      <svg width="500px" height="500px">
         <path d="M 100 100 Q 200 50 300 300 T 350 200"></path>
      </svg>

对称点
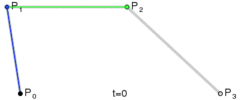
三次贝塞尔曲线
C x1 y1, x2 y2, x y
S x2 y2, x y

自动生成路径
Method Draw
地址: http://editor.method.ac/
SVG 渐变
1.线性渐变
<defs> (定义)
<linearGradient id="bg1" x1="0" y1="0" x2="0" y2="100%">
<stop offset="0%" style="stop-color:rgb(255,255,0);"/>
<stop offset="100%" style="stop-color:rgb(255,0,0);"/>
</linearGradient>
</defs>
<rect x="0" y="0" width="500" height="500"style="fill:url(#bg1)"/>
2.径向渐变
<defs>
<radialGradient id="bg2" cx="50%" cy="50%" r="50%" fx="50%" fy="50%">
<stop offset="0%" style="stop-color:green;"/>
<stop offset="100%" style="stop-color:red;"/>
</radialGradient>
</defs>
<rect x="0" y="0" width="500" height="500" style="fill:url(#bg2)"/>
SVG 滤镜
1.高斯滤镜
<defs>
<filter id="Gaussian_Blur">
<feGaussianBlur in="SourceGraphic" stdDeviation="20"/>
</filter>
</defs>
<rect x="0" y="0" width="500" height="500" fill=”yellow” style="filter:url(#Gaussian_Blur)"/>
2.其他滤镜
http://www.w3school.com.cn/svg/svg_filters_intro.asp
SVG 路径动画
1. stroke-dasharray: 100px; 切割线段,展示成虚线 stroke-dasharray: 10px 20px 30px; (切割线段的间隔)
2. stroke-dashoffset: 15px; 偏移量
抽风动画效果
   <style>
      line{
         stroke:red;
         stroke-width:10px;
         stroke-linecap:butt;
         stroke-dasharray:300px;
         stroke-dashoffset:300px;
         animation:move 2s linear infinite alternate-reverse;
      }
      @keyframes move{
         0% {
            stroke-dashoffset:300px;
         }
         100% {
            stroke-dashoffset:0;
         }
      }
   </style>
</head>
<body>
    <svg width = "500px" height = "500px">
      <line x1=100 y1=100 x2=400 y2=100></line>
    </svg>
</body>
js操作svg
1.getTotalLength( )
获取路径总长度
    <svg width = "500" height = "500">
      <line x1=100 y1=100 x2=400 y2=100></line>
    </svg>
    <script>
       var svg = document.getElementsByTagName('svg')[0];
       var line = document.getElementsByTagName('line')[0];
       console.log(line.getTotalLength());
    </script>
2.getPointAtLength(x)
获取路径上距离起始点距离x长度的点的坐标
注:严格来说上面两方法只适用于path元素,但各个浏览器实现起来都会有一点区别。例如谷歌浏览器也能获取到line元素的路径长度。
viewPort 表示SVG可见区域的大小,画布大小
1.<svg width="500" height="300" ></svg>
宽500单位,高300单位

ViewBox 表示视区盒子
1.<svg width="400" height="300" viewBox="0,0,40,30" style="border:1px solid #cd0000;">
<rect x="10" y="5" width="20" height="15" fill="#cd0000"/>
</svg>
2.preserveAspectRatio(作用的对象都是viewBox)
preserveAspectRatio="xMidYMid meet"
svg.setAttribute("preserveAspectRatio", "xMinYMin meet");
第1个值表示,viewBox如何与SVG viewport对齐;第2个值表示,如何维持高宽比(如果有)
第1个值又是由两部分组成的。前半部分表示x方向对齐,后半部分表示y方向对齐
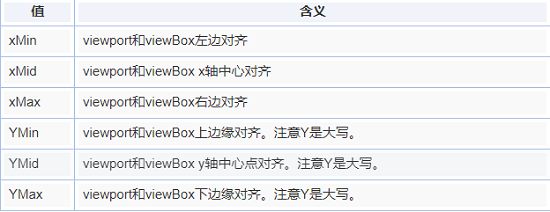
设置填充方式
meet:保持纵横比缩放viewBox适应viewport
slice:保持纵横比同时比例小的方向放大填满viewport (在均匀缩放的同时保持viewbox的宽高比)
none: 扭曲纵横比以充分适应viewport
http://www.zhangxinxu.com/study/201408/svg-preserveaspectratio-meet-slice-none.html
JS 生成SVG元素
1、创建SVG元素需要指定命名空间
2、SVG元素对象一般通过调用setAttribute()方法来设定属性值
   <script>
       var svg = document.createElementNS('http://www.w3.org/2000/svg','svg');
       var line = document.createElementNS('http://www.w3.org/2000/svg','line');
       svg.setAttribute('width','200');
       svg.setAttribute('height','200');
       line.setAttribute('x1','100');
       line.setAttribute('y1','100');
       line.setAttribute('x2','150');
       line.setAttribute('y2','100');
       svg.appendChild(line);
       document.body.appendChild(svg);
    </script>
canvas与svg
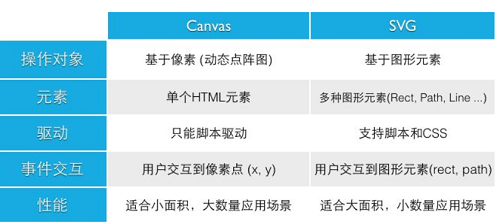
canvas与svg
SVG特点:不依赖分辨率,支持事件处理器,最适合带有大型渲染区域的应用程序(比如谷歌地图),复杂度高会减慢渲染速度(任何过度使用 DOM 的应用都不快),不适合游戏应用 Canvas
Canvas 通过 JavaScript 来绘制 2D 图形。Canvas 是逐像素进行渲染的。在 canvas 中,一旦图形被绘制完成,它就不会继续得到浏览器的关注。如果其位置发生变化,那么整个场景也需要重新绘制,包括任何或许已被图形覆盖的对象。
特点:依赖分辨率,不支持事件处理器,弱的文本渲染能力能够以 .png 或 .jpg 格式保存结果图像,最适合图像密集型的游戏,其中的许多对象会被频繁重绘。

