
sql ytd 附python 实现方式
ytd释义
YTD分析属于同比分析类,其特点在于对比汇总值,即从年初第一日值一直至今的值累加。作用在于分析企业中长期的经营绩效。
做法
假定:
有一张销量明细表
| date | 仓库 | sku | 销量 |
|---|---|---|---|
| 2020-01-01 | 杭州仓 | 03045 | 20 |
步骤1:
时间序列缺失值填充
/*
    生成一张包含每个stock_id, sku的完整时间表
*/
select stock_id, sku,
explode(sequence(`min_date`,`max_date`,interval 1 day)) as `date`
from
(
/*
    计算stock_id, sku维度下的最大最小时间
*/
select stock_id, sku,
min(date) as `min_date`, max(date) as `max_date` from input
group by stock_id, sku
)
步骤2:
以填充后的时间序列表作为左表,关联销售表,sales字段为空的填充为0
select stock_id, sku, date, COALESCE(sales, 0) ,year(date) as year from (
select stock_id, sku,
explode(sequence(`min_date`,`max_date`,interval 1 day)) as `date`
from
(
select stock_id, sku,
min(date) as `min_date`, max(date) as `max_date` from input
group by stock_id, sku
) as a
left join input as b
on a.stock_id = b.stock_id and a.sku = b.sku and a.date = b.date
)
步骤3:
开窗函数计算ytd
select *,
sum(y) over (partition by (stock_id, sku,year) order by date)  from input
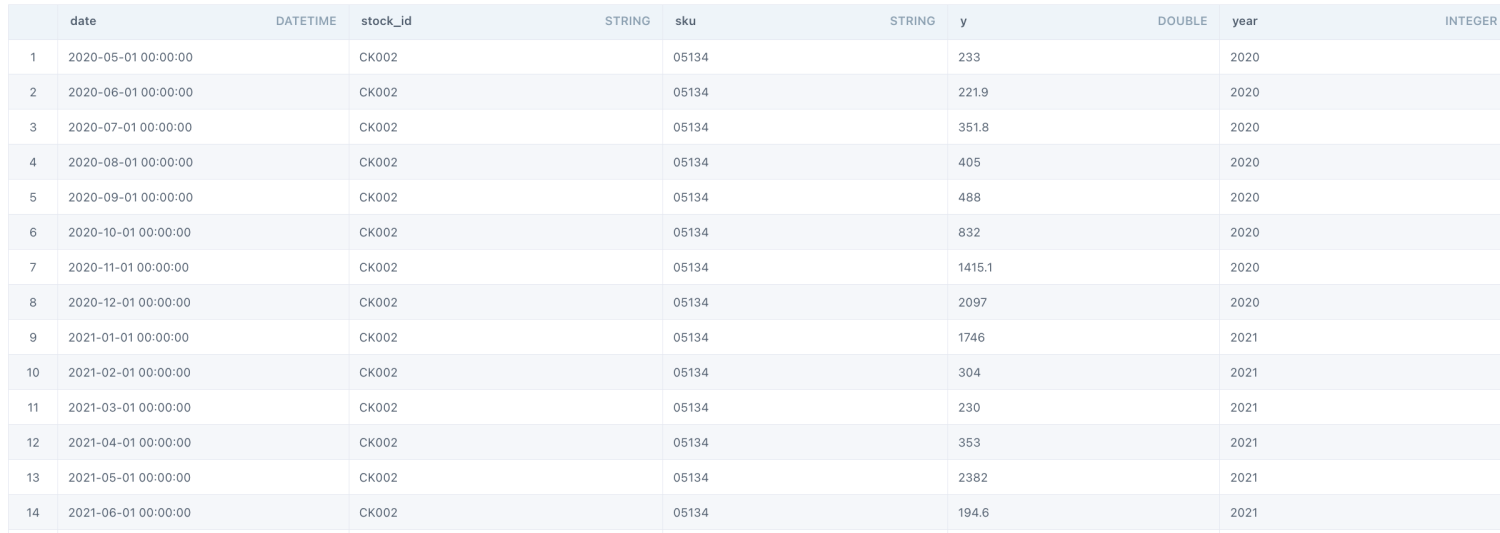
实践:
select  a.`date`, a.`stock_id`, a.`sku`, COALESCE(b.`y`, 0) as `y`,year(a.`date`) as `year`  from (
select `stock_id`,`sku`,
explode(sequence(`min_date`,`max_date`,interval 1 month)) as `date`
from
(
select `stock_id`,`sku`,
min(`date`) as `min_date`, max(`date`) as `max_date` from input
group by `stock_id`,`sku`
))  as a
left join input as b
on a.`stock_id` = b.`stock_id` and a.`sku` = b.`sku` and a.`date` = b.`date`
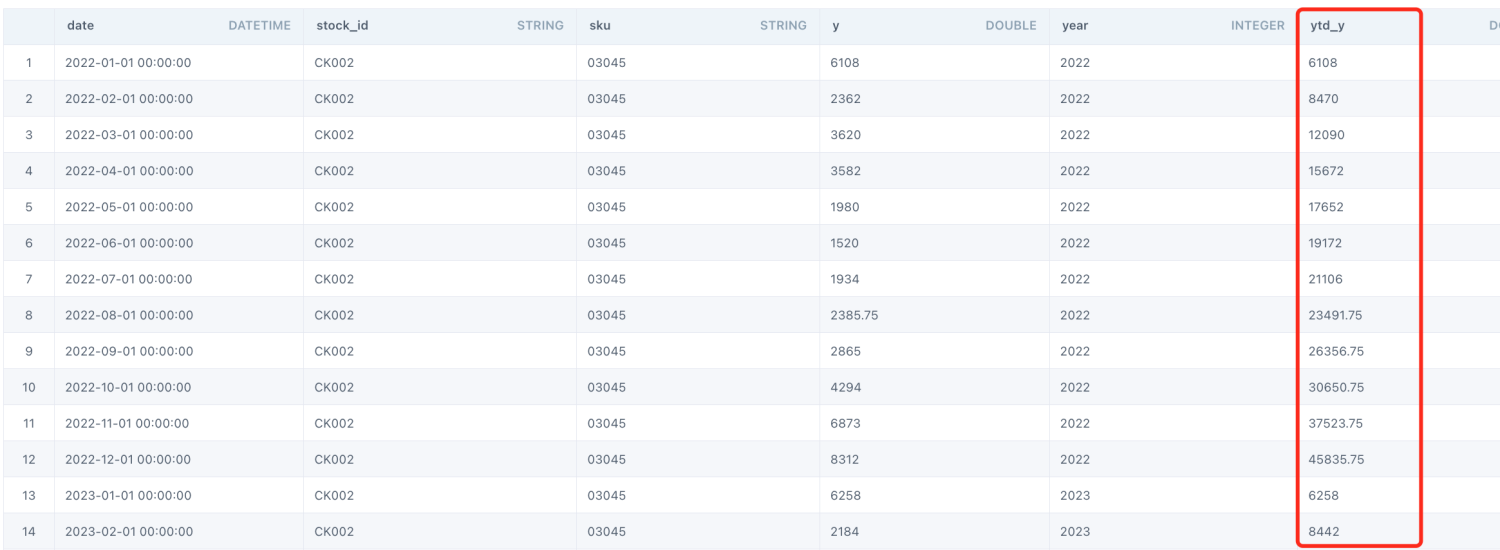
select *,
sum(`y`) over (partition by (`stock_id`, `sku`,`year`) order by `date`)  as `ytd_y`  from (
select  a.`date`, a.`stock_id`, a.`sku`, COALESCE(b.`y`, 0) as `y`,year(a.`date`) as `year`  from (
select `stock_id`,`sku`,
explode(sequence(`min_date`,`max_date`,interval 1 month)) as `date`
from
(
select `stock_id`,`sku`,
min(`date`) as `min_date`, max(`date`) as `max_date` from input
group by `stock_id`,`sku`
))  as a
left join input as b
on a.`stock_id` = b.`stock_id` and a.`sku` = b.`sku` and a.`date` = b.`date`
)
python实现方法:
- 时间序列填充
- explode
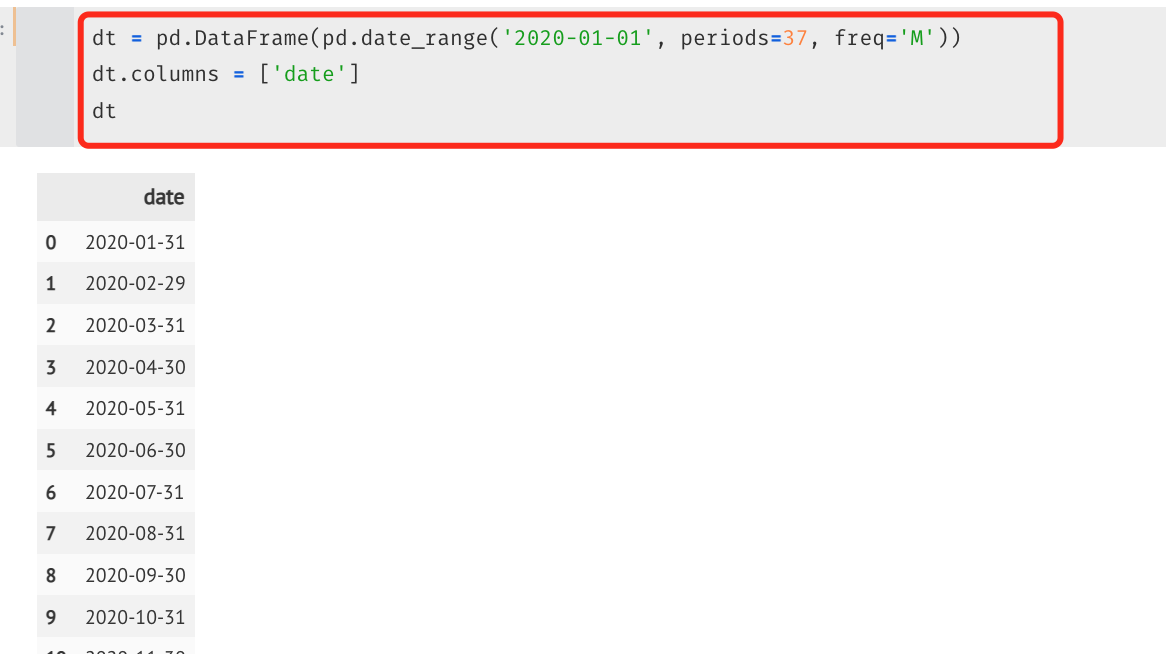
- 做一个完整的时间序列
# 1. 固定开始时间和长度
dt = pd.DataFrame(pd.date_range('2020-01-01', periods=37, freq='M'))
dt.columns = ['date']

# 2. 根据数据集的最大最小时间作为范围
min_date = hist_month.date.min()
max_date = hist_month.date.max()

dt = pd.DataFrame(pd.date_range(start = min_date, end = max_date, freq='M'))
dt.columns = ['date']
2. 计算年
hist_month['year'] = hist_month['date'].dt.year
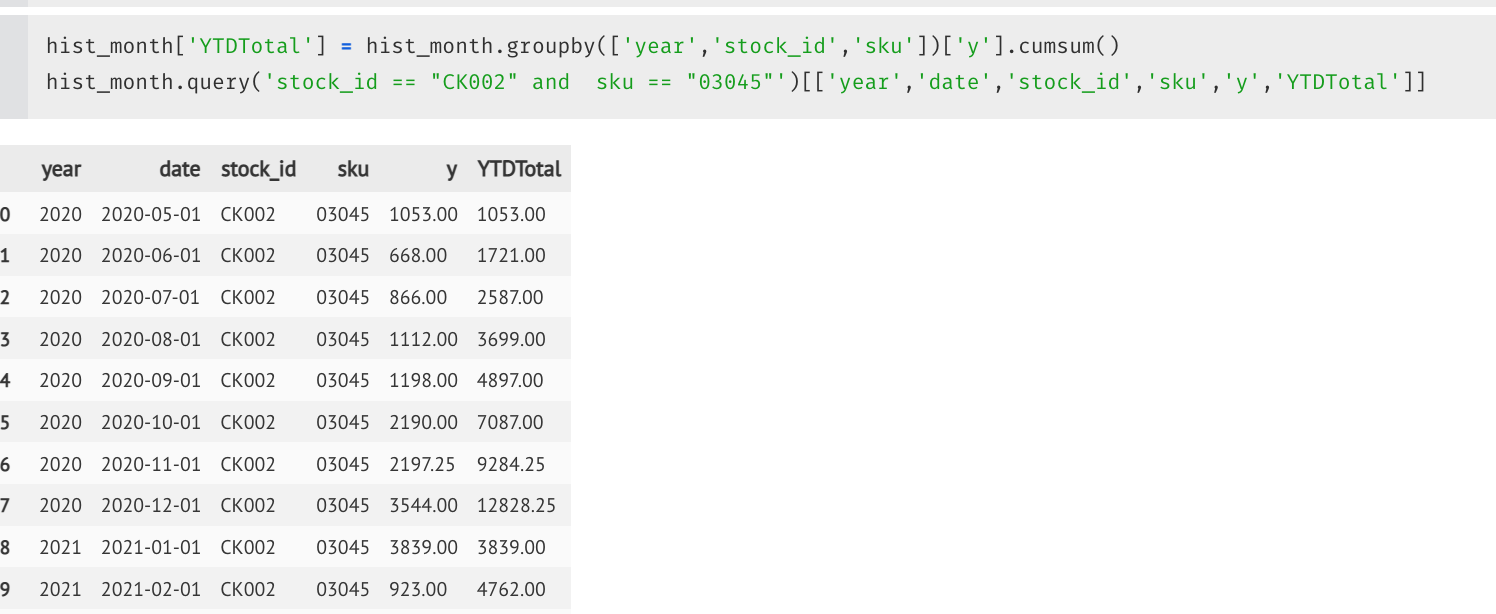
- cumsum函数
hist_month['YTDTotal'] = hist_month.groupby(['year','stock_id','sku'])['y'].cumsum()
hist_month.query('stock_id == "CK002" and  sku == "03045"')[['year','date','stock_id','sku','y','YTDTotal']]

 浙公网安备 33010602011771号