grafana如何解决Trying to create too many buckets. Must be less than or equal to: [10000] but was [10001]. This limit can be set by changing the [search.max_buckets] cluster level setting
grafana想要大屏展示,根据请求的uri的耗时时间做分组。按照自己的想法,只需要根据uri的请求以及耗时做一个分组就行了。
这个是es的数据
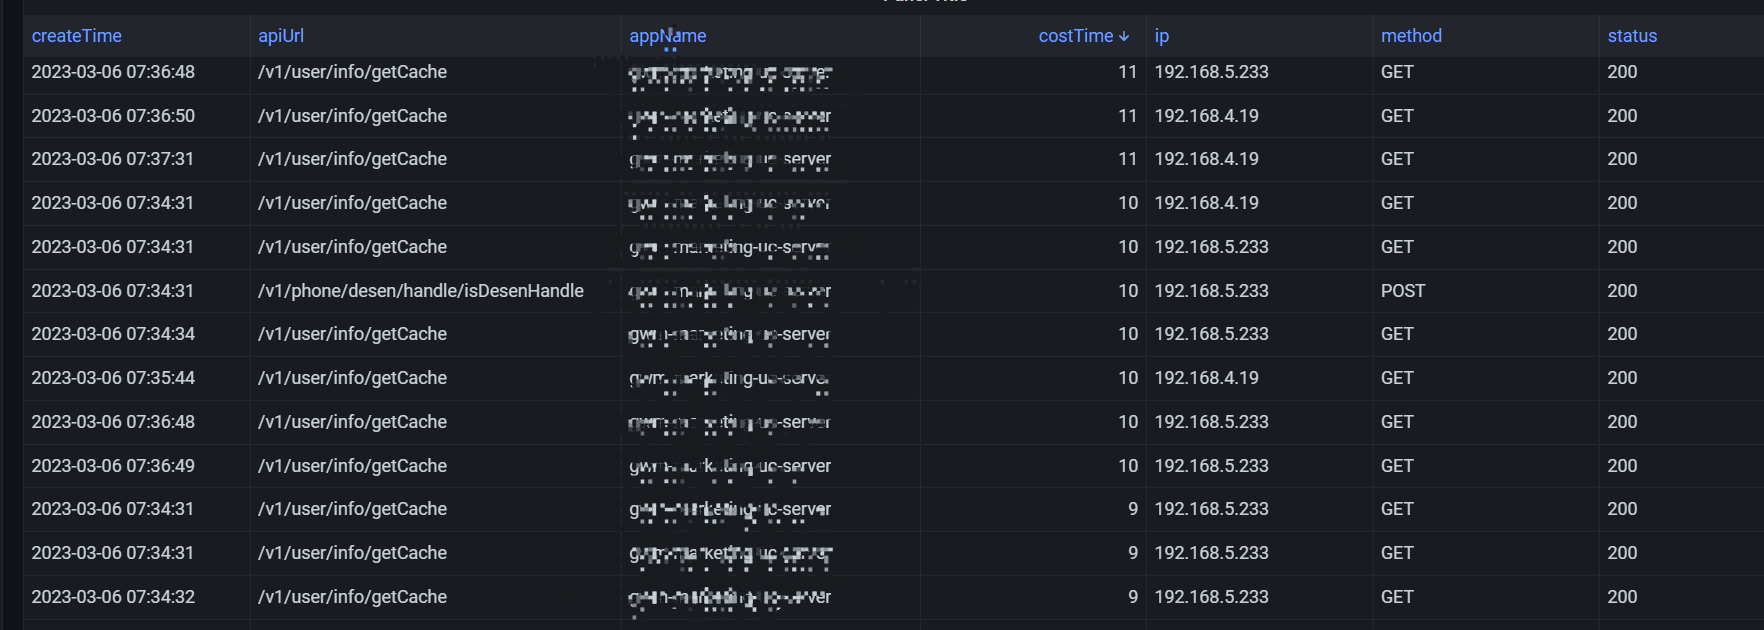
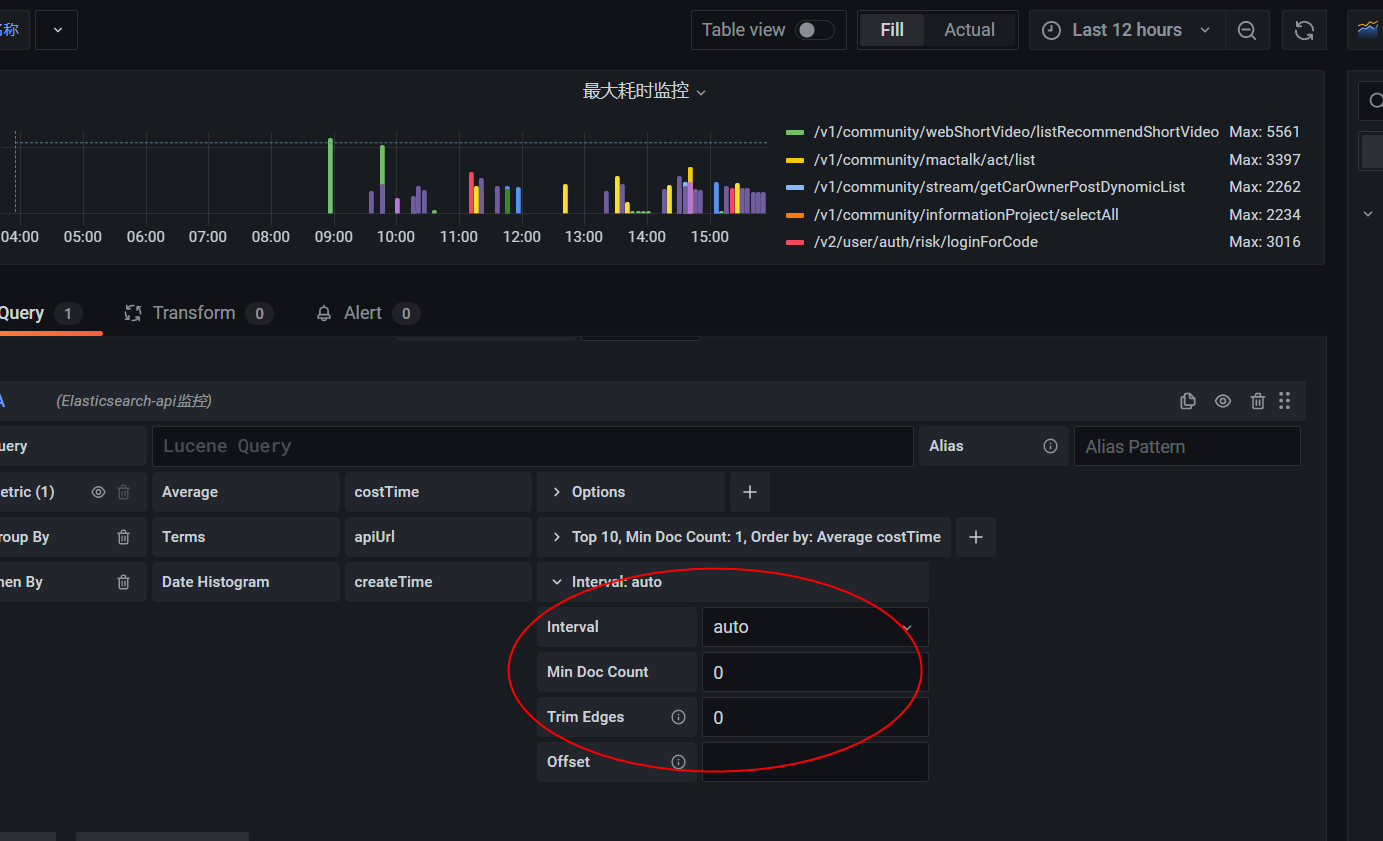
我其实就是想要根据apiUrl根据costTime做分组。下面是我的grafana的设置:

展示的是costTime耗时时间,按照apiUrl做分组。显示前20条,根据时间横坐标展示。
但是这样时间维度比较小,比如最近15min,30min,超过1h就不行了。点击query inspact

这个问题是因为es为了防止分组数据过多,为了避免oom,设置的默认分组数为10000. 这个10000可以通过es进行修改,但是当数据量太多或者时间跨度太大,仍然是不满足的。
这个问题在grafana的issue有解决方案:
https://github.com/grafana/grafana/issues/17327
I believe this issue is actually closed by this commit: #21937. You can now set the maximum data points per visualisation which then automatically calculates the time interval of the aggregation buckets. Between setting your maximum sub aggregation size limits and the max data points, you get a nicely scaling solutions with the aggregation filter. 🎉 I am running Grafana latest from Docker Hub v7.2.0 (efe4941).
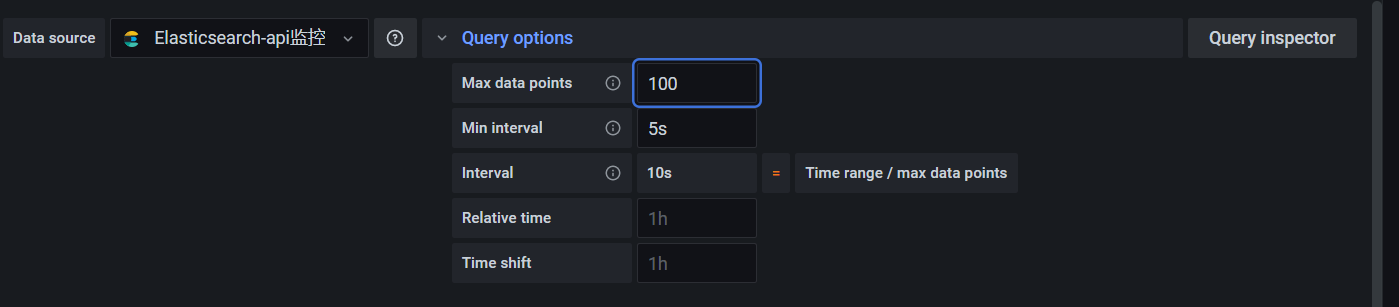
这样把时间线的维度拉大,无论一天还是多久,都是可以的了。

 浙公网安备 33010602011771号