python自动化运维阅读笔记
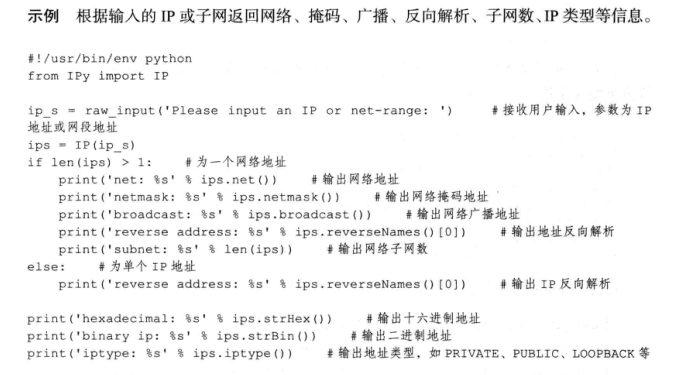
IPy
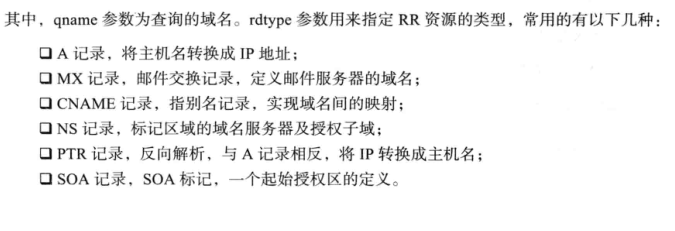
域名查询DNS
#!/usr/bin/env python
import dns.resolver

domain = input('Please input an domain: ')

A = dns.resolver.query(domain, 'A')
for i in A.response.answer:
    for j in i.items:
        if j.rdtype == 1:
            print (j.address)
区分工具difflib
(用在nginx的配置上,比较html上)
#!/usr/bin/python
import difflib

text1 = """text1:
This module provides classes and functions for comparing sequences.
including HTML and context and unified diffs.
difflib document v7.4
add string
"""

text1_lines = text1.splitlines()

text2 = """text2:
This module provides classes and functions for Comparing sequences.
including HTML and context and unified diffs.
difflib document v7.5"""

text2_lines = text2.splitlines()

d = difflib.Differ()
diff = d.compare(text1_lines, text2_lines)
print '\n'.join(list(diff))
比较两个文件夹:filecmp


import filecmp

a="/home/test/filecmp/dir1"
b="/home/test/filecmp/dir2"

dirobj=filecmp.dircmp(a,b,['test.py'])

print "-------------------report---------------------"
dirobj.report()
print "-------------report_partial_closure-----------"
dirobj.report_partial_closure()
print "-------------report_full_closure--------------"
dirobj.report_full_closure()

print "left_list:"+ str(dirobj.left_list)
print "right_list:"+ str(dirobj.right_list)
print "common:"+ str(dirobj.common)
print "left_only:"+ str(dirobj.left_only)
print "right_only:"+ str(dirobj.right_only)
print "common_dirs:"+ str(dirobj.common_dirs)
print "common_files:"+ str(dirobj.common_files)
print "common_funny:"+ str(dirobj.common_funny)
print "same_file:"+ str(dirobj.same_files)
print "diff_files:"+ str(dirobj.diff_files)
print "funny_files:"+ str(dirobj.funny_files)
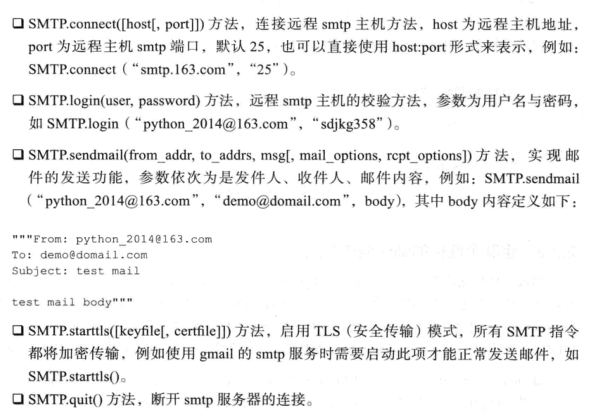
SMTPlib 自动发邮件给运维
学习路劲:https://www.liaoxuefeng.com/wiki/897692888725344/923057144964288
from email.mime.text import MIMEText
msg = MIMEText('hello, send by Python...', 'plain', 'utf-8')
 #输入Email地址和口令:
from_addr = input('From: ')
password = input('Password: ')
# 输入SMTP服务器地址:
smtp_server = input('SMTP server: ')
# 输入收件人地址:
to_addr = input('To: ')

import smtplib
server = smtplib.SMTP(smtp_server, 25) # SMTP协议默认端口是25
server.set_debuglevel(1)
server.login(from_addr, password)
server.sendmail(from_addr, [to_addr], msg.as_string())
server.quit()
pycurl
探测web服务质量
# -*- coding: utf-8 -*-
import os, sys
import time
import sys
import pycurl

URL = "www.baidu.com"
c = pycurl.Curl()
c.setopt(pycurl.URL, URL)

# 连接超时时间,5秒
c.setopt(pycurl.CONNECTTIMEOUT, 5)

# 下载超时时间,5秒
c.setopt(pycurl.TIMEOUT, 5)
c.setopt(pycurl.FORBID_REUSE, 1)
c.setopt(pycurl.MAXREDIRS, 1)
c.setopt(pycurl.NOPROGRESS, 1)
c.setopt(pycurl.DNS_CACHE_TIMEOUT, 30)
indexfile = open(os.path.dirname(os.path.realpath(__file__)) + "/content.txt", "wb")
c.setopt(pycurl.WRITEHEADER, indexfile)
c.setopt(pycurl.WRITEDATA, indexfile)
try:
    c.perform()
except :
    pass


NAMELOOKUP_TIME = c.getinfo(c.NAMELOOKUP_TIME)
CONNECT_TIME = c.getinfo(c.CONNECT_TIME)
PRETRANSFER_TIME = c.getinfo(c.PRETRANSFER_TIME)
STARTTRANSFER_TIME = c.getinfo(c.STARTTRANSFER_TIME)
TOTAL_TIME = c.getinfo(c.TOTAL_TIME)
HTTP_CODE = c.getinfo(c.HTTP_CODE)
SIZE_DOWNLOAD = c.getinfo(c.SIZE_DOWNLOAD)
HEADER_SIZE = c.getinfo(c.HEADER_SIZE)
SPEED_DOWNLOAD = c.getinfo(c.SPEED_DOWNLOAD)

print ("HTTP状态码:%s" % (HTTP_CODE))
print ("DNS解析时间:%.2f ms" % (NAMELOOKUP_TIME * 1000))
print ("建立连接时间:%.2f ms" % (CONNECT_TIME * 1000))
print ("准备传输时间:%.2f ms" % (PRETRANSFER_TIME * 1000))
print ("传输开始时间:%.2f ms" % (STARTTRANSFER_TIME * 1000))
print ("传输结束总时间:%.2f ms" % (TOTAL_TIME * 1000))

print ("下载数据包大小:%d bytes/s" % (SIZE_DOWNLOAD))
print ("HTTP头部大小:%d byte" % (HEADER_SIZE))
print ("平均下载速度:%d bytes/s" % (SPEED_DOWNLOAD))

indexfile.close()
c.close()
报表数据反馈工具(xlsxwriter)
#coding: utf-8
import xlsxwriter


# Create an new Excel file and add a worksheet.
workbook = xlsxwriter.Workbook('demo1.xlsx')
worksheet = workbook.add_worksheet()

# Widen the first column to make the text clearer.
worksheet.set_column('A:A', 20)

# Add a bold format to use to highlight cells.
#bold = workbook.add_format({'bold': True})
bold = workbook.add_format()
bold.set_bold()

# Write some simple text.
worksheet.write('A1', 'Hello')

# Text with formatting.
worksheet.write('A2', 'World', bold)

worksheet.write('B2', u'中文测试', bold)

# Write some numbers, with row/column notation.
worksheet.write(2, 0, 32)
worksheet.write(3, 0, 35.5)
worksheet.write(4, 0, '=SUM(A3:A4)')

# Insert an image.
worksheet.insert_image('B5', '1234.png')

workbook.close()
#coding: utf-8
import xlsxwriter

workbook = xlsxwriter.Workbook('chart.xlsx')
worksheet = workbook.add_worksheet()

chart = workbook.add_chart({'type': 'column'})

title = [u'业务名称',u'星期一',u'星期二',u'星期三',u'星期四',u'星期五',u'星期六',u'星期日',u'平均流量']
buname= [u'业务官网',u'新闻中心',u'购物频道',u'体育频道',u'亲子频道']

data = [
    [150,152,158,149,155,145,148],
    [89,88,95,93,98,100,99],
    [201,200,198,175,170,198,195],
    [75,77,78,78,74,70,79],
    [88,85,87,90,93,88,84],
]
format=workbook.add_format()
format.set_border(1)

format_title=workbook.add_format()
format_title.set_border(1)
format_title.set_bg_color('#cccccc')
format_title.set_align('center')
format_title.set_bold()

format_ave=workbook.add_format()
format_ave.set_border(1)
format_ave.set_num_format('0.00')

worksheet.write_row('A1',title,format_title)
worksheet.write_column('A2', buname,format)
worksheet.write_row('B2', data[0],format)
worksheet.write_row('B3', data[1],format)
worksheet.write_row('B4', data[2],format)
worksheet.write_row('B5', data[3],format)
worksheet.write_row('B6', data[4],format)

def chart_series(cur_row):
    worksheet.write_formula('I'+cur_row, \
     '=AVERAGE(B'+cur_row+':H'+cur_row+')',format_ave)
    chart.add_series({
        'categories': '=Sheet1!$B$1:$H$1',
        'values':     '=Sheet1!$B$'+cur_row+':$H$'+cur_row,
        'line':       {'color': 'black'},
        'name':    '=Sheet1!$A$'+cur_row,
    })

for row in range(2, 7):
    chart_series(str(row))

#chart.set_table()
#chart.set_style(30)
chart.set_size({'width': 577, 'height': 287})
chart.set_title ({'name': u'业务流量周报图表'})
chart.set_y_axis({'name': 'Mb/s'})

worksheet.insert_chart('A8', chart)
workbook.close()
监视网卡的网络流动情况(rrdtool
https://www.cnblogs.com/FRESHMANS/p/8427737.html
# -*- coding: utf-8 -*-
import python-rrdtool
import time, psutil

total_input_traffic = psutil.net_io_counters()[1]
total_output_traffic = psutil.net_io_counters()[0]
starttime = int(time.time())

update = rrdtool.updatev('/home/test/rrdtool/Flow.rrd',
                         '%s:%s:%s' % (str(starttime), str(total_input_traffic), str(total_output_traffic)))
print(update )

Traceroute()追踪路由轨迹

#!/usr/bin/evn python
#-*-coding:utf-8 -*-
import time,os
import logging,warnings
import subprocess
from scapy.as_resolvers import AS_resolver_radb

from scapy.all import traceroute
warnings.filterwarnings("ignore",category=DeprecationWarning)
logging.getLogger("scapy.runtime").setLevel(logging.ERROR)
domains ='192.168.235.29'

try:
    domain = domains.split(' ')
    res,unans = traceroute(domains,dport=[80,443],retry=-2)
    # res.graph(target=">test.svg")
    res.graph(target="> test.svg", ASres=AS_resolver_radb(), type="svg")
    os.system("/usr/bin/convert test.svg test.png")


    time.sleep(1)
except:
    print ("you shoud run by root or domain error")

 浙公网安备 33010602011771号