Stanford coursera Andrew Ng 机器学习课程第二周总结(附Exercise 1)
Exercise 1:Linear Regression---实现一个线性回归
重要公式
1.h(θ)函数

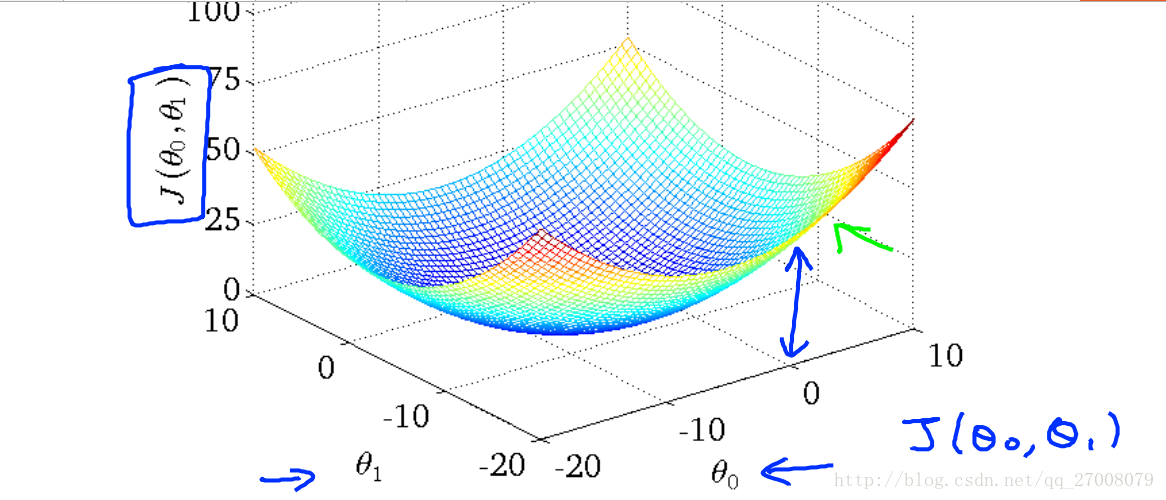
2.J(θ)函数

思考一下,在matlab里面怎么表达?如下:

原理如下:(如果你懂了这道作业题,上面的也就懂了)

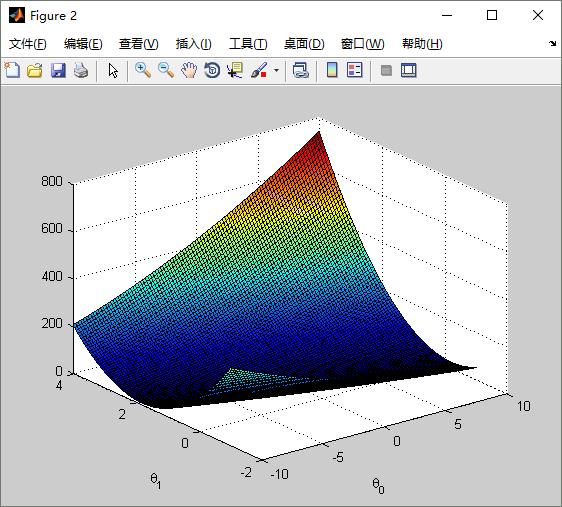
下面通过图形方式感受一下代价函数 :
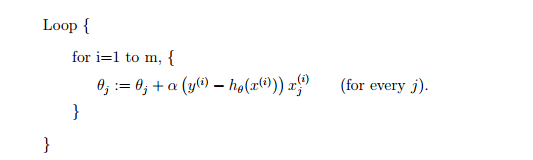
3.θ迭代过程(梯度下降)
First way:批梯度下降:(编程作业使用这个公式,sum转换同理J(θ))

Second way:随机梯度下降:
好比我们下山,每次在一点环顾四周,往最陡峭的路向下走,用图形的方式更形象的表示 :

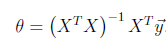
4.θ的直接求解法(让代价函数导数为0,求θ值)
编程作业答案(红色为添加代码)
1.warmUpExercise.m
function A = warmUpExercise()
%WARMUPEXERCISE Example function in octave
%   A = WARMUPEXERCISE() is an example function that returns the 5x5 identity matrix


% ============= YOUR CODE HERE ==============
% Instructions: Return the 5x5 identity matrix
%               In octave, we return values by defining which variables
%               represent the return values (at the top of the file)
%               and then set them accordingly.

A = eye(5,5);

% ===========================================

end
2.plotData.m
function plotData(x, y)
%PLOTDATA Plots the data points x and y into a new figure
%   PLOTDATA(x,y) plots the data points and gives the figure axes labels of
%   population and profit.

figure; % open a new figure window

% ====================== YOUR CODE HERE ======================
% Instructions: Plot the training data into a figure using the
%               "figure" and "plot" commands. Set the axes labels using
%               the "xlabel" and "ylabel" commands. Assume the
%               population and revenue data have been passed in
%               as the x and y arguments of this function.
%
% Hint: You can use the 'rx' option with plot to have the markers
%       appear as red crosses. Furthermore, you can make the
%       markers larger by using plot(..., 'rx', 'MarkerSize', 10);

plot(x,y, 'rx', 'MarkerSize', 10);
xlabel('Population of City in 10,000s');
ylabel('Profit in $10,000s');

% ============================================================

end
3.gradientDescent.m
function [theta, J_history] = gradientDescent(X, y, theta, alpha, num_iters)
%GRADIENTDESCENT Performs gradient descent to learn theta
%   theta = GRADIENTDESENT(X, y, theta, alpha, num_iters) updates theta by
%   taking num_iters gradient steps with learning rate alpha

% Initialize some useful values
m = length(y); % number of training examples
J_history = zeros(num_iters, 1);

for iter = 1:num_iters

    % ====================== YOUR CODE HERE ======================
    % Instructions: Perform a single gradient step on the parameter vector
    %               theta.
    %
    % Hint: While debugging, it can be useful to print out the values
    %       of the cost function (computeCost) and gradient here.
    %
    % ============================================================
theta = theta - (alpha/m)*X'*(X*theta-y); % theta 就是用上面的向量表示法的 matlab 语言实现
    % Save the cost J in every iteration
    J_history(iter) = computeCost(X, y, theta);

end

end
4.computeCost.m
function J = computeCost(X, y, theta)
%COMPUTECOST Compute cost for linear regression
%   J = COMPUTECOST(X, y, theta) computes the cost of using theta as the
%   parameter for linear regression to fit the data points in X and y

% Initialize some useful values
m = length(y); % number of training examples

% You need to return the following variables correctly
J = 0;

% ====================== YOUR CODE HERE ======================
% Instructions: Compute the cost of a particular choice of theta
%               You should set J to the cost.

J=1/(2*m)*(X*theta-y)'*(X*theta-y);

% =========================================================================

end
5.运行结果
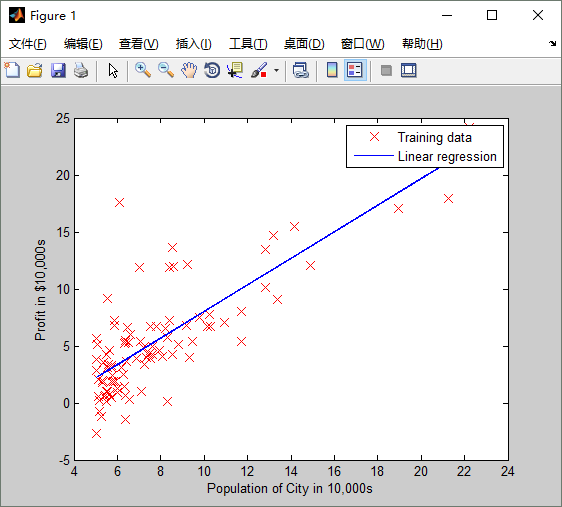
                      For population = 35,000, we predict a profit of 4519.767868
                      For population = 70,000, we predict a profit of 45342.450129

 浙公网安备 33010602011771号