
http://bean-li.github.io/blktrace-to-report/
前言
上篇博客介绍了iostat的一些输出,这篇介绍blktrace这个神器。上一节介绍iostat的时候,我们心心念念希望得到块设备处理io的service time,而不是service time + wait time,因为对于评估一个磁盘或者云磁盘而言,service time才是衡量磁盘性能的核心指标和直接指标。很不幸iostat无法提供这个指标,但是blktrace可以。
blktrace是一柄神器,很多工具都是基于该神器的:ioprof,seekwatcher,iowatcher,这个工具基本可以满足我们的对块设备请求的所有了解。
blktrace的原理
一个I/O请求,从应用层到底层块设备,路径如下图所示:
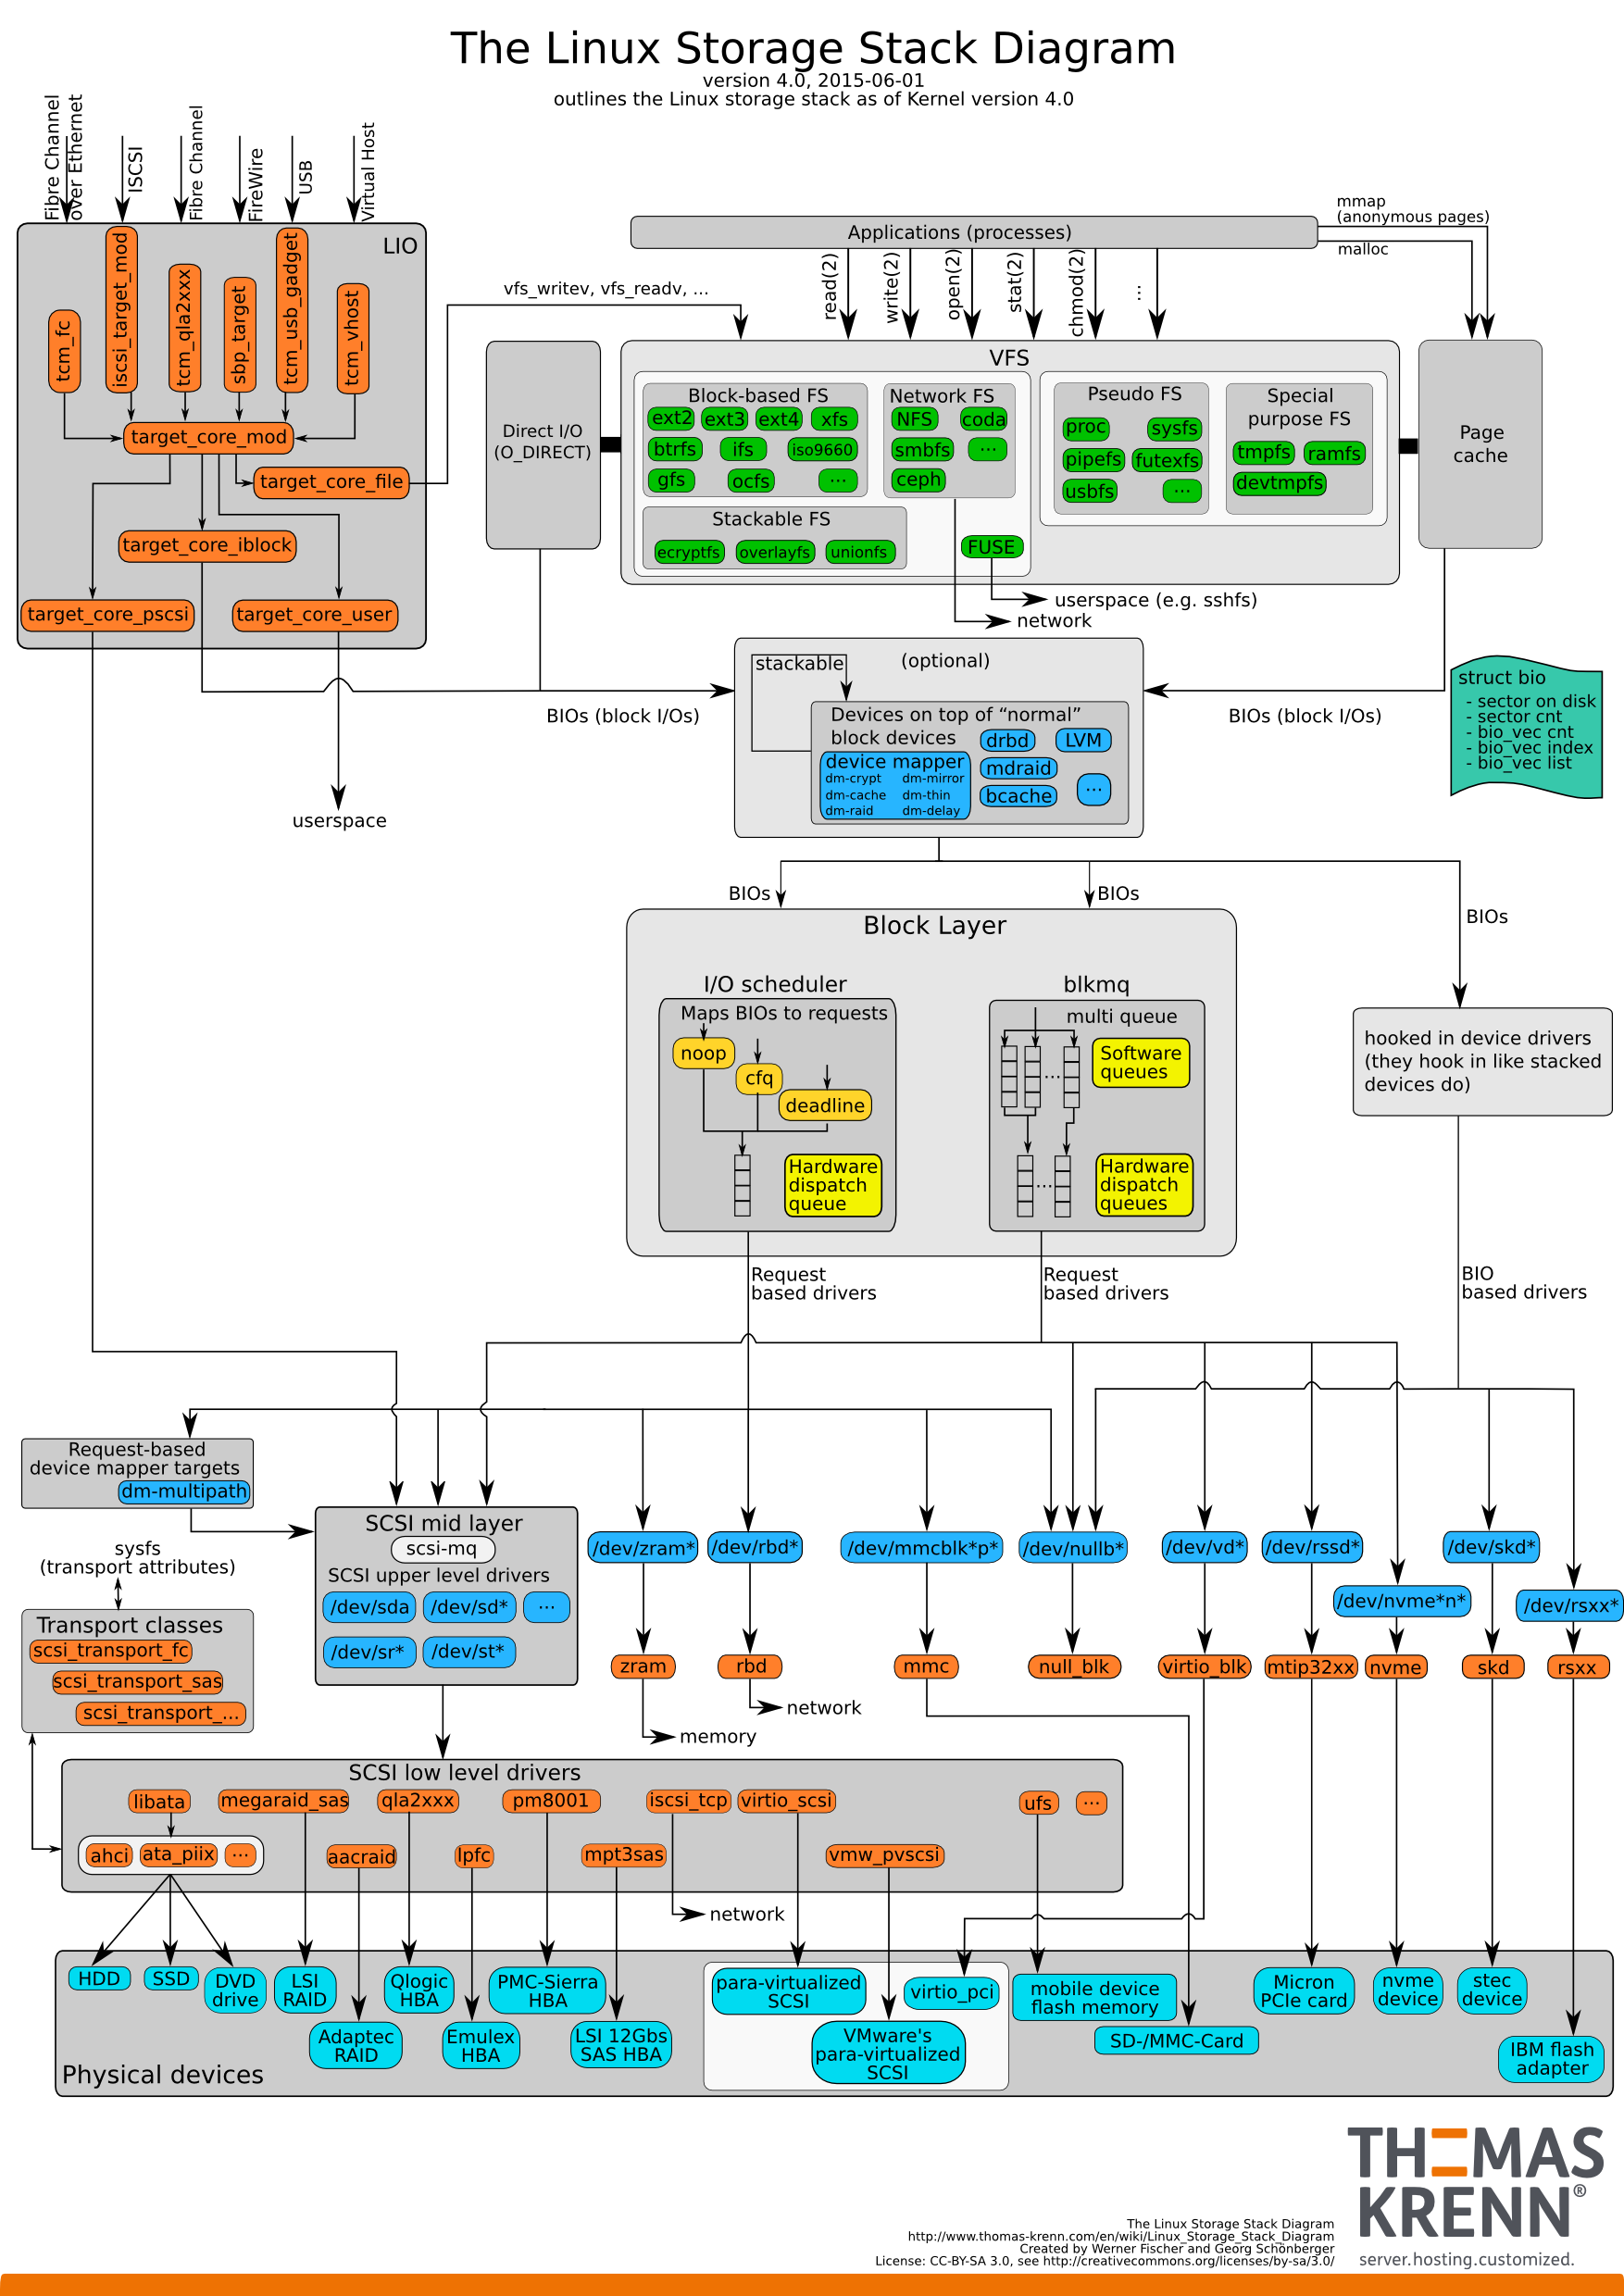
从上图可以看出IO路径是很复杂的。这么复杂的IO路径我们是无法用短短一篇小博文介绍清楚的。我们将IO路径简化一下:
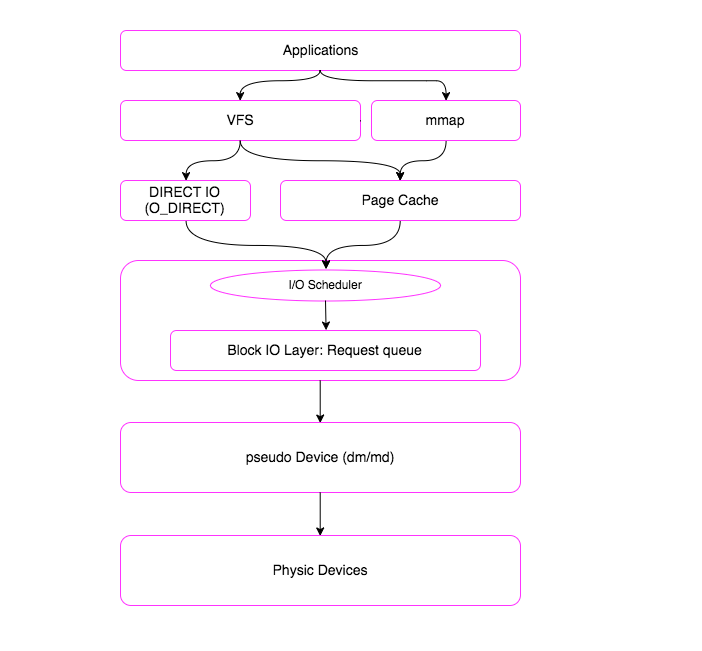
一个I/O请求进入block layer之后,可能会经历下面的过程:
- Remap: 可能被DM(Device Mapper)或MD(Multiple Device, Software RAID) remap到其它设备
- Split: 可能会因为I/O请求与扇区边界未对齐、或者size太大而被分拆(split)成多个物理I/O
- Merge: 可能会因为与其它I/O请求的物理位置相邻而合并(merge)成一个I/O
- 被IO Scheduler依照调度策略发送给driver
- 被driver提交给硬件,经过HBA、电缆(光纤、网线等)、交换机(SAN或网络)、最后到达存储设备,设备完成IO请求之后再把结果发回。
blktrace 能够记录下IO所经历的各个步骤:
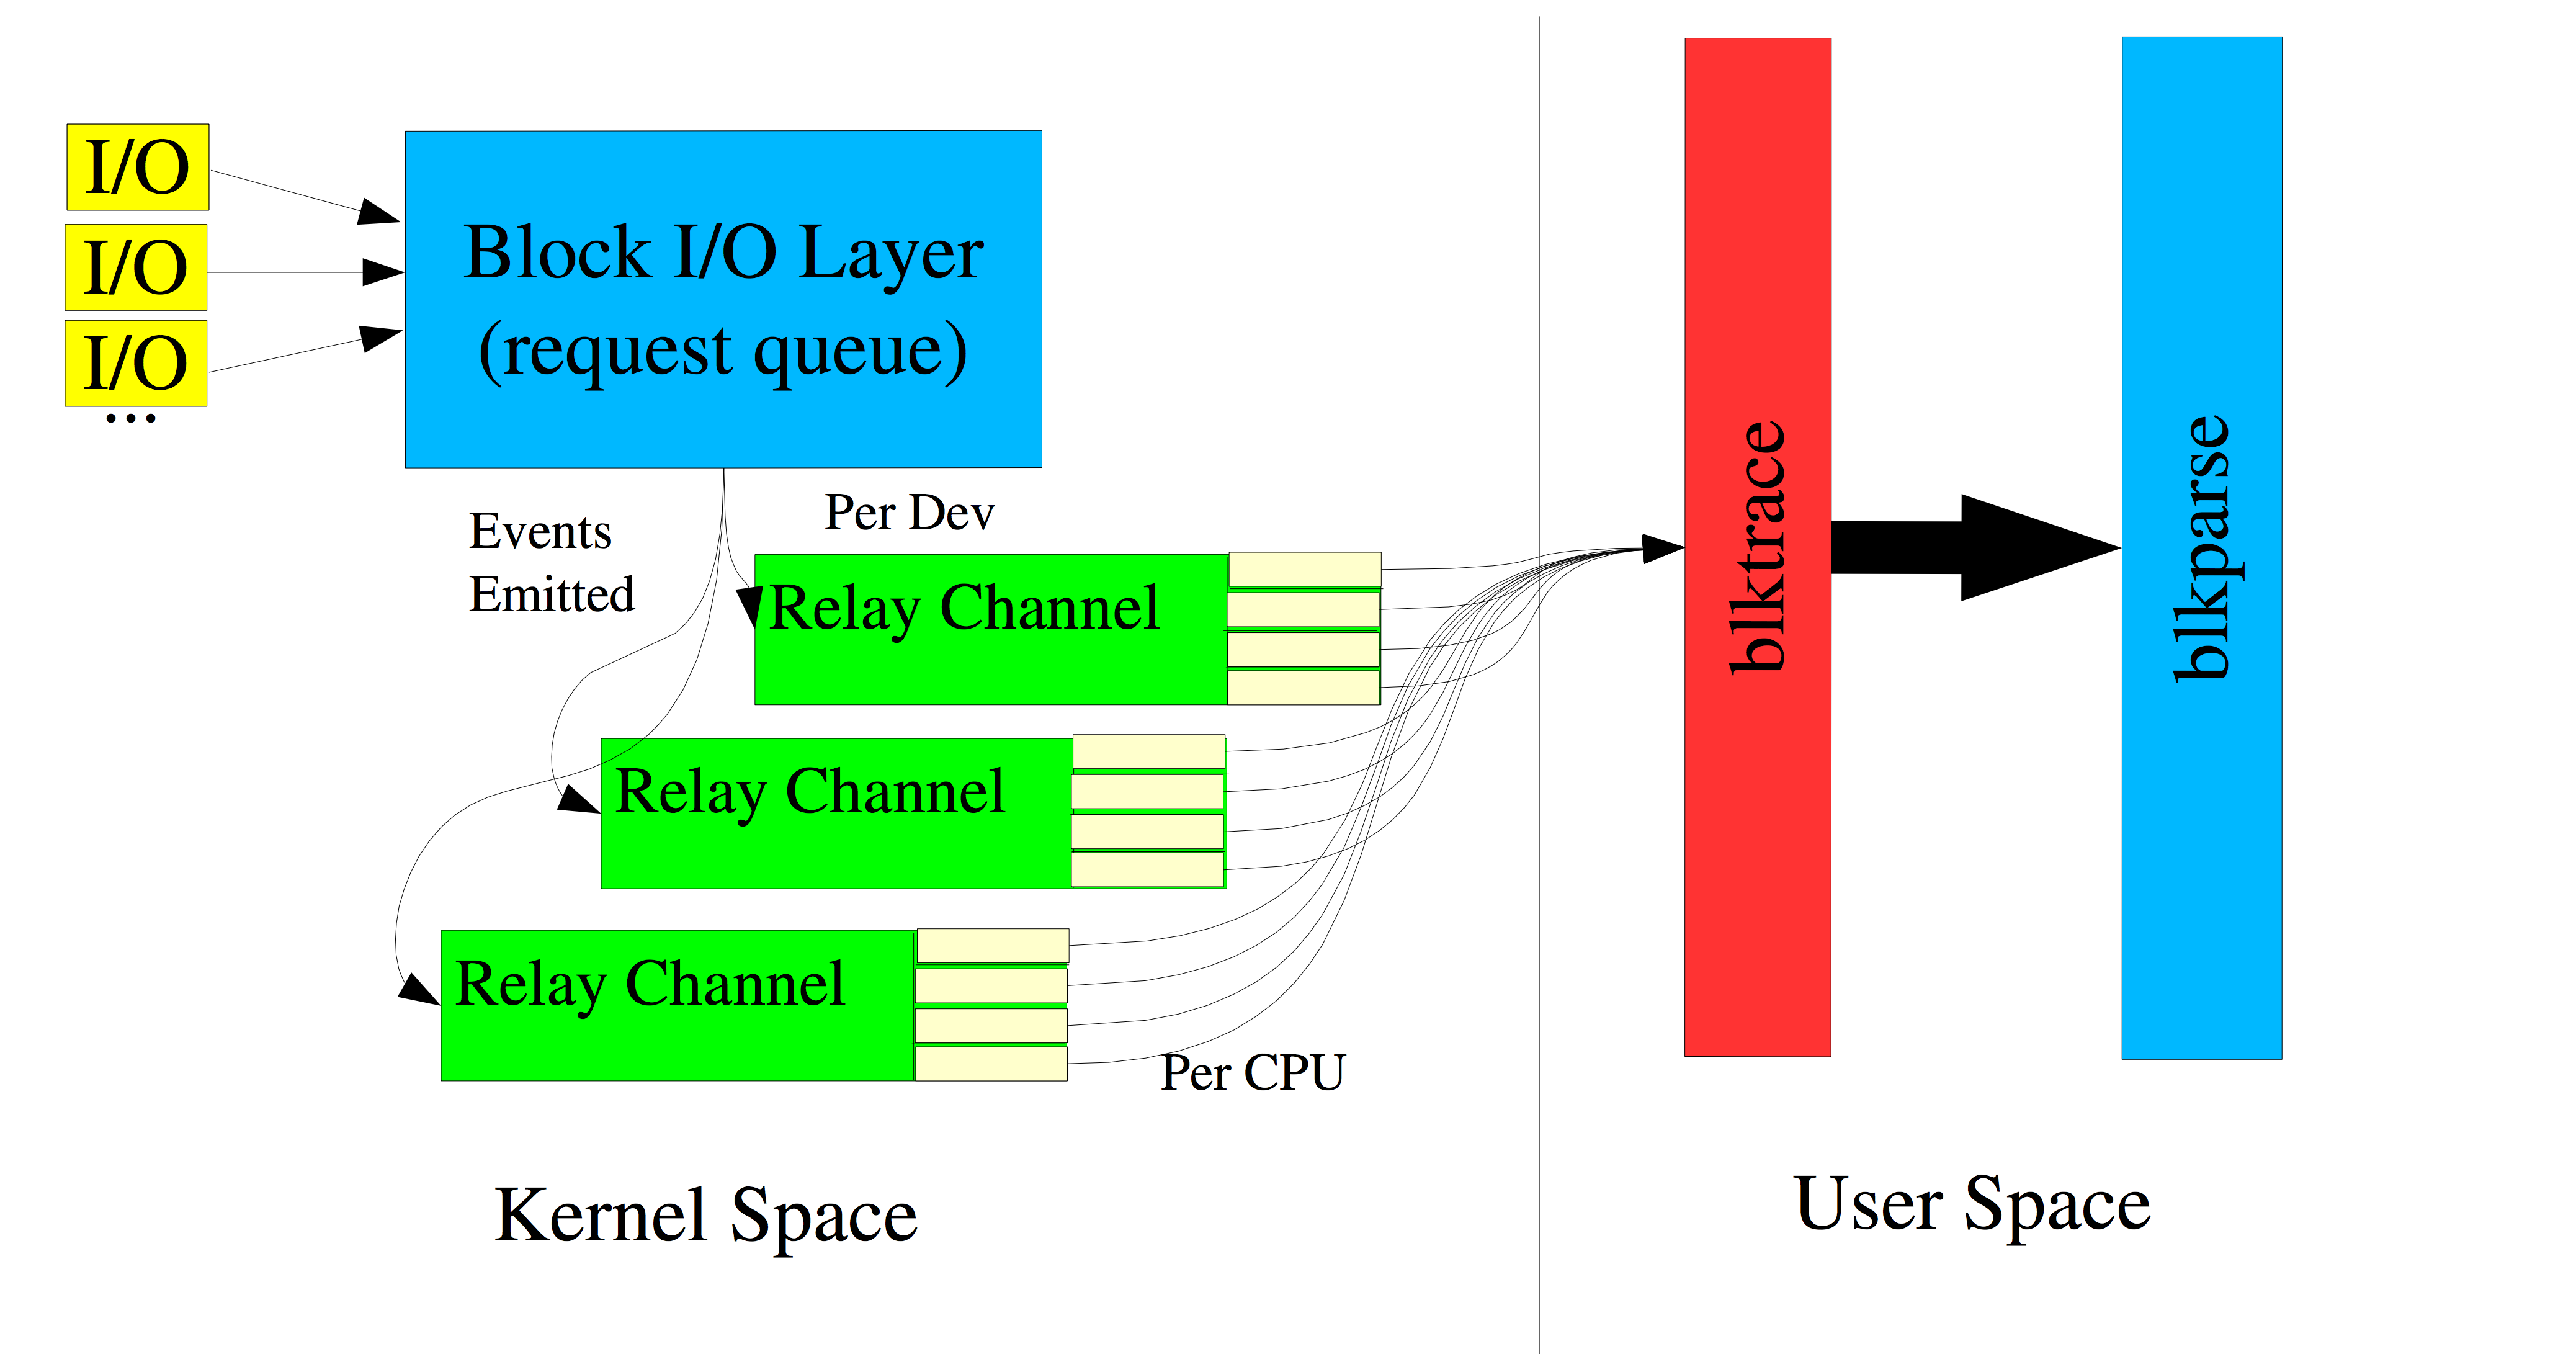
我们一起看下blktrace的输出长什么样子:
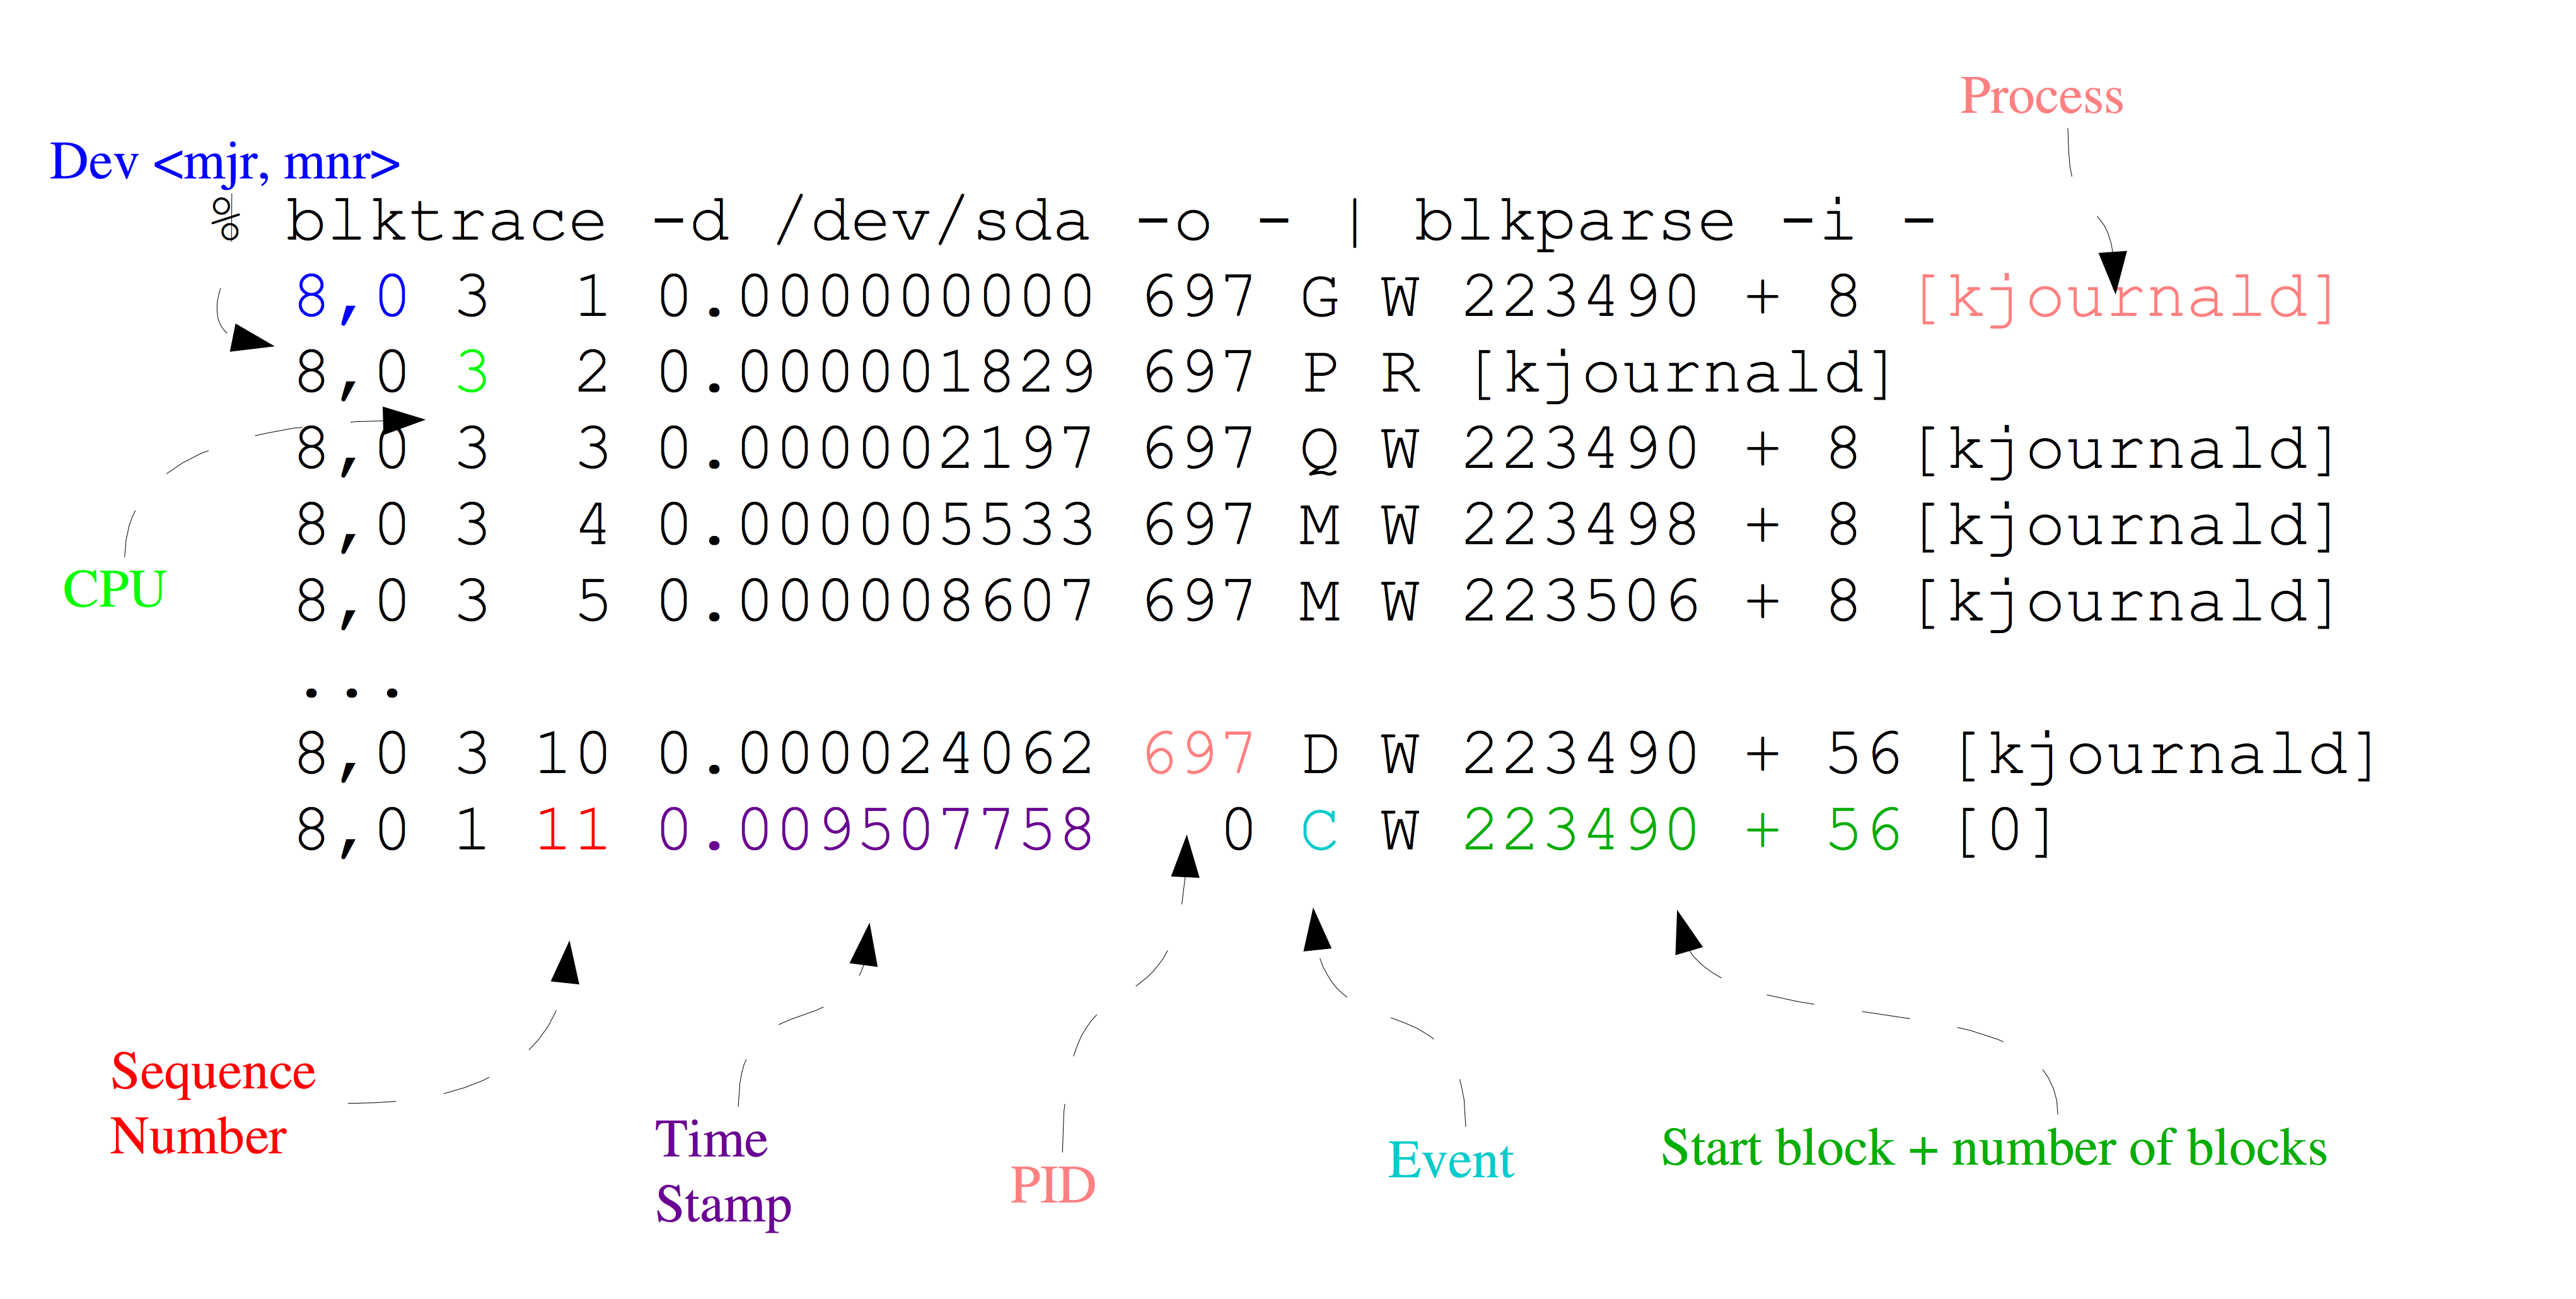
- 第一个字段:8,0 这个字段是设备号 major device ID和minor device ID。
- 第二个字段:3 表示CPU id
- 第三个字段:11 序列号,blkparse自己产生的一个序号
- 第四个字段:0.009507758 Time Stamp是时间偏移,单位纳秒ns
- 第五个字段:PID 本次IO对应的进程ID
- 第六个字段:Event,这个字段非常重要,反映了IO进行到了那一步
-
- A:表示IO被重新映射到不同的设备(IO was remapped to a different device)。
- B: IO反弹(io bounced)
- C: IO完成。(io completion)
- D: IO发送给驱动(io issued to driver)
- F: 在队列中请求合并前的IO(io front merged with request on queue)
- G: 获取请求(get request)
- I: IO插入到请求队列(io inserted onto request queue)
- M: 在队列中请求合并后的IO(io back merged with request on queue)
- P: 阻塞请求(Plug request)
- Q: IO已被请求队列处理(io handled by request queue code)
- S: 请求睡眠(sleep request)
- T: 拔下由于超时(unplug due to timeout)
- U: 分发请求(unplug request)
- X: 分拆IO(split)
- 第七个字段:R表示 Read, W是Write,D表示block忽略块命令,B表示Barrier Operation,S表示同步命令
- 第八个字段:223490+56,表示的是起始block number 和 number of blocks,即我们常说的Offset 和 Size,起始扇区号+扇区个数[<-(映射设备的主次设备号)起始扇区号]
- 第九个字段: 进程名
其中第六个字段非常有用:每一个字母都代表了IO请求所经历的某个阶段,其中最重要的几个阶段如下:
Q – 即将生成IO请求
|
G – IO请求生成
|
I – IO请求进入IO Scheduler队列
|
D – IO请求进入driver
|
C – IO请求执行完毕
 Q------->G------------>I--------->M------------------->D----------------------------->C
 |-Q time-|-Insert time-|
 |--------- merge time ------------|-merge with other IO|
 |----------------scheduler time time-------------------|---driver,adapter,storagetime--|

 |----------------------- await time in iostat output ----------------------------------|
Q2Q — time between requests sent to the block layer
Q2G — timefrom a block I/O is queued to the time it gets a request allocatedforit(生产IO请求耗费的时间,包括remap和split的时间)
G2I — time from a request is allocated to the time it is Inserted into the device's queue(IO请求进入IO Scheduler所消耗的时间,包括merge的时间)
Q2M — timefrom a block I/O is queued to the time it gets merged with an existing request
I2D — timefrom a request is inserted into the device's queue to the time it is actually issued to the device(IO请求在IO Scheduler中因等待所耗费的时间)
M2D — time froma block I/O is merged with an exiting request until the request is issued to the device
D2C — service time of the request by the device(IO请求在driver和硬件设备中耗费的时间)
Q2C — total time spent in the block layerfora request(整个IO请求所消耗的时间(Q2I + I2D + D2C = Q2C),相当于iostat的await)
*红色部分为我们需要特别关注的部分
注意,整个IO路径,分成很多段,每一段开始的时候,都会有一个时间戳,根据上一段开始的时间和下一段开始的时间,就可以得到IO 路径各段花费的时间。
注意,我们心心念念的service time,也就是反应块设备处理能力的指标,就是从D到C所花费的时间,简称D2C。
而iostat输出中的await,即整个IO从生成请求到IO请求执行完毕,即从Q到C所花费的时间,我们简称Q2C。
我们知道Linux 有I/O scheduler,调度器的效率如何,I2D是重要的指标。
如果I/O性能慢的话,以上指标有助于进一步定位缓慢发生的地方:
D2C可以作为硬件性能的指标;
I2D可以作为IO Scheduler性能的指标。
注意,这只是blktrace输出的一个部分,很明显,我们还能拿到offset和size,根据offset,我们能拿到某一段时间里,应用程序都访问了整个块设备的那些block,从而绘制出块设备访问轨迹图。
另外还有size和第七个字段(Read or Write),我们可以知道IO size的分布直方图。对于本文来讲,我们就是要根据blktrace来获取这些信息。
blktrace、blkparse和btt
我们接下来简单介绍这些工具的使用,其中这三个命令都是属于blktrace这个包的,他们是一家人。
首先通过如下命令,可以查看磁盘上的实时信息:
blktrace -d /dev/sdb -o – | blkparse -i –
这个命令会连绵不绝地出现很多输出,当你输入ctrl+C的时候,会停止。
当然了,你也可以先用如下命令采集信息,待所有信息采集完毕后,统一分析所有采集到的数据。搜集信息的命令如下:
blktrace -d /dev/sdb
注意,这个命令并不是只输出一个文件,他会根据CPU的个数上,每一个CPU都会输出一个文件,如下所示:
-rw-r--r-- 1 manu manu  1.3M Jul  6 19:58 sdb.blktrace.0
-rw-r--r-- 1 manu manu  823K Jul  6 19:58 sdb.blktrace.1
-rw-r--r-- 1 manu manu  2.8M Jul  6 19:58 sdb.blktrace.10
-rw-r--r-- 1 manu manu  1.9M Jul  6 19:58 sdb.blktrace.11
-rw-r--r-- 1 manu manu  474K Jul  6 19:58 sdb.blktrace.12
-rw-r--r-- 1 manu manu  271K Jul  6 19:58 sdb.blktrace.13
-rw-r--r-- 1 manu manu  578K Jul  6 19:58 sdb.blktrace.14
-rw-r--r-- 1 manu manu  375K Jul  6 19:58 sdb.blktrace.15
-rw-r--r-- 1 manu manu  382K Jul  6 19:58 sdb.blktrace.16
-rw-r--r-- 1 manu manu  478K Jul  6 19:58 sdb.blktrace.17
-rw-r--r-- 1 manu manu  839K Jul  6 19:58 sdb.blktrace.18
-rw-r--r-- 1 manu manu  848K Jul  6 19:58 sdb.blktrace.19
-rw-r--r-- 1 manu manu  1.6M Jul  6 19:58 sdb.blktrace.2
-rw-r--r-- 1 manu manu  652K Jul  6 19:58 sdb.blktrace.20
-rw-r--r-- 1 manu manu  738K Jul  6 19:58 sdb.blktrace.21
-rw-r--r-- 1 manu manu  594K Jul  6 19:58 sdb.blktrace.22
-rw-r--r-- 1 manu manu  527K Jul  6 19:58 sdb.blktrace.23
-rw-r--r-- 1 manu manu 1005K Jul  6 19:58 sdb.blktrace.3
-rw-r--r-- 1 manu manu  1.2M Jul  6 19:58 sdb.blktrace.4
-rw-r--r-- 1 manu manu  511K Jul  6 19:58 sdb.blktrace.5
-rw-r--r-- 1 manu manu  2.3M Jul  6 19:58 sdb.blktrace.6
-rw-r--r-- 1 manu manu  1.3M Jul  6 19:58 sdb.blktrace.7
-rw-r--r-- 1 manu manu  2.1M Jul  6 19:58 sdb.blktrace.8
-rw-r--r-- 1 manu manu  1.1M Jul  6 19:58 sdb.blktrace.9
有了输出,我们可以通过blkparse -i sdb来分析采集的数据:
$ blktrace -d /dev/sdb
$ blkparse -i sdb
  # 第一个IO开始:
  8,16   1        1     0.000000000 18166  Q   R 0 + 1 [dd]
  8,16   1        0     0.000009827     0  m   N cfq18166S  /user.slice alloced
  8,16   1        2     0.000010451 18166  G   R 0 + 1 [dd]
  8,16   1        3     0.000011056 18166  P   N [dd]
  8,16   1        4     0.000012255 18166  I   R 0 + 1 [dd]
  8,16   1        0     0.000013477     0  m   N cfq18166S  /user.slice insert_request
  8,16   1        0     0.000014526     0  m   N cfq18166S  /user.slice add_to_rr
  8,16   1        5     0.000016643 18166  U   N [dd] 1
  8,16   1        0     0.000017522     0  m   N cfq workload slice:300
  8,16   1        0     0.000018880     0  m   N cfq18166S  /user.slice set_active wl_class:0 wl_type:2
  8,16   1        0     0.000020594     0  m   N cfq18166S  /user.slice fifo=          (null)
  8,16   1        0     0.000021462     0  m   N cfq18166S  /user.slice dispatch_insert
  8,16   1        0     0.000022898     0  m   N cfq18166S  /user.slice dispatched a request
  8,16   1        0     0.000023786     0  m   N cfq18166S  /user.slice activate rq, drv=1
  8,16   1        6     0.000023977 18166  D   R 0 + 1 [dd]
  8,16   0        1     0.014270153     0  C   R 0 + 1 [0]
  # 第一个IO结束。
  8,16   0        0     0.014278115     0  m   N cfq18166S  /user.slice complete rqnoidle 0
  8,16   0        0     0.014280044     0  m   N cfq18166S  /user.slice set_slice=100
  8,16   0        0     0.014282217     0  m   N cfq18166S  /user.slice arm_idle: 8 group_idle: 0
  8,16   0        0     0.014282728     0  m   N cfq schedule dispatch
  # 第二个IO开始:
  8,16   1        7     0.014298247 18166  Q   R 1 + 1 [dd]
  8,16   1        8     0.014300522 18166  G   R 1 + 1 [dd]
  8,16   1        9     0.014300984 18166  P   N [dd]
  8,16   1       10     0.014301996 18166  I   R 1 + 1 [dd]
  8,16   1        0     0.014303864     0  m   N cfq18166S  /user.slice insert_request
  8,16   1       11     0.014304981 18166  U   N [dd] 1
  8,16   1        0     0.014306368     0  m   N cfq18166S  /user.slice dispatch_insert
  8,16   1        0     0.014307793     0  m   N cfq18166S  /user.slice dispatched a request
  8,16   1        0     0.014308763     0  m   N cfq18166S  /user.slice activate rq, drv=1
  8,16   1       12     0.014308962 18166  D   R 1 + 1 [dd]
  8,16   0        2     0.014518615     0  C   R 1 + 1 [0]
  # 第二个IO结束。
  8,16   0        0     0.014523548     0  m   N cfq18166S  /user.slice complete rqnoidle 0
  8,16   0        0     0.014525334     0  m   N cfq18166S  /user.slice arm_idle: 8 group_idle: 0
  8,16   0        0     0.014525676     0  m   N cfq schedule dispatch
  # 第三个IO开始:
  8,16   1       13     0.014531022 18166  Q   R 2 + 1 [dd]
  ...
注:
在以上数据中,有一些记录的event类型是”m”,那是IO Scheduler的调度信息,对研究IO Scheduler问题有意义:
- cfq18166S – cfq是IO Scheduler的名称,18166是进程号,”S”表示Sync(同步IO),如果异步IO则用“A”表示(Async);
- 它们的第三列sequence number都是0;
- 它们表示IO Scheduler内部的关键函数,上例中是cfq,代码参见block/cfq-iosched.c,
注意,blkparse仅仅是将blktrace输出的信息转化成人可以阅读和理解的输出,但是,信息太多,太杂,人完全没法得到关键信息。 这时候btt就横空出世了,这个工具可以将blktrace采集回来的数据,进行分析,得到对人更有用的信息。事实上,btt也是我们的终点。
接下来,我们要利用blktrace blkparse 以及btt来采集和分析单块磁盘的的性能,最终我会生成一个pdf的文档。步骤如下:
输入: blktrace采集到的原始数据
输出: 使用btt,blkparse还有自己写的一些bash脚本和python脚本,输出出pdf格式的report
- 通过各种工具,生成原始的分析结果,以及绘制对应的PNG图片:
- 将分析结果以表格和图片的方式,写入markdown文本
- 将markdown 文本通过pandoc转换成pdf文档。
获取个阶段的延迟信息
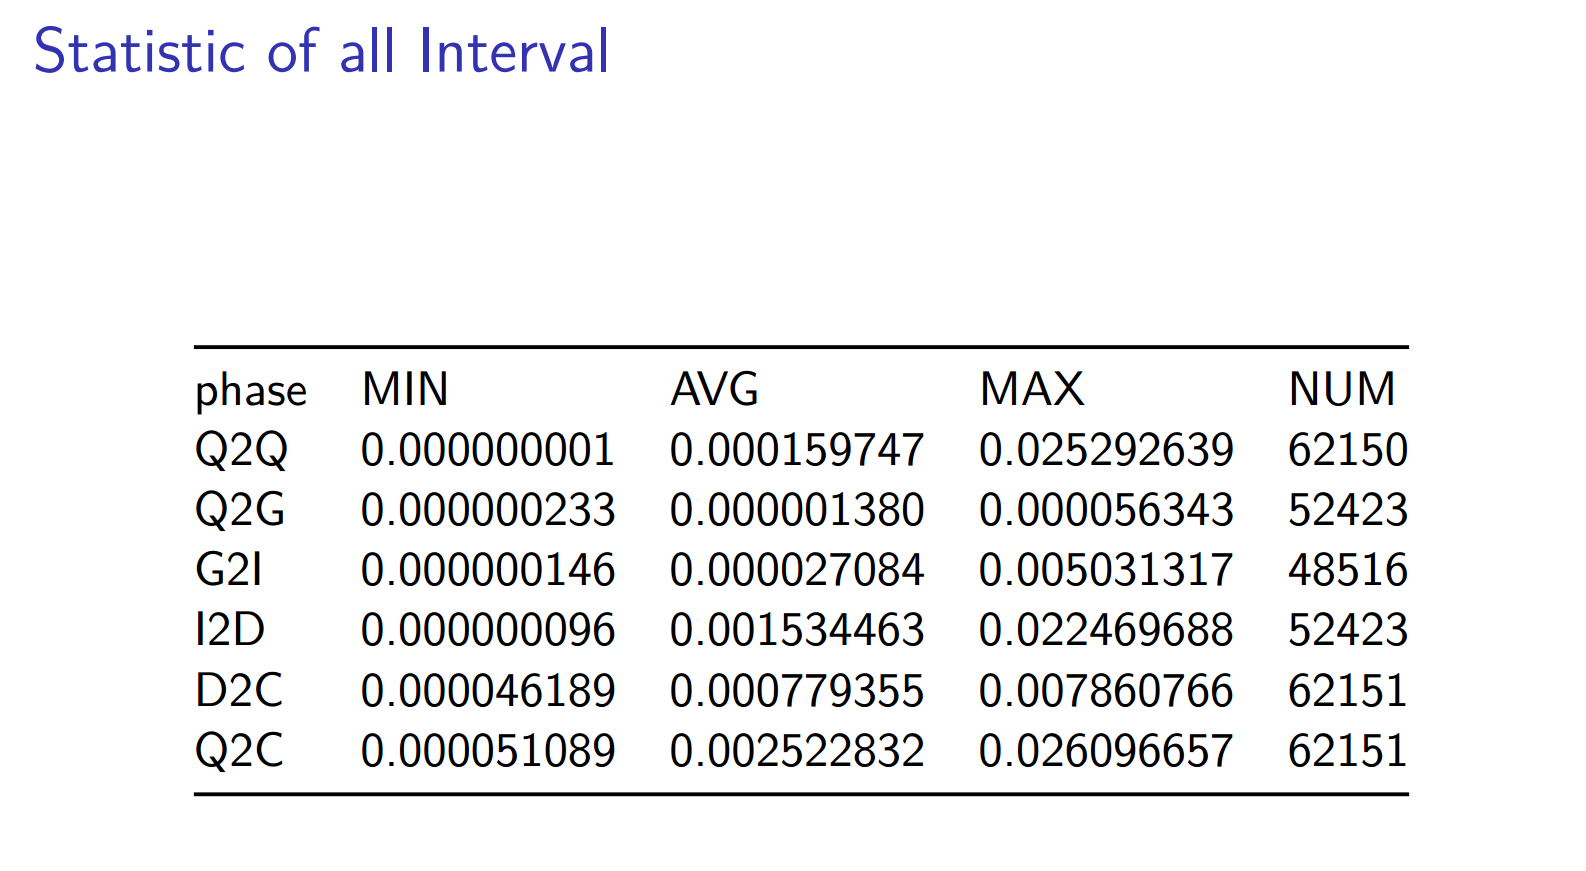
注意,btt已经可以很自如地生成这部分统计信息,我们可以很容易得到如下的表格:
方法如下:
首先blkparse可以将对应不同cpu的多个文件聚合成一个文件:
blkparse -i sdb -d sdb.blktrace.bin
然后btt就可以分析这个sdb.blktrace.bin了:
==================== All Devices ====================

            ALL           MIN           AVG           MAX           N
--------------- ------------- ------------- ------------- -----------

Q2Q               0.000000001   0.000159747   0.025292639       62150
Q2G               0.000000233   0.000001380   0.000056343       52423
G2I               0.000000146   0.000027084   0.005031317       48516
Q2M               0.000000142   0.000000751   0.000021613        9728
I2D               0.000000096   0.001534463   0.022469688       52423
M2D               0.000000647   0.002617691   0.022445412        5821
D2C               0.000046189   0.000779355   0.007860766       62151
Q2C               0.000051089   0.002522832   0.026096657       62151

==================== Device Overhead ====================

       DEV |       Q2G       G2I       Q2M       I2D       D2C
---------- | --------- --------- --------- --------- ---------
 (  8, 16) |   0.0461%   0.8380%   0.0047%  51.3029%  30.8921%
---------- | --------- --------- --------- --------- ---------
   Overall |   0.0461%   0.8380%   0.0047%  51.3029%  30.8921%

==================== Device Merge Information ====================

       DEV |       #Q       #D   Ratio |   BLKmin   BLKavg   BLKmax    Total
---------- | -------- -------- ------- | -------- -------- -------- --------
 (  8, 16) |    62151    52246     1.2 |        1       20      664  1051700

==================== Device Q2Q Seek Information ====================

       DEV |          NSEEKS            MEAN          MEDIAN | MODE
---------- | --------------- --------------- --------------- | ---------------
 (  8, 16) |           62151      42079658.0               0 | 0(17159)
---------- | --------------- --------------- --------------- | ---------------
   Overall |          NSEEKS            MEAN          MEDIAN | MODE
   Average |           62151      42079658.0               0 | 0(17159)

==================== Device D2D Seek Information ====================

       DEV |          NSEEKS            MEAN          MEDIAN | MODE
---------- | --------------- --------------- --------------- | ---------------
 (  8, 16) |           52246      39892356.2               0 | 0(9249)
---------- | --------------- --------------- --------------- | ---------------
   Overall |          NSEEKS            MEAN          MEDIAN | MODE
   Average |           52246      39892356.2               0 | 0(9249)
注意: D2C和Q2C,一个是表征块设备性能的关键指标,另一个是客户发起请求到收到响应的时间,我们可以看出,
D2C 平均在0.000779355 秒,即0.7毫秒 Q2C 平均在0.002522832 秒,即2.5毫秒。Q2G和G2I都较小,完全正常。
无论是service time 还是客户感知到的await time,都是非常短的,表现非常不俗。但是D2C花费的时间只占整个Q2C的30%, 51%以上的时间花费在I2D。
I2D较大应该是cfq scheduler的调度策略造成的,你可以试试其它scheduler,比如deadline,比较两者的差异,然后选择最适合你应用特点的那个。
下面我们看下D2C和Q2C随着时间的分布情况:
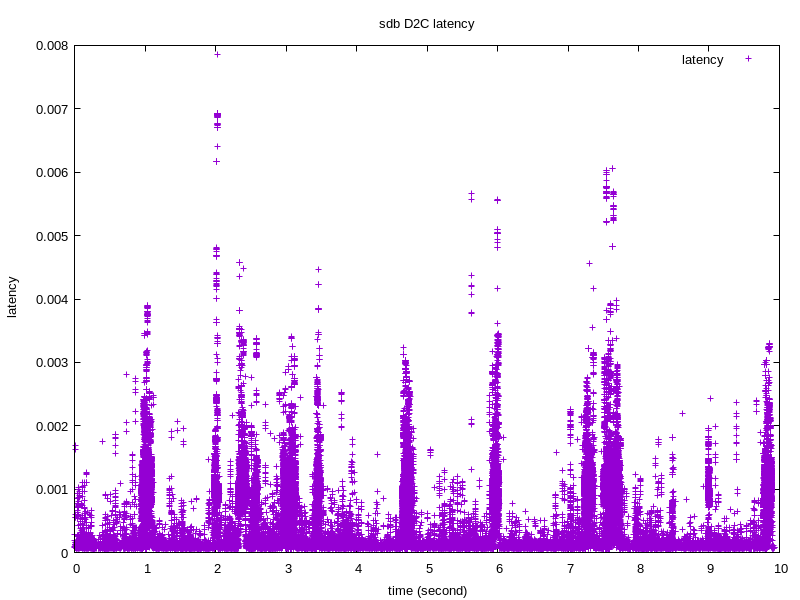
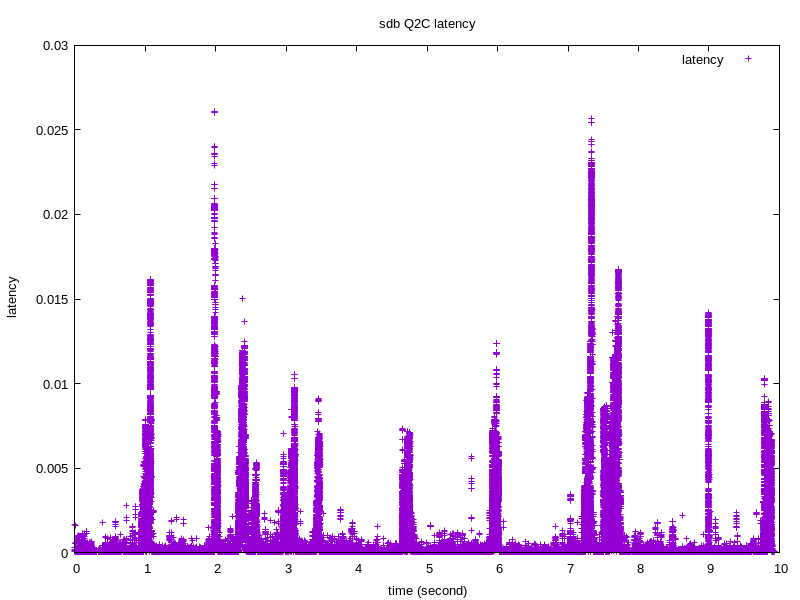
绘制图片需要的信息可以通过如下指令得到:
btt -i sdb.blktrace.bin -l sdb.d2c_latency
btt -i sdb.blktrace.bin -q sdb.q2c_latency
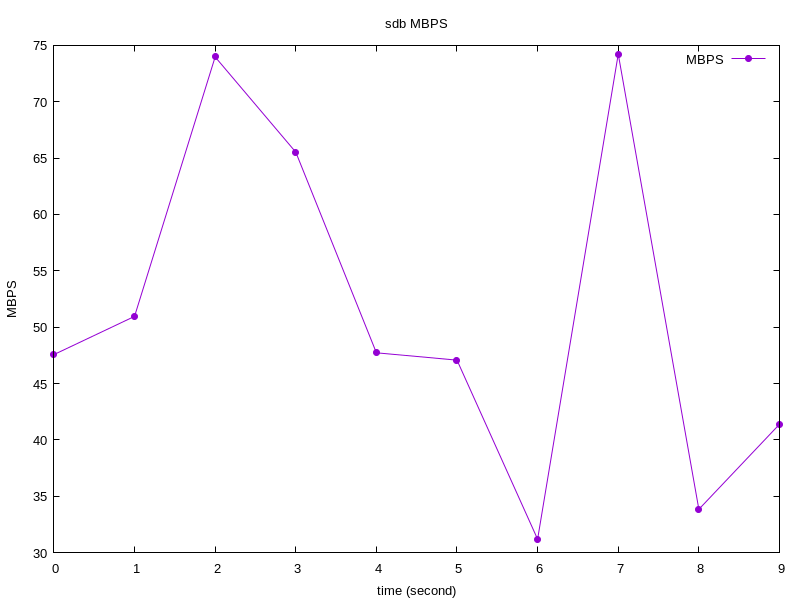
IOPS 和 MBPS
从btt出发,我们分析出来采样时间内,整个块设备的IOPS:
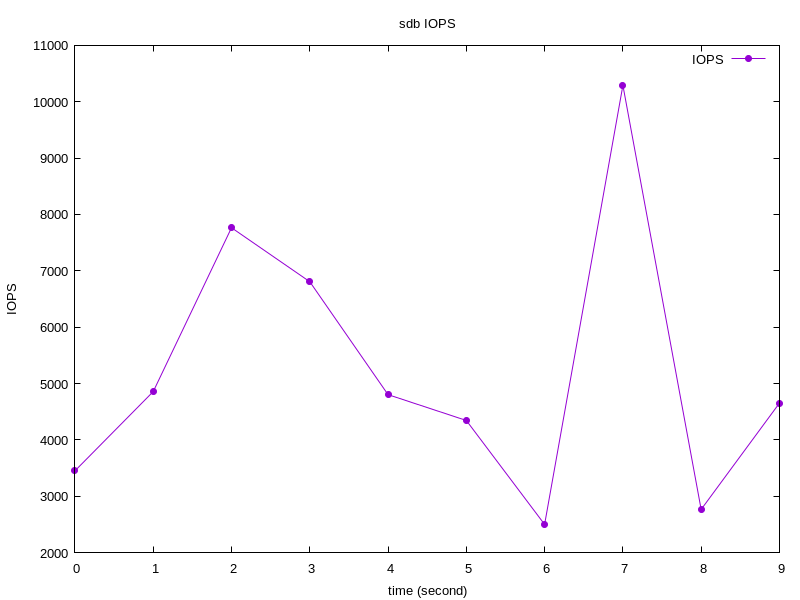
获取方法如下:
- blkparse -i sdb -d sdb.blktrace.bin
- btt -i sdb.blktrace.bin -q sdb.q2c_latency
注意,这一步之后,我们会得到如下文件:
- sdb.q2c_latency_8,16_q2c,dat
- sys_iops_fp.dat
- sys_mbps_fp.dat
- 8,16_iops_fp.dat
- 8,17_mbps_fp.dat
注意,如果我们blktrace -d sdb,只关注sdb的时候,我们可以通过sys_iops_fp.dat和sys_mbps_fp.dat获取对应的IOPS和MBPS信息:
cat sys_iops_fp.dat
0 3453
1 4859
2 7765
3 6807
4 4804
5 4345
6 2501
7 10291
8 2767
9 4654
IO Size Historgram
我们很关心,在采样的时间内,IO size的分布情况,因为这个可以得到,过去的时间里,我们是大IO居多还是小IO居多:
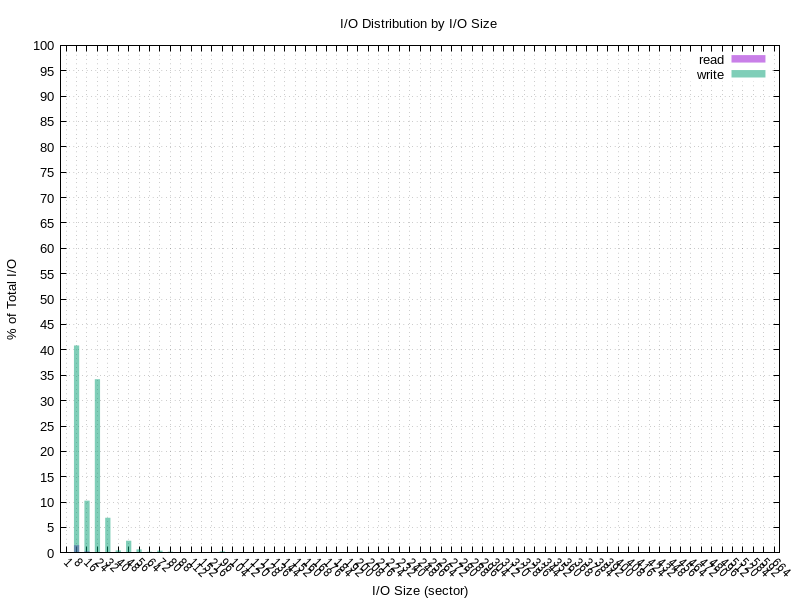
步骤如下:
- blkparse -i sdb -d sub.blktrace.bin
- btt -i sdb.blktrace.bin -B sdb.offset
这个步骤之后会生成三个文件:
- sdb.offset_8,16_r.dat
- sdb.offset_8,16_w.dat
- sdb.offset_8,16_c.dat
其中r表示读操作的offset和size信息,w表示写操作的offset和size信息,c表示读+写。
其输出格式如下:
 cat sdb.offset_8,16_w.dat
    0.000006500 74196632 74196656
    0.000194981 74196656 74196680
    0.000423532 21923304 21923336
    0.000597505 60868864 60868912
    0.001046757 20481496 20481520
    0.001137646 20481520 20481544
    0.002203609 21923336 21923360
    0.002288944 60868912 60868936
    0.002329903 21923360 21923384
    0.002895619 60868936 60868960
    0.004535853 20481544 20481576
    0.004841878 74196680 74196704
    0.004888624 60868960 60869008
    0.004991469 74196704 74196744
    0.005799109 74196744 74196800
    0.005880756 74196800 74196856
    0.007083202 74196856 74196880
    0.007172808 74196880 74196952
    0.007969956 60869008 60869040
    0.008297881 74196952 74196976
    0.008540390 74196976 74197000
    0.009995244 60869040 60869072
    0.010516189 74197000 74197032
    0.011409120 60869072 60869096
    0.011554233 60869096 60869120
    0.011996171 74197032 74197104
    ....
    9.908351667 74389976 74390000
    9.909115545 74390000 74390024
    9.909160991 74390024 74390048
    9.909688260 20665552 20665600
    9.909987699 61083560 61083584
    9.910271958 61083584 61083608
    9.911689305 20665600 20665624
    9.911785890 20665624 20665648
    9.917379146 20665648 20665672
    9.917471753 20665672 20665696
    9.928170104 74390048 74390072
    9.928249913 74390072 74390096
注意,第一个字段是时间,第二个字段是开始扇区即offset,第三个字段为结束扇区。不难根据第二个字段和第三个字段算出来size。当然了单位为扇区。
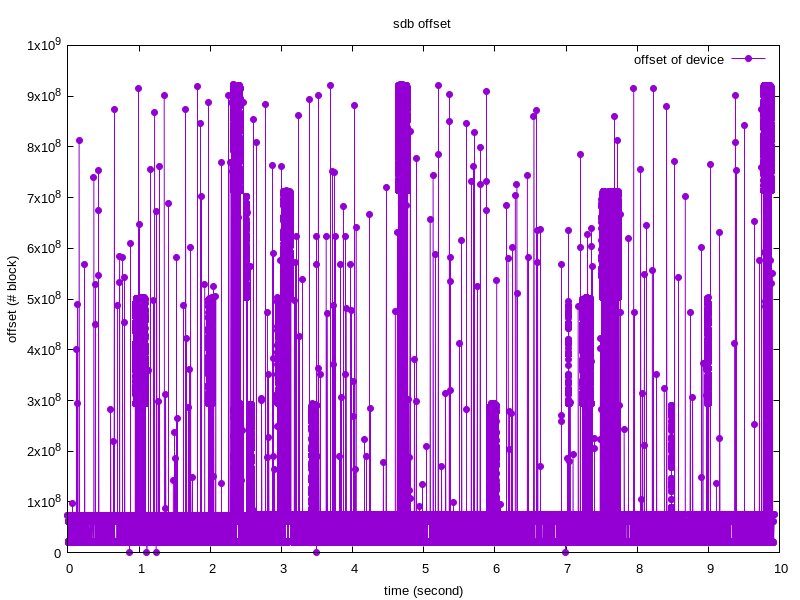
访问轨迹图
注意上小节,可以拿到不同时间里,访问磁盘的位置以及访问扇区的个数,如果不考虑访问扇区的个数,我们可以得到一张访问轨迹2D图:
如果把访问扇区的个数作为第三个维度,可以得到一张三维图
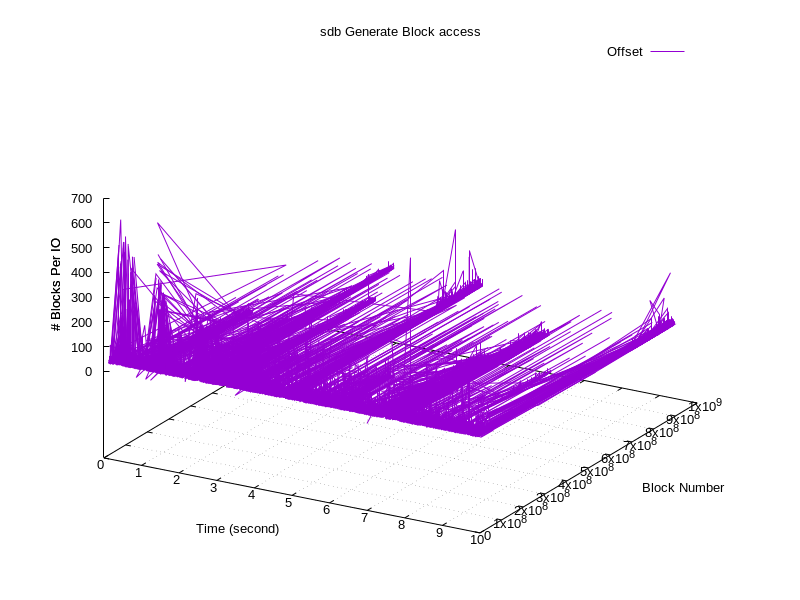
值得一提的是,blktrace对应用程序的性能影响极小,作者是这么说的:Seeing less than 2% hits to application performance in relatively stressful I/O situations。
2025-2-8补充:
对于IO过程中的Q、G、I、M、D、C等代表的意思一直未能找到合适的解释,终于在今天找到了详细解释的出处。
参见:https://github.com/efarrer/blktrace/blob/master/README

未防止原始文档被删除,此处复制源文件以记录
  1 Block IO Tracing
  2 ----------------
  3
  4 Written by Jens Axboe <axboe@kernel.dk> (initial version and kernel support),
  5 Alan D. Brunelle (threading and splitup into two seperate programs),
  6 Nathan Scott <nathans@sgi.com> (bug fixes, process names, multiple devices)
  7 Also thanks to Tom Zanussi <zanussi@us.ibm.com> for good input and
  8 patches.
  9
 10
 11 Requirements
 12 ------------
 13
 14 blktrace was integrated into the mainline kernel between 2.6.16 and 2.6.17-rc1.
 15 The target trace needs to run on a kernel at least that new.
 16
 17 git://git.kernel.dk/blktrace.git
 18
 19 If you don't have git, you can get hourly snapshots from:
 20
 21 http://brick.kernel.dk/snaps/
 22
 23 The snapshots include the full git object database as well. kernel.org has
 24 excessively long mirror times, so if you have git installed, you can pull
 25 the master tree from:
 26
 27 git://git.kernel.dk/blktrace.git
 28
 29 For browsing the repo over http and viewing history etc, you can direct
 30 your browser to:
 31
 32 http://git.kernel.dk/
 33
 34
 35 Usage
 36 -----
 37
 38 $ blktrace -d <dev> [ -r debug_path ] [ -o output ] [ -k ] [ -w time ]
 39             [ -a action ] [ -A action mask ]
 40
 41     -d Use specified device. May also be given last after options.
 42     -r Path to mounted debugfs, defaults to /sys/kernel/debug.
 43     -o File(s) to send output to.
 44     -D Directory to prepend to output file names.
 45     -k Kill running trace.
 46     -w Stop after defined time, in seconds.
 47     -a Only trace specific actions (use more -a options to add actions).
 48        Available actions are:
 49
 50         READ
 51         WRITE
 52         BARRIER
 53         SYNC
 54         QUEUE
 55         REQUEUE
 56         ISSUE
 57         COMPLETE
 58         FS
 59         PC
 60
 61     -A Give the trace mask directly as a number.
 62
 63     -b Sub buffer size in KiB.
 64     -n Number of sub buffers.
 65     -l Run in network listen mode (blktrace server)
 66     -h Run in network client mode, connecting to the given host
 67     -p Network port to use (default 8462)
 68     -s Disable network client use of sendfile() to transfer data
 69     -V Print program version info.
 70
 71 $ blkparse -i <input> [ -o <output> ] [ -b rb_batch ] [ -s ] [ -t ] [ -q ]
 72               [ -w start:stop ] [ -f output format ] [ -F format spec ]
 73               [ -d <binary> ]
 74
 75     -i Input file containing trace data, or '-' for stdin.
 76     -D Directory to prepend to input file names.
 77     -o Output file. If not given, output is stdout.
 78     -b stdin read batching.
 79     -s Show per-program io statistics.
 80     -h Hash processes by name, not pid.
 81     -t Track individual ios. Will tell you the time a request took to
 82        get queued, to get dispatched, and to get completed.
 83     -q Quiet. Don't display any stats at the end of the trace.
 84     -w Only parse data between the given time interval in seconds. If
 85        'start' isn't given, blkparse defaults the start time to 0.
 86     -d Dump sorted data in binary format
 87     -f Output format. Customize the output format. The format field
 88        identifiers are:
 89
 90         %a    - Action
 91         %c    - CPU ID
 92         %C    - Task command (process) name
 93         %d    - Direction (r/w)
 94         %D    - Device number
 95         %e    - Error number
 96         %M    - Major
 97         %m    - Minor
 98         %N    - Number of bytes
 99         %n    - Number of sectors
100         %p    - PID
101         %P    - PDU
102         %s    - Sequence number
103         %S    - Sector number
104         %t    - Time (wallclock - nanoseconds)
105         %T    - Time (wallclock - seconds)
106         %u    - Time (processing - microseconds)
107         %U    - Unplug depth
108
109     -F Format specification. The individual specifiers are:
110
111         A    - Remap
112         B    - Bounce
113         C    - Complete
114         D    - Issue
115         M    - Back merge
116         F    - Front merge
117         G    - Get request
118         I    - Insert
119         P    - Plug
120         Q    - Queue
121         R    - Requeue
122         S    - Sleep requests
123         T    - Unplug timer
124         U    - Unplug IO
125         W    - Bounce
126         X    - Split
127
128     -v More verbose for marginal errors.
129     -V Print program version info.
130
131 $ verify_blkparse filename
132
133     Verifies an output file from blkparse. All it does is check if
134     the events in the file are correctly time ordered. If an entry
135     is found that isn't ordered, it's dumped to stdout.
136
137 $ blkrawverify <dev> [<dev>...]
138
139     The blkrawverify utility can be used to verify data retrieved
140     via blktrace. It will check for valid event formats, forward
141     progressing sequence numbers and time stamps, also does reasonable
142     checks for other potential issues within invidividual events.
143
144     Errors found will be tracked in <dev>.verify.out.
145
146 If you want to do live tracing, you can pipe the data between blktrace
147 and blkparse:
148
149 % blktrace -d <device> -o - | blkparse -i -
150
151 This has a small risk of displaying some traces a little out of sync, since
152 it will do batch sorts of input events. Similarly, you can do traces over
153 the network. The network 'server' must run:
154
155 % blktrace -l
156
157 to listen to incoming blktrace connections, while the client should use
158
159 % blktrace -d /dev/sda -h <server hostname>
160
161 to connect and transfer data over the network.
162
163
164 Documentation
165 -------------
166
167 A users guide is distributed with the source. It is in latex, a
168 'make docs' will build a PDF in doc/. You need tetex and latex installed
169 to build the document.
170
171
172 Resources
173 ---------
174
175 vger hosts a mailing list dedicated to btrace discussion and development.
176 The list is called linux-btrace@vger.kernel.org, subscribe by sending
177 a mail to majordomo@vger.kernel.org with 'subscribe linux-btrace' in
178 the mail body.
179
180
181
182 2006-09-05, Jens Axboe <axboe@kernel.dk>
这是我自己理解的BIO的流程,不保证正确。错误之处,还望指正。


 浙公网安备 33010602011771号