Python性能分析工具
本文主要讲了如何使用 time、perf、line_profiler
测试python文件
call.py
def call():
    return True

for i in range(10000000):
    call()
time使用
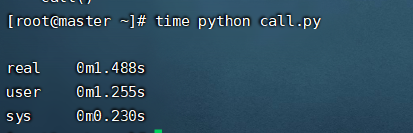
time python call.py
- real 总耗时 1.488秒
- user 用户态耗时 1.255 秒
- sys 内核态耗时0.230秒
perf使用
perf --help 之后可以看到perf的二级命令。
| 序号 | 命令 | 作用 |
|---|---|---|
| 1 | annotate | 解析perf record生成的perf.data文件,显示被注释的代码。 |
| 2 | archive | 根据数据文件记录的build-id,将所有被采样到的elf文件打包。利用此压缩包,可以再任何机器上分析数据文件中记录的采样数据。 |
| 3 | bench | perf中内置的benchmark,目前包括两套针对调度器和内存管理子系统的benchmark。 |
| 4 | buildid-cache | 管理perf的buildid缓存,每个elf文件都有一个独一无二的buildid。buildid被perf用来关联性能数据与elf文件。 |
| 5 | buildid-list | 列出数据文件中记录的所有buildid。 |
| 6 | diff | 对比两个数据文件的差异。能够给出每个符号(函数)在热点分析上的具体差异。 |
| 7 | evlist | 列出数据文件perf.data中所有性能事件。 |
| 8 | inject | 该工具读取perf record工具记录的事件流,并将其定向到标准输出。在被分析代码中的任何一点,都可以向事件流中注入其它事件。 |
| 9 | kmem | 针对内核内存(slab)子系统进行追踪测量的工具 |
| 10 | kvm | 用来追踪测试运行在KVM虚拟机上的Guest OS。 |
| 11 | list | 列出当前系统支持的所有性能事件。包括硬件性能事件、软件性能事件以及检查点。 |
| 12 | lock | 分析内核中的锁信息,包括锁的争用情况,等待延迟等。 |
| 13 | mem | 内存存取情况 |
| 14 | record | 收集采样信息,并将其记录在数据文件中。随后可通过其它工具对数据文件进行分析。 |
| 15 | report | 读取perf record创建的数据文件,并给出热点分析结果。 |
| 16 | sched | 针对调度器子系统的分析工具。 |
| 17 | script | 执行perl或python写的功能扩展脚本、生成脚本框架、读取数据文件中的数据信息等。 |
| 18 | stat | 执行某个命令,收集特定进程的性能概况,包括CPI、Cache丢失率等。 |
| 19 | test | perf对当前软硬件平台进行健全性测试,可用此工具测试当前的软硬件平台是否能支持perf的所有功能。 |
| 20 | timechart | 针对测试期间系统行为进行可视化的工具 |
| 21 | top | 类似于linux的top命令,对系统性能进行实时分析。 |
| 22 | trace | 关于syscall的工具。 |
| 23 | probe | 用于定义动态检查点。 |
全局性概况:
perf list 查看当前系统支持的性能事件;
perf bench 对系统性能进行摸底;
perf test 对系统进行健全性测试;
perf stat 对全局性能进行统计;
全局细节:
perf top 可以实时查看当前系统进程函数占用率情况;
perf probe 可以自定义动态事件;
特定功能分析:
perf kmem 针对slab子系统性能分析;
perf kvm 针对kvm虚拟化分析;
perf lock 分析锁性能;
perf mem 分析内存slab性能;
perf sched 分析内核调度器性能;
perf trace 记录系统调用轨迹;
最常用功能perf record,可以系统全局,也可以具体到某个进程,更甚具体到某一进程某一事件;可宏观,也可以很微观。
perf record –e cpu-clock python call.py
pref record 记录信息到perf.data;perf report 生成报告;
perf diff 对两个记录进行diff;
perf evlist 列出记录的性能事件;
perf annotate 显示perf.data函数代码;
perf archive 将相关符号打包,方便在其它机器进行分析;
perf script 将perf.data输出可读性文本;
可视化工具perf timechart
perf timechart record记录事件;
perf timechart生成output.svg文档;
关于perf top界面常用命令如下:
h:显示帮助,即可显示详细的帮助信息。
UP/DOWN/PGUP/PGDN/SPACE:上下和翻页。
a:annotate current symbol,注解当前符号。能够给出汇编语言的注解,给出各条指令的采样率。
d:过滤掉所有不属于此DSO的符号。非常方便查看同一类别的符号。
P:将当前信息保存到perf.hist.N中。
perf top常用选项有:
-e
:指明要分析的性能事件。 -p
:Profile events on existing Process ID (comma sperated list). 仅分析目标进程及其创建的线程。 -k
:Path to vmlinux. Required for annotation functionality. 带符号表的内核映像所在的路径。 -K:不显示属于内核或模块的符号。
-U:不显示属于用户态程序的符号。
-d
:界面的刷新周期,默认为2s,因为perf top默认每2s从mmap的内存区域读取一次性能数据。 -g:得到函数的调用关系图。
perf top --call-graph [fractal],路径概率为相对值,加起来为100%,调用顺序为从下往上。
perf top --call-graph graph,路径概率为绝对值,加起来为该函数的热度。

perf stat
perf stat用于运行指令,并分析其统计结果。虽然perf top也可以指定pid,但是必须先启动应用才能查看信息。
perf stat能完整统计应用整个生命周期的信息。
命令格式为:
perf stat [-e
| --event=EVENT] [-a]
perf stat [-e| --event=EVENT] [-a] — [ ]
下面简单看一下perf stat 的输出:
[root@master ~]# perf stat
Performance counter stats for 'system wide':40904.820871 cpu-clock (msec) # 5.000 CPUs utilized
18,132 context-switches # 0.443 K/sec
1,053 cpu-migrations # 0.026 K/sec
2,420 page-faults # 0.059 K/sec
3,958,376,712 cycles # 0.097 GHz (49.99%)
574,598,403 stalled-cycles-frontend # 14.52% frontend cycles idle (49.98%)
9,392,982,910 stalled-cycles-backend # 237.29% backend cycles idle (50.00%)
1,653,185,883 instructions # 0.42 insn per cycle
# 5.68 stalled cycles per insn (50.01%)
237,061,366 branches # 5.795 M/sec (50.02%)
18,333,168 branch-misses # 7.73% of all branches (50.00%) 8.181521203 seconds time elapsed
输出解释如下:
cpu-clock:任务真正占用的处理器时间,单位为ms。CPUs utilized = task-clock / time elapsed,CPU的占用率。
context-switches:程序在运行过程中上下文的切换次数。
CPU-migrations:程序在运行过程中发生的处理器迁移次数。Linux为了维持多个处理器的负载均衡,在特定条件下会将某个任务从一个CPU迁移到另一个CPU。
CPU迁移和上下文切换:发生上下文切换不一定会发生CPU迁移,而发生CPU迁移时肯定会发生上下文切换。发生上下文切换有可能只是把上下文从当前CPU中换出,下一次调度器还是将进程安排在这个CPU上执行。
page-faults:缺页异常的次数。当应用程序请求的页面尚未建立、请求的页面不在内存中,或者请求的页面虽然在内存中,但物理地址和虚拟地址的映射关系尚未建立时,都会触发一次缺页异常。另外TLB不命中,页面访问权限不匹配等情况也会触发缺页异常。
cycles:消耗的处理器周期数。如果把被ls使用的cpu cycles看成是一个处理器的,那么它的主频为2.486GHz。可以用cycles / task-clock算出。
stalled-cycles-frontend:指令读取或解码的质量步骤,未能按理想状态发挥并行左右,发生停滞的时钟周期。
stalled-cycles-backend:指令执行步骤,发生停滞的时钟周期。
instructions:执行了多少条指令。IPC为平均每个cpu cycle执行了多少条指令。
branches:遇到的分支指令数。branch-misses是预测错误的分支指令数。
其他常用参数
-a, --all-cpus 显示所有CPU上的统计信息
-C, --cpu显示指定CPU的统计信息
-c, --scale scale/normalize counters
-D, --delayms to wait before starting measurement after program start
-d, --detailed detailed run - start a lot of events
-e, --eventevent selector. use 'perf list' to list available events
-G, --cgroupmonitor event in cgroup name only
-g, --group put the counters into a counter group
-I, --interval-print
print counts at regular interval in ms (>= 10)
-i, --no-inherit child tasks do not inherit counters
-n, --null null run - dont start any counters
-o, --output输出统计信息到文件
-p, --pidstat events on existing process id
-r, --repeatrepeat command and print average + stddev (max: 100, forever: 0)
-S, --sync call sync() before starting a run
-t, --tidstat events on existing thread id
...
示例
前面统计程序的示例,下面看一下统计CPU信息的示例:
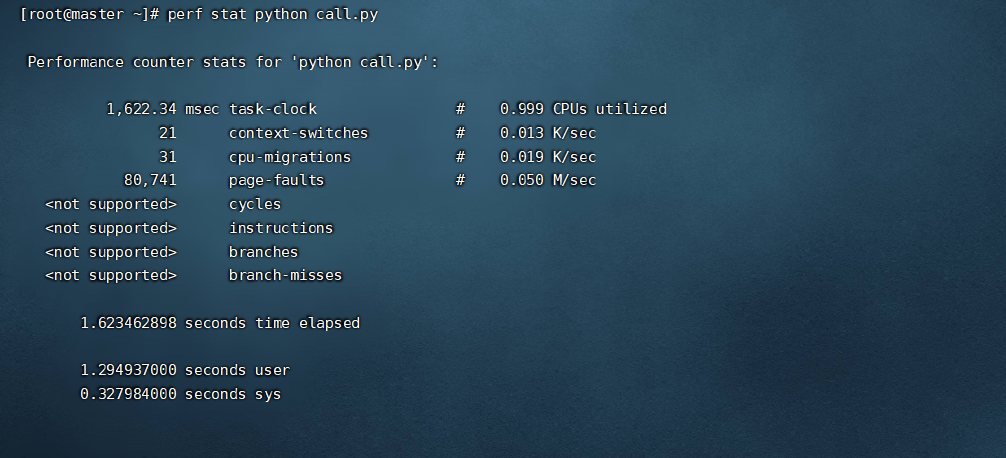
perf stat python call.py
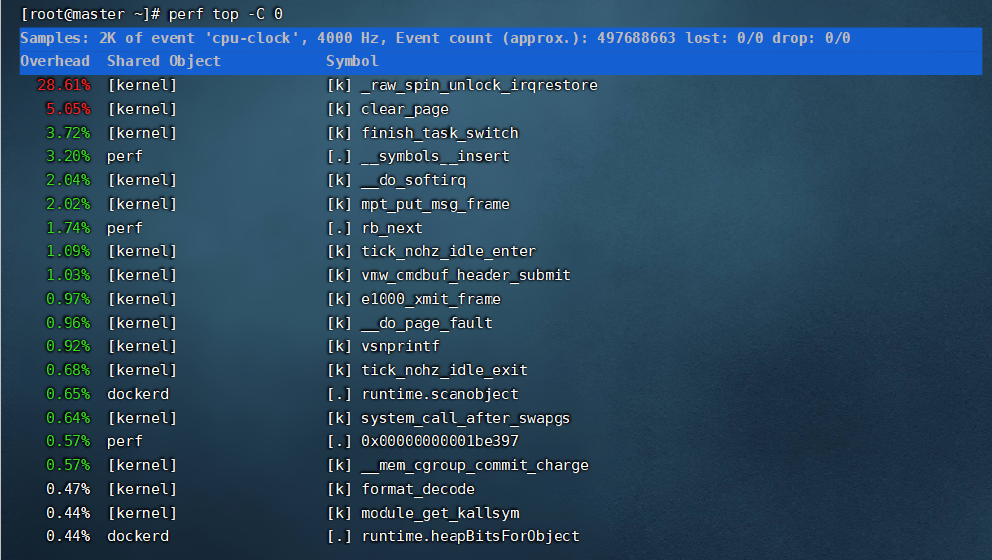
perf top -C 0
Flame Graph
1.抓取perf信息并转换
perf record -F 99 -a -g -- sleep 60
perf script > out.perf
./stackcollapse-perf.pl out.perf > out.folded
./flamegraph.pl out.kern_folded > kernel.svg
line_profiler使用
逐行分析python代码
# test.py
import line_profiler

@profile
def fib(n):
    # 文件名aaa.py
    a, b = 0, 1
    for i in range(0, n):
        a, b = b, a+b
    return a
fib(5)
D:\PythonProject\interview> kernprof -l -v test.py
Wrote profile results to test.py.lprof
Timer unit: 1e-06 s

Total time: 3.61e-05 s
File: test.py
Function: fib at line 253

Line #      Hits         Time  Per Hit   % Time  Line Contents
==============================================================
   253                                           @profile
   254                                           def fib(n):
   255                                               # 文件名aaa.py
   256         1         15.3     15.3     42.4      a, b = 0, 1
   257         6          4.0      0.7     11.1      for i in range(0, n):
   258         5         16.4      3.3     45.4          a, b = b, a+b
   259         1          0.4      0.4      1.1      return a
- Total Time:测试代码的总运行时间
- Line:代码行号
- Hits:表示每行代码运行的次数
- Time:每行代码运行的总时间
- Per Hits:每行代码运行一次的时间
- % Time:每行代码运行时间的百分比
- 从分析结果可以看出:第258行代码运行时间最长
参考资料
系统级性能分析工具 — Perf:http://blog.csdn.net/zhangskd/article/details/37902159/

 浙公网安备 33010602011771号