System.Windows.Forms.DataVisualization.Charting 完全指南
System.Windows.Forms.DataVisualization.Charting 完全指南
第 1 章:组件概述
1.1 什么是 Chart 控件
System.Windows.Forms.DataVisualization.Charting 是 .NET Framework 中功能强大的图表控件,提供丰富的图表类型和高度可定制性。
1.2 主要特性
- 支持 30+ 种图表类型
- 实时数据更新
- 丰富的样式定制
- 交互式功能
- 数据绑定支持
1.3 环境要求
- .NET Framework 4.0+
- Windows Forms 应用程序
- 引用 System.Windows.Forms.DataVisualization.dll
第 2 章:核心对象模型
2.1 Chart 控件结构
Chart (根对象)
├── ChartAreas (图表区域集合)
│   ├── ChartArea (单个图表区域)
│   │   ├── AxisX (X轴)
│   │   │   ├── MajorGrid (主网格线)
│   │   │   ├── MinorGrid (次网格线)
│   │   │   ├── LabelStyle (标签样式)
│   │   │   └── Title (轴标题)
│   │   ├── AxisY (Y轴)
│   │   │   ├── MajorGrid (主网格线)
│   │   │   ├── MinorGrid (次网格线)
│   │   │   ├── LabelStyle (标签样式)
│   │   │   └── Title (轴标题)
│   │   ├── AxisX2 (次X轴)
│   │   ├── AxisY2 (次Y轴)
│   │   └── CursorX/CursorY (光标)
├── Series (数据系列集合)
│   ├── Series (单个数据系列)
│   │   ├── Points (数据点集合)
│   │   │   └── DataPoint (单个数据点)
│   │   ├── TrendLines (趋势线集合)
│   │   ├── EmptyPointStyle (空点样式)
│   │   └── SmartLabelStyle (智能标签样式)
├── Legends (图例集合)
│   └── Legend (单个图例)
│       ├── CustomItems (自定义图例项)
│       └── CellColumns (单元格列)
├── Titles (标题集合)
│   └── Title (单个标题)
├── Annotations (标注集合)
│   ├── TextAnnotation (文本标注)
│   ├── LineAnnotation (线条标注)
│   ├── RectangleAnnotation (矩形标注)
│   ├── ArrowAnnotation (箭头标注)
│   └── ImageAnnotation (图像标注)
├── DataManipulator (数据操作器)
│   ├── Filter (数据过滤器)
│   ├── Group (数据分组)
│   └── Sort (数据排序)
└── Palettes (调色板集合)
2.2 主要对象说明
- ChartArea: 定义图表绘制区域
- Series: 数据系列,包含数据点和样式
- DataPoint: 单个数据点
- Axis: 坐标轴配置
- Legend: 图例显示
第 3 章:基础图表创建
3.1 基本设置步骤
- 添加 Chart 控件到窗体
- 配置 ChartArea
- 添加 Series
- 绑定数据
- 设置样式
3.2 代码示例:创建基础柱状图
// 初始化 Chart 控件
Chart chart1 = new Chart();
chart1.Size = new Size(600, 400);
chart1.Location = new Point(10, 10);

// 创建图表区域
ChartArea chartArea1 = new ChartArea("ChartArea1");
chartArea1.AxisX.Title = "月份";
chartArea1.AxisY.Title = "销售额";
chart1.ChartAreas.Add(chartArea1);

// 创建数据系列
Series series1 = new Series("销售数据");
series1.ChartType = SeriesChartType.Column;
series1.Points.AddXY("1月", 12000);
series1.Points.AddXY("2月", 15000);
series1.Points.AddXY("3月", 18000);
series1.Points.AddXY("4月", 22000);
series1.Points.AddXY("5月", 19000);
series1.Points.AddXY("6月", 25000);
chart1.Series.Add(series1);

// 添加图例
Legend legend1 = new Legend();
chart1.Legends.Add(legend1);

this.Controls.Add(chart1);
3.3 常用图表类型
-
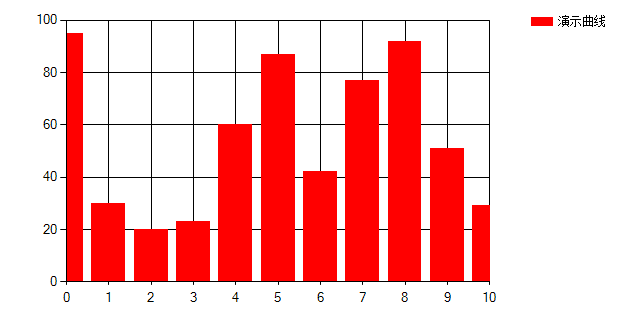
Column: 柱状图 - 用于比较不同类别的数据
-
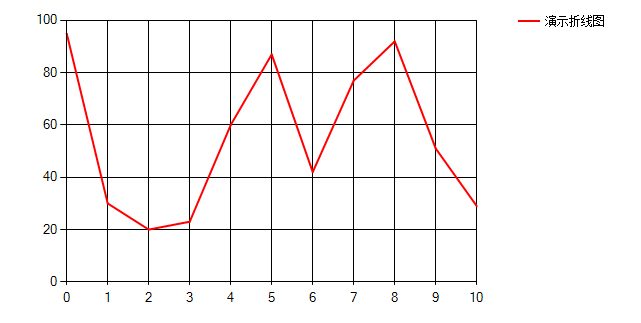
Line: 折线图 - 显示数据趋势变化
-
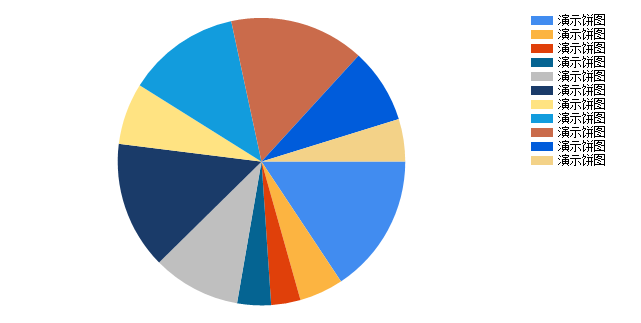
Pie: 饼图 - 显示各部分占比关系
-
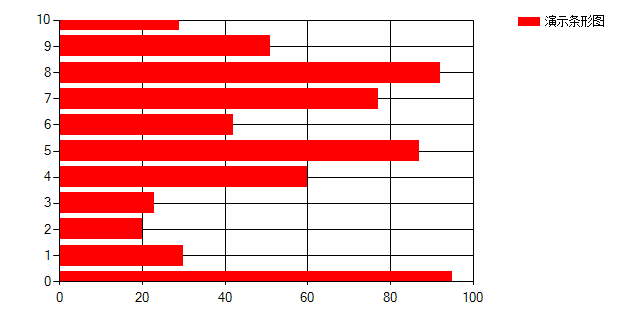
Bar: 条形图 - 水平显示的柱状图
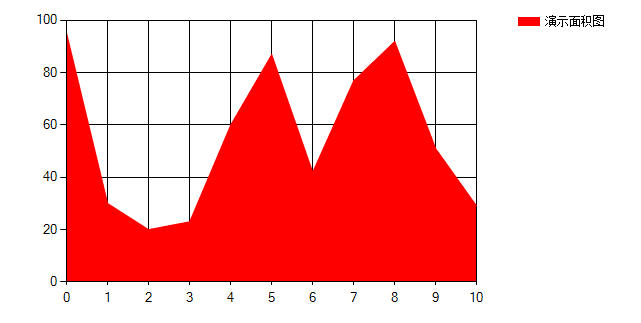
-
Area: 面积图 - 强调数量随时间变化的程度
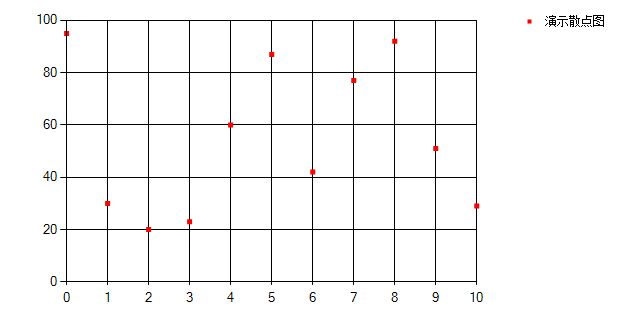
-
Point: 散点图 - 显示两个变量之间的关系
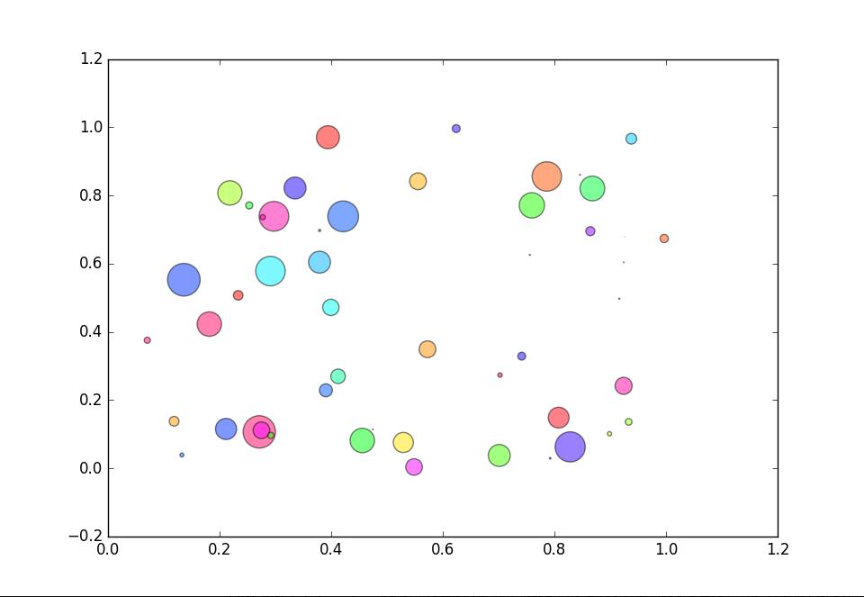
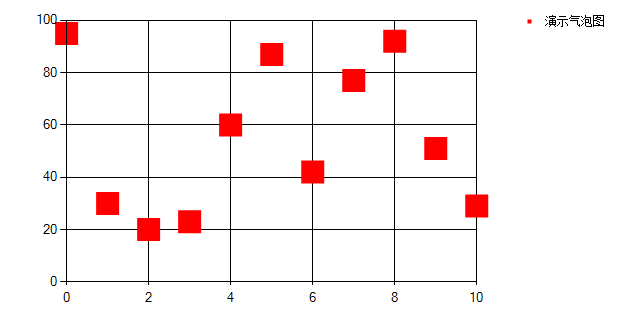
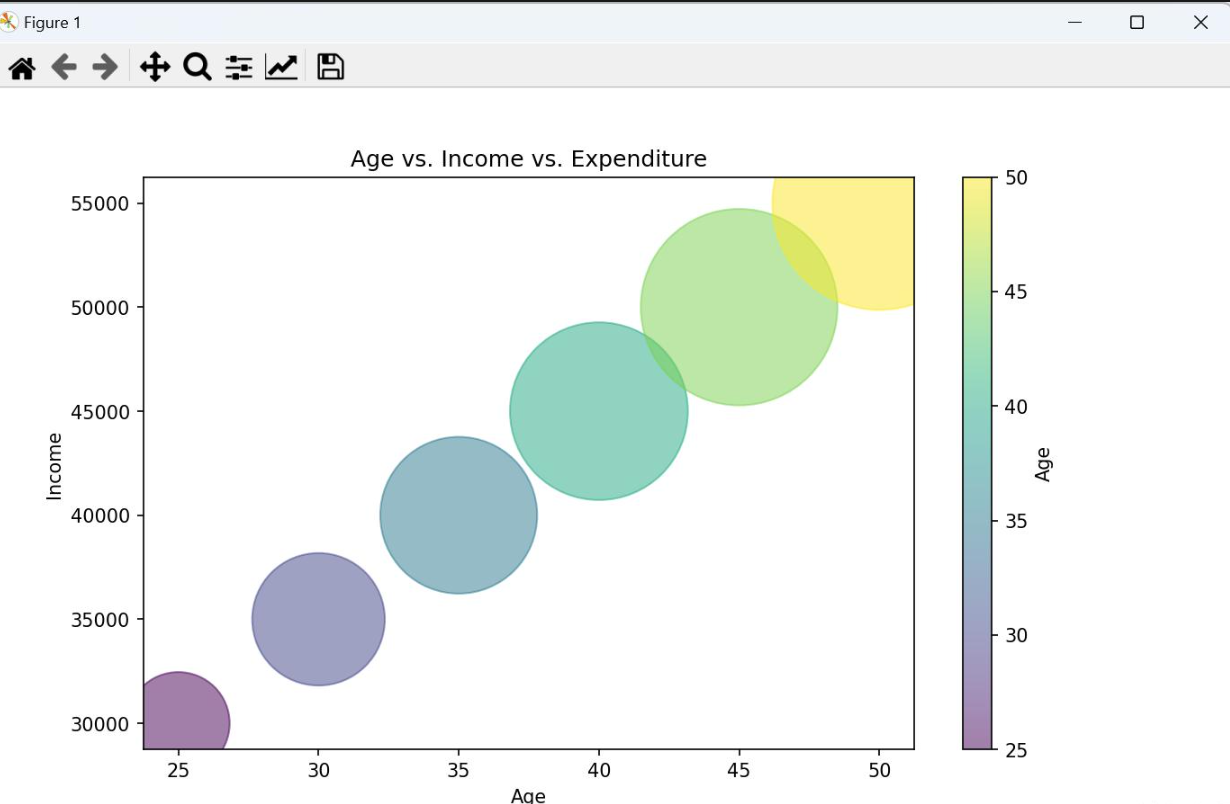
- Bubble: 气泡图 - 散点图的变体,气泡大小表示第三个变量
-
Candlestick: K线图 - 用于金融数据展示
-
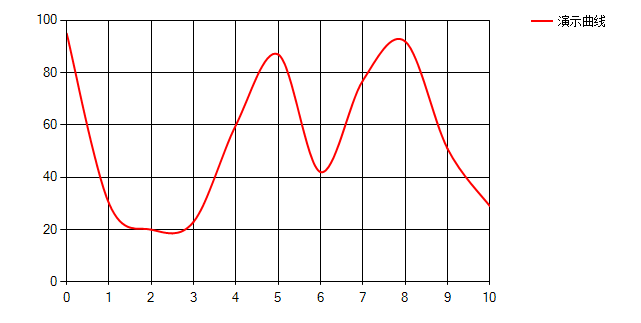
Spline: 平滑曲线图 - 使用曲线连接数据点
-
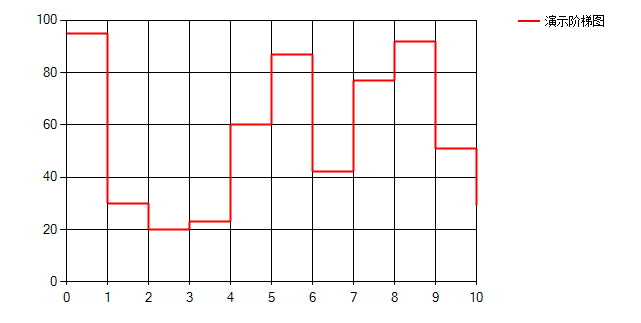
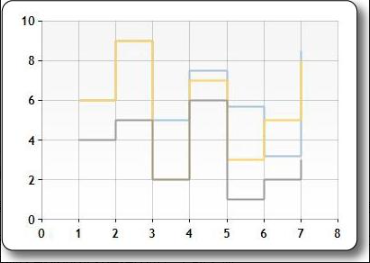
StepLine: 阶梯线图 - 使用水平线和垂直线连接数据点
-
Range: 范围图 - 显示数据范围(高低值)

-
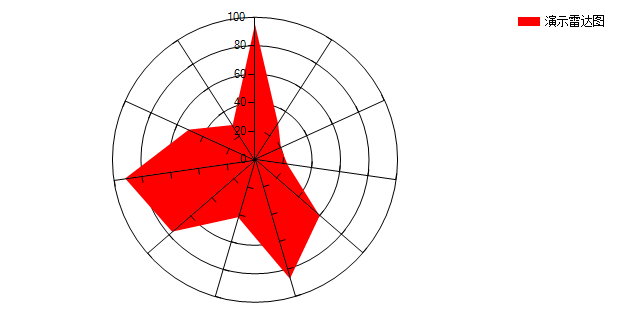
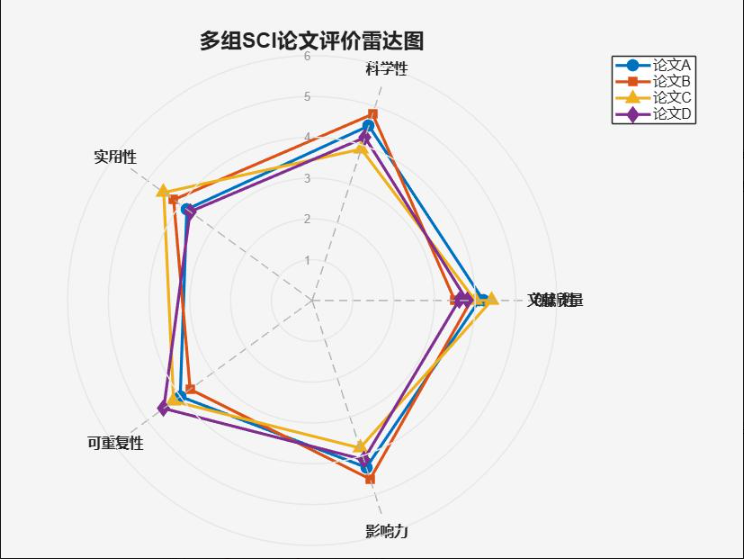
Radar: 雷达图 - 多变量比较
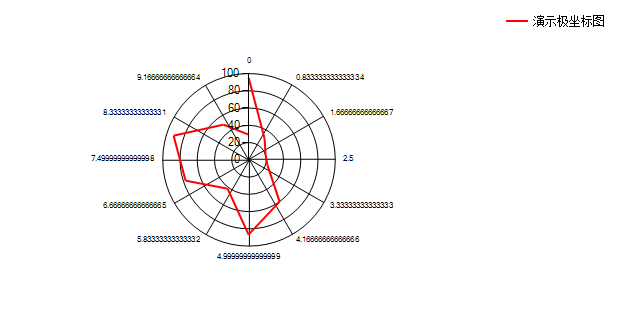
- Polar: 极坐标图 - 在极坐标系中显示数据
第 4 章:图表样式定制
4.1 颜色和外观定制
// 设置图表背景色和边框
chart1.BackColor = Color.White;
chart1.BorderlineColor = Color.Gray;
chart1.BorderlineWidth = 1;
chart1.BorderlineDashStyle = ChartDashStyle.Solid;

// 设置图表区域背景(渐变效果)
chart1.ChartAreas[0].BackColor = Color.LightBlue;
chart1.ChartAreas[0].BackGradientStyle = GradientStyle.DiagonalRight;
chart1.ChartAreas[0].BackSecondaryColor = Color.White;

// 启用3D效果
chart1.ChartAreas[0].Area3DStyle.Enable3D = true;
chart1.ChartAreas[0].Area3DStyle.Inclination = 30;
chart1.ChartAreas[0].Area3DStyle.Rotation = 10;
4.2 坐标轴详细配置
// X轴配置
chart1.ChartAreas[0].AxisX.Title = "时间";
chart1.ChartAreas[0].AxisX.TitleFont = new Font("Arial", 12, FontStyle.Bold);
chart1.ChartAreas[0].AxisX.Interval = 1;
chart1.ChartAreas[0].AxisX.LabelStyle.Format = "MM-dd";
chart1.ChartAreas[0].AxisX.MajorGrid.LineColor = Color.LightGray;

// Y轴配置(支持双Y轴)
chart1.ChartAreas[0].AxisY.Title = "数值";
chart1.ChartAreas[0].AxisY.Minimum = 0;
chart1.ChartAreas[0].AxisY.Maximum = 100;
chart1.ChartAreas[0].AxisY.Interval = 10;

// 次Y轴配置
chart1.ChartAreas[0].AxisY2.Enabled = AxisEnabled.True;
chart1.ChartAreas[0].AxisY2.Title = "百分比";
chart1.ChartAreas[0].AxisY2.Minimum = 0;
chart1.ChartAreas[0].AxisY2.Maximum = 1;
chart1.ChartAreas[0].AxisY2.LabelStyle.Format = "P0";

// 对数坐标轴
chart1.ChartAreas[0].AxisY.IsLogarithmic = true;
chart1.ChartAreas[0].AxisY.LogarithmBase = 10;
4.3 数据点样式高级配置
// 数据系列样式
series1.Color = Color.Red;
series1.BorderWidth = 2;
series1.BorderColor = Color.DarkRed;
series1.ShadowOffset = 2;

// 标记点样式
series1.MarkerStyle = MarkerStyle.Circle;
series1.MarkerSize = 8;
series1.MarkerColor = Color.White;
series1.MarkerBorderColor = Color.Red;
series1.MarkerBorderWidth = 2;

// 数据标签配置
series1.IsValueShownAsLabel = true;
series1.LabelFormat = "{0:F1}";
series1.LabelForeColor = Color.Black;
series1.LabelBackColor = Color.Yellow;
series1.LabelBorderColor = Color.Black;
series1.LabelBorderWidth = 1;

// 工具提示
series1.ToolTip = "数值: #VALY\
时间: #VALX";

// 自定义数据点颜色
foreach (DataPoint point in series1.Points)
{
    if (point.YValues[0] > 50)
        point.Color = Color.Green;
    else if (point.YValues[0] > 20)
        point.Color = Color.Yellow;
    else
        point.Color = Color.Red;
}
第 5 章:数据绑定与动态更新
5.1 多种数据绑定方式
5.1.1 DataSource 绑定(推荐)
// 创建数据模型
public class SalesData
{
    public string Month { get; set; }
    public decimal Amount { get; set; }
    public decimal Target { get; set; }
}

// 准备数据
List<SalesData> salesList = new List<SalesData>
{
    new SalesData { Month = "1月", Amount = 12000, Target = 10000 },
    new SalesData { Month = "2月", Amount = 15000, Target = 11000 },
    new SalesData { Month = "3月", Amount = 18000, Target = 12000 }
};

// 数据绑定
series1.Points.DataBind(salesList, "Month", "Amount", "");
series2.Points.DataBind(salesList, "Month", "Target", "");

// 或者使用 Chart.DataBindTable 方法
chart1.DataBindTable(salesList, "Month");
5.1.2 手动添加数据点
// 清空现有数据
series1.Points.Clear();

// 批量添加数据点
for (int i = 0; i < 100; i++)
{
    double value = Math.Sin(i * 0.1) * 50 + 50;
    series1.Points.AddXY(i, value);
}

// 使用 AddY 方法(自动生成X值)
series1.Points.AddY(100);
series1.Points.AddY(150);
series1.Points.AddY(200);
5.1.3 实时数据流更新
// 实时数据更新方法
private void UpdateRealTimeData(double newValue)
{
    // 限制数据点数量(性能优化)
    if (series1.Points.Count > 1000)
    {
        series1.Points.RemoveAt(0);
    }

    // 添加新数据点
    int xValue = series1.Points.Count > 0 ?
        (int)series1.Points[series1.Points.Count - 1].XValue + 1 : 0;

    series1.Points.AddXY(xValue, newValue);

    // 自动调整X轴范围(显示最近100个点)
    if (xValue > 100)
    {
        chart1.ChartAreas[0].AxisX.Minimum = xValue - 100;
        chart1.ChartAreas[0].AxisX.Maximum = xValue;
    }
}
5.2 性能优化策略
5.2.1 数据点数量控制
// 数据采样:当数据点过多时进行采样
private void AddDataWithSampling(double newValue)
{
    const int maxPoints = 500;

    if (series1.Points.Count >= maxPoints)
    {
        // 删除前10%的数据点
        int removeCount = maxPoints / 10;
        for (int i = 0; i < removeCount; i++)
        {
            series1.Points.RemoveAt(0);
        }
    }

    series1.Points.AddY(newValue);
}
5.2.2 异步更新(避免UI阻塞)
private async Task UpdateChartAsync(List<double> data)
{
    await Task.Run(() =>
    {
        // 在后台线程处理数据
        var processedData = ProcessData(data);

        // 切换到UI线程更新图表
        chart1.Invoke(new Action(() =>
        {
            series1.Points.DataBind(processedData, "X", "Y", "");
        }));
    });
}
5.2.3 启用图表优化
// 启用双缓冲减少闪烁
chart1.DoubleBuffered = true;

// 禁用不必要的功能提升性能
chart1.ChartAreas[0].AxisX.LabelStyle.Enabled = false;
chart1.ChartAreas[0].AxisY.LabelStyle.Enabled = false;

// 使用更简单的图表类型
series1.ChartType = SeriesChartType.FastLine;
5.3 数据库数据绑定示例
// 从数据库读取数据并绑定到图表
private void BindChartFromDatabase()
{
    string connectionString = "YourConnectionString";
    string query = "SELECT Month, SalesAmount FROM SalesData WHERE Year = 2024";

    using (SqlConnection connection = new SqlConnection(connectionString))
    {
        SqlCommand command = new SqlCommand(query, connection);
        connection.Open();

        SqlDataReader reader = command.ExecuteReader();
        while (reader.Read())
        {
            string month = reader["Month"].ToString();
            decimal amount = Convert.ToDecimal(reader["SalesAmount"]);
            series1.Points.AddXY(month, amount);
        }
    }
}
第 6 章:交互功能
6.1 鼠标交互功能实现
6.1.1 缩放和平移功能
// 启用缩放功能
chart1.ChartAreas[0].AxisX.ScaleView.Zoomable = true;
chart1.ChartAreas[0].AxisY.ScaleView.Zoomable = true;

// 启用鼠标滚轮缩放
chart1.ChartAreas[0].AxisX.ScaleView.Zoom(0, 100); // 初始显示范围
chart1.MouseWheel += (sender, e) =>
{
    try
    {
        if (e.Delta > 0) // 滚轮向上,放大
        {
            chart1.ChartAreas[0].AxisX.ScaleView.ZoomReset();
            chart1.ChartAreas[0].AxisY.ScaleView.ZoomReset();
        }
        else // 滚轮向下,缩小
        {
            double xMin = chart1.ChartAreas[0].AxisX.ScaleView.ViewMinimum;
            double xMax = chart1.ChartAreas[0].AxisX.ScaleView.ViewMaximum;
            double yMin = chart1.ChartAreas[0].AxisY.ScaleView.ViewMinimum;
            double yMax = chart1.ChartAreas[0].AxisY.ScaleView.ViewMaximum;

            double posXStart = chart1.ChartAreas[0].AxisX.PixelPositionToValue(e.X) - (xMax - xMin) / 4;
            double posXFinish = chart1.ChartAreas[0].AxisX.PixelPositionToValue(e.X) + (xMax - xMin) / 4;
            double posYStart = chart1.ChartAreas[0].AxisY.PixelPositionToValue(e.Y) - (yMax - yMin) / 4;
            double posYFinish = chart1.ChartAreas[0].AxisY.PixelPositionToValue(e.Y) + (yMax - yMin) / 4;

            chart1.ChartAreas[0].AxisX.ScaleView.Zoom(posXStart, posXFinish);
            chart1.ChartAreas[0].AxisY.ScaleView.Zoom(posYStart, posYFinish);
        }
    }
    catch { }
};
6.1.2 数据点选择和右键菜单
// 启用数据点选择
chart1.Legends[0].LegendStyle = LegendStyle.Table;
chart1.Series[0].IsValueShownAsLabel = true;

// 右键菜单配置
ContextMenuStrip contextMenu = new ContextMenuStrip();
contextMenu.Items.Add("放大", null, (s, e) => ZoomIn());
contextMenu.Items.Add("缩小", null, (s, e) => ZoomOut());
contextMenu.Items.Add("重置视图", null, (s, e) => ResetView());
contextMenu.Items.Add("-"); // 分隔线
contextMenu.Items.Add("导出图片", null, (s, e) => ExportChart());

chart1.ContextMenuStrip = contextMenu;

// 数据点点击事件
chart1.GetToolTipText += (sender, e) =>
{
    if (e.HitTestResult.ChartElementType == ChartElementType.DataPoint)
    {
        int pointIndex = e.HitTestResult.PointIndex;
        DataPoint point = series1.Points[pointIndex];
        e.Text = $"数值: {point.YValues[0]:F2}\
时间: {point.XValue}";
    }
};
6.2 键盘操作实现
// 启用键盘导航
chart1.KeyDown += (sender, e) =>
{
    switch (e.KeyCode)
    {
        case Keys.Left:
            PanChart(-10, 0); // 向左平移
            break;
        case Keys.Right:
            PanChart(10, 0); // 向右平移
            break;
        case Keys.Up:
            PanChart(0, 10); // 向上平移
            break;
        case Keys.Down:
            PanChart(0, -10); // 向下平移
            break;
        case Keys.Add:
            ZoomIn(); // 放大
            break;
        case Keys.Subtract:
            ZoomOut(); // 缩小
            break;
        case Keys.Home:
            ResetView(); // 重置视图
            break;
    }
};

private void PanChart(double xOffset, double yOffset)
{
    double xMin = chart1.ChartAreas[0].AxisX.ScaleView.ViewMinimum;
    double xMax = chart1.ChartAreas[0].AxisX.ScaleView.ViewMaximum;
    double yMin = chart1.ChartAreas[0].AxisY.ScaleView.ViewMinimum;
    double yMax = chart1.ChartAreas[0].AxisY.ScaleView.ViewMaximum;

    chart1.ChartAreas[0].AxisX.ScaleView.Zoom(xMin + xOffset, xMax + xOffset);
    chart1.ChartAreas[0].AxisY.ScaleView.Zoom(yMin + yOffset, yMax + yOffset);
}
6.3 完整的事件处理系统
// 鼠标点击事件
chart1.MouseDown += (sender, e) =>
{
    if (e.Button == MouseButtons.Left)
    {
        HitTestResult result = chart1.HitTest(e.X, e.Y);

        if (result.ChartElementType == ChartElementType.DataPoint)
        {
            // 高亮选中的数据点
            foreach (DataPoint point in series1.Points)
            {
                point.Color = Color.Blue; // 重置颜色
            }
            result.Object.Color = Color.Red; // 选中点变红

            // 显示详细信息
            MessageBox.Show($"选中数据点: X={result.Object.XValue}, Y={result.Object.YValues[0]}");
        }
    }
};

// 鼠标移动事件(悬停效果)
chart1.MouseMove += (sender, e) =>
{
    HitTestResult result = chart1.HitTest(e.X, e.Y);

    if (result.ChartElementType == ChartElementType.DataPoint)
    {
        chart1.Cursor = Cursors.Hand;
    }
    else
    {
        chart1.Cursor = Cursors.Default;
    }
};

// 选择变化事件
chart1.SelectionRangeChanged += (sender, e) =>
{
    if (e.NewSelectionStart >= 0 && e.NewSelectionEnd >= 0)
    {
        // 处理选择范围变化
        double start = e.NewSelectionStart;
        double end = e.NewSelectionEnd;

        // 可以在这里添加选择范围的处理逻辑
    }
};
6.4 自定义标注交互
// 添加可拖动的标注
private void AddDraggableAnnotation()
{
    RectangleAnnotation annotation = new RectangleAnnotation();
    annotation.AxisX = chart1.ChartAreas[0].AxisX;
    annotation.AxisY = chart1.ChartAreas[0].AxisY;
    annotation.X = 50;
    annotation.Y = 50;
    annotation.Width = 20;
    annotation.Height = 20;
    annotation.BackColor = Color.Yellow;
    annotation.AllowMoving = true; // 允许拖动
    annotation.AllowSelecting = true; // 允许选择

    chart1.Annotations.Add(annotation);

    // 标注拖动事件
    annotation.AnnotationPositionChanged += (s, e) =>
    {
        // 标注位置改变时的处理
        Console.WriteLine($"标注移动到: X={annotation.X}, Y={annotation.Y}");
    };
}
第 7 章:高级功能
7.1 统计分析功能
7.1.1 趋势线分析
// 添加线性趋势线
series1.TrendLines.Clear();
TrendLine trendLine = new TrendLine();
trendLine.LineColor = Color.Red;
trendLine.LineWidth = 2;
trendLine.Name = "线性趋势";
trendLine.ToolTip = "线性趋势线";
trendLine.Forecast = false;
series1.TrendLines.Add(trendLine);

// 添加多项式趋势线
TrendLine polyTrend = new TrendLine();
polyTrend.PolynomialDegree = 3; // 三次多项式
polyTrend.LineColor = Color.Blue;
polyTrend.LineWidth = 2;
polyTrend.Name = "多项式趋势";
series1.TrendLines.Add(polyTrend);

// 添加移动平均线
TrendLine movingAvg = new TrendLine();
movingAvg.Name = "移动平均";
movingAvg.ToolTip = "5期移动平均";
movingAvg.Period = 5; // 5期移动平均
movingAvg.LineColor = Color.Green;
movingAvg.LineWidth = 2;
series1.TrendLines.Add(movingAvg);
7.1.2 误差线配置
// 添加误差线
series1.ErrorBarType = ErrorBarType.StandardError;
series1.ErrorBarCenterMarkerStyle = MarkerStyle.Circle;
series1.ErrorBarSeries = "ErrorSeries"; // 关联误差数据系列
series1.ErrorBarLineWidth = 1;
series1.ErrorBarLineColor = Color.Black;

// 创建误差数据系列
Series errorSeries = new Series("ErrorSeries");
errorSeries.ChartType = SeriesChartType.ErrorBar;
errorSeries.Points.AddXY(1, 100, 90, 110); // X, Y, 下限, 上限
errorSeries.Points.AddXY(2, 150, 140, 160);
chart1.Series.Add(errorSeries);
7.2 金融图表实现
7.2.1 K线图(蜡烛图)
// 创建K线图系列
Series candlestickSeries = new Series("K线图");
candlestickSeries.ChartType = SeriesChartType.Candlestick;
candlestickSeries.YValuesPerPoint = 4; // 需要4个值:高、低、开、收

// 添加K线数据(X, 高, 低, 开, 收)
candlestickSeries.Points.AddXY("2024-01", 105, 95, 100, 102);
candlestickSeries.Points.AddXY("2024-02", 110, 98, 102, 108);
candlestickSeries.Points.AddXY("2024-03", 115, 105, 108, 112);

// 设置K线颜色(涨为红,跌为绿)
candlestickSeries.CustomProperties = "PriceDownColor=Green,PriceUpColor=Red";
candlestickSeries["ShowOpenClose"] = "Both"; // 显示开盘收盘线

chart1.Series.Add(candlestickSeries);
7.2.2 成交量图(配合K线图)
// 创建成交量系列(使用次Y轴)
Series volumeSeries = new Series("成交量");
volumeSeries.ChartType = SeriesChartType.Column;
volumeSeries.YAxisType = AxisType.Secondary; // 使用次Y轴

// 添加成交量数据
volumeSeries.Points.AddXY("2024-01", 1000000);
volumeSeries.Points.AddXY("2024-02", 1500000);
volumeSeries.Points.AddXY("2024-03", 1200000);

// 配置次Y轴
chart1.ChartAreas[0].AxisY2.Enabled = AxisEnabled.True;
chart1.ChartAreas[0].AxisY2.Title = "成交量";
chart1.ChartAreas[0].AxisY2.LabelStyle.Format = "#,##0";

chart1.Series.Add(volumeSeries);
7.2.3 技术指标计算
// 计算移动平均线(MA)
private Series CalculateMovingAverage(Series sourceSeries, int period, string name)
{
    Series maSeries = new Series(name);
    maSeries.ChartType = SeriesChartType.Line;
    maSeries.Color = Color.Blue;
    maSeries.BorderWidth = 2;

    for (int i = period - 1; i < sourceSeries.Points.Count; i++)
    {
        double sum = 0;
        for (int j = i - period + 1; j <= i; j++)
        {
            sum += sourceSeries.Points[j].YValues[0];
        }
        double ma = sum / period;
        maSeries.Points.AddXY(sourceSeries.Points[i].XValue, ma);
    }

    return maSeries;
}

// 计算相对强弱指数(RSI)
private Series CalculateRSI(Series sourceSeries, int period, string name)
{
    Series rsiSeries = new Series(name);
    rsiSeries.ChartType = SeriesChartType.Line;
    rsiSeries.Color = Color.Purple;

    // RSI计算逻辑
    // ... 实现RSI算法

    return rsiSeries;
}
7.3 自定义绘制功能
7.3.1 自定义标注
// 添加文本标注
TextAnnotation textAnnotation = new TextAnnotation();
textAnnotation.Text = "重要数据点";
textAnnotation.X = 50;
textAnnotation.Y = 75;
textAnnotation.ForeColor = Color.Red;
textAnnotation.Font = new Font("Arial", 10, FontStyle.Bold);
textAnnotation.Visible = true;
chart1.Annotations.Add(textAnnotation);

// 添加箭头标注
ArrowAnnotation arrowAnnotation = new ArrowAnnotation();
arrowAnnotation.AnchorDataPoint = series1.Points[2];
arrowAnnotation.Width = 5;
arrowAnnotation.Height = 10;
arrowAnnotation.LineColor = Color.Blue;
arrowAnnotation.ArrowStyle = ArrowStyle.Simple;
chart1.Annotations.Add(arrowAnnotation);

// 添加图像标注
ImageAnnotation imageAnnotation = new ImageAnnotation();
imageAnnotation.Image = Image.FromFile("warning.png");
imageAnnotation.X = 30;
imageAnnotation.Y = 80;
imageAnnotation.Width = 20;
imageAnnotation.Height = 20;
chart1.Annotations.Add(imageAnnotation);
7.3.2 自定义图例
// 创建自定义图例项
LegendItem legendItem = new LegendItem();
legendItem.Name = "自定义图例";
legendItem.Color = Color.Gold;
legendItem.ImageStyle = LegendImageStyle.Rectangle;
legendItem.BorderColor = Color.Black;
legendItem.BorderWidth = 1;
legendItem.MarkerStyle = MarkerStyle.Star5;
legendItem.MarkerSize = 15;

// 添加到图例
chart1.Legends[0].CustomItems.Add(legendItem);

// 自定义图例文本
chart1.Legends[0].LegendStyle = LegendStyle.Table;
chart1.Legends[0].TableStyle = LegendTableStyle.Auto;
chart1.Legends[0].Docking = Docking.Bottom;
7.3.3 自定义绘制事件
// 自定义绘制数据点
chart1.Customize += (sender, e) =>
{
    // 在绘制前进行自定义处理
};

chart1.PostPaint += (sender, e) =>
{
    // 在绘制完成后添加自定义图形
    if (e.ChartElement is ChartArea)
    {
        Graphics graphics = e.ChartGraphics.Graphics;

        // 绘制自定义网格线
        Pen customPen = new Pen(Color.LightGray, 1);
        customPen.DashStyle = System.Drawing.Drawing2D.DashStyle.Dot;

        // 在图表区域绘制自定义内容
        RectangleF chartAreaRect = e.ChartGraphics.GetAbsoluteRectangle(
            e.ChartElement.GetType().GetProperty("Position")?.GetValue(e.ChartElement) as ElementPosition
        );

        // 绘制对角线
        graphics.DrawLine(customPen,
            chartAreaRect.Left, chartAreaRect.Top,
            chartAreaRect.Right, chartAreaRect.Bottom);
    }
};
第 8 章:实战案例
8.1 实时串口波形监控(结合 SerialPort)
8.1.1 完整实现代码
public partial class SerialWaveMonitor : Form
{
    private SerialPort serialPort;
    private Chart waveChart;
    private Series[] channelSeries;
    private const int MAX_POINTS = 1000;
    private double[] alarmThresholds = new double[4] { 3.0, 3.0, 3.0, 3.0 };

    public SerialWaveMonitor()
    {
        InitializeComponent();
        InitializeChart();
        InitializeSerialPort();
    }

    private void InitializeChart()
    {
        waveChart = new Chart();
        waveChart.Dock = DockStyle.Fill;

        // 创建图表区域
        ChartArea chartArea = new ChartArea("WaveArea");
        chartArea.AxisX.Title = "时间 (s)";
        chartArea.AxisY.Title = "电压 (V)";
        chartArea.AxisX.Minimum = 0;
        chartArea.AxisX.Maximum = 10;
        chartArea.AxisY.Minimum = -5;
        chartArea.AxisY.Maximum = 5;
        chartArea.CursorX.IsUserEnabled = true;
        chartArea.CursorX.IsUserSelectionEnabled = true;

        waveChart.ChartAreas.Add(chartArea);

        // 创建4个通道的数据系列
        channelSeries = new Series[4];
        Color[] channelColors = { Color.Red, Color.Blue, Color.Green, Color.Orange };

        for (int i = 0; i < 4; i++)
        {
            channelSeries[i] = new Series($"通道{i+1}");
            channelSeries[i].ChartType = SeriesChartType.FastLine;
            channelSeries[i].Color = channelColors[i];
            channelSeries[i].BorderWidth = 2;
            channelSeries[i].LegendText = $"通道{i+1}";
            waveChart.Series.Add(channelSeries[i]);
        }

        // 添加图例
        Legend legend = new Legend();
        legend.Docking = Docking.Top;
        waveChart.Legends.Add(legend);

        this.Controls.Add(waveChart);
    }

    private void InitializeSerialPort()
    {
        serialPort = new SerialPort("COM3", 9600, Parity.None, 8, StopBits.One);
        serialPort.DataReceived += SerialPort_DataReceived;
    }

    private void SerialPort_DataReceived(object sender, SerialDataReceivedEventArgs e)
    {
        try
        {
            string data = serialPort.ReadLine();
            ProcessSerialData(data);
        }
        catch (Exception ex)
        {
            // 错误处理
        }
    }

    private void ProcessSerialData(string data)
    {
        // 解析串口数据格式:CH1:1.23,CH2:2.34,CH3:0.56,CH4:3.21
        string[] channels = data.Split(',');
        double[] values = new double[4];

        for (int i = 0; i < Math.Min(4, channels.Length); i++)
        {
            if (channels[i].Contains(":"))
            {
                string[] parts = channels[i].Split(':');
                if (parts.Length == 2 && double.TryParse(parts[1], out double value))
                {
                    values[i] = value;

                    // 检查报警阈值
                    if (Math.Abs(value) > alarmThresholds[i])
                    {
                        TriggerAlarm(i, value);
                    }
                }
            }
        }

        // 更新图表(确保在UI线程执行)
        if (waveChart.InvokeRequired)
        {
            waveChart.Invoke(new Action<double[]>(UpdateWaveChart), values);
        }
        else
        {
            UpdateWaveChart(values);
        }
    }

    private void UpdateWaveChart(double[] values)
    {
        double currentTime = DateTime.Now.TimeOfDay.TotalSeconds;

        for (int i = 0; i < values.Length; i++)
        {
            // 限制数据点数量
            if (channelSeries[i].Points.Count > MAX_POINTS)
            {
                channelSeries[i].Points.RemoveAt(0);
            }

            // 添加新数据点
            channelSeries[i].Points.AddXY(currentTime, values[i]);

            // 自动调整X轴范围(显示最近10秒数据)
            if (currentTime > waveChart.ChartAreas[0].AxisX.Maximum)
            {
                waveChart.ChartAreas[0].AxisX.Minimum = currentTime - 10;
                waveChart.ChartAreas[0].AxisX.Maximum = currentTime;
            }
        }

        waveChart.Invalidate(); // 强制重绘
    }

    private void TriggerAlarm(int channel, double value)
    {
        // 报警处理逻辑
        Console.WriteLine($"通道{channel+1}报警!当前值: {value}, 阈值: {alarmThresholds[channel]}");

        // 可以添加声音报警、闪烁提示等
    }

    public void StartMonitoring()
    {
        if (!serialPort.IsOpen)
        {
            serialPort.Open();
        }
    }

    public void StopMonitoring()
    {
        if (serialPort.IsOpen)
        {
            serialPort.Close();
        }
    }
}
8.2 销售数据报表(柱状图 + 折线图组合)
8.2.1 完整实现代码
public class SalesReportChart
{
    private Chart salesChart;

    public SalesReportChart()
    {
        InitializeChart();
    }

    private void InitializeChart()
    {
        salesChart = new Chart();
        salesChart.Size = new Size(800, 500);

        // 配置图表区域
        ChartArea chartArea = new ChartArea("SalesArea");
        chartArea.AxisX.Title = "月份";
        chartArea.AxisY.Title = "销售额 (万元)";
        chartArea.AxisY2.Title = "增长率 (%)";
        chartArea.AxisY2.Enabled = AxisEnabled.True;

        // 配置次Y轴
        chartArea.AxisY2.MajorGrid.Enabled = false;
        chartArea.AxisY2.LabelStyle.Format = "P0";
        chartArea.AxisY2.Minimum = -0.5;
        chartArea.AxisY2.Maximum = 1.5;

        salesChart.ChartAreas.Add(chartArea);

        // 创建销售数据系列(柱状图)
        Series salesSeries = new Series("销售额");
        salesSeries.ChartType = SeriesChartType.Column;
        salesSeries.Color = Color.SteelBlue;
        salesSeries.YAxisType = AxisType.Primary;
        salesSeries.IsValueShownAsLabel = true;
        salesSeries.LabelFormat = "{0:F0}";
        salesSeries["DrawingStyle"] = "Cylinder"; // 圆柱效果

        // 创建增长率系列(折线图,使用次Y轴)
        Series growthSeries = new Series("增长率");
        growthSeries.ChartType = SeriesChartType.Line;
        growthSeries.Color = Color.Red;
        growthSeries.YAxisType = AxisType.Secondary;
        growthSeries.BorderWidth = 3;
        growthSeries.MarkerStyle = MarkerStyle.Circle;
        growthSeries.MarkerSize = 8;
        growthSeries.MarkerColor = Color.White;
        growthSeries.MarkerBorderColor = Color.Red;
        growthSeries.MarkerBorderWidth = 2;
        growthSeries.IsValueShownAsLabel = true;
        growthSeries.LabelFormat = "{0:P0}";

        salesChart.Series.Add(salesSeries);
        salesChart.Series.Add(growthSeries);

        // 添加图例
        Legend legend = new Legend();
        legend.Docking = Docking.Bottom;
        salesChart.Legends.Add(legend);

        // 添加标题
        Title title = new Title("2024年销售数据报表");
        title.Font = new Font("微软雅黑", 14, FontStyle.Bold);
        salesChart.Titles.Add(title);
    }

    public void LoadSalesData(List<SalesData> data)
    {
        salesChart.Series["销售额"].Points.Clear();
        salesChart.Series["增长率"].Points.Clear();

        foreach (var item in data)
        {
            salesChart.Series["销售额"].Points.AddXY(item.Month, item.Amount / 10000); // 转换为万元
            salesChart.Series["增长率"].Points.AddXY(item.Month, item.GrowthRate);
        }
    }

    // 数据模型
    public class SalesData
    {
        public string Month { get; set; }
        public decimal Amount { get; set; }
        public double GrowthRate { get; set; }
    }

    public Chart GetChart()
    {
        return salesChart;
    }
}

// 使用示例
public void CreateSalesReport()
{
    SalesReportChart report = new SalesReportChart();

    List<SalesReportChart.SalesData> data = new List<SalesReportChart.SalesData>
    {
        new SalesReportChart.SalesData { Month = "1月", Amount = 1200000, GrowthRate = 0.0 },
        new SalesReportChart.SalesData { Month = "2月", Amount = 1500000, GrowthRate = 0.25 },
        new SalesReportChart.SalesData { Month = "3月", Amount = 1800000, GrowthRate = 0.20 },
        new SalesReportChart.SalesData { Month = "4月", Amount = 2200000, GrowthRate = 0.22 },
        new SalesReportChart.SalesData { Month = "5月", Amount = 1900000, GrowthRate = -0.14 },
        new SalesReportChart.SalesData { Month = "6月", Amount = 2500000, GrowthRate = 0.32 }
    };

    report.LoadSalesData(data);

    // 将图表添加到窗体
    this.Controls.Add(report.GetChart());
}
8.3 设备状态监控仪表盘(Gauge 图表)
8.3.1 完整实现代码
public class GaugeDashboard
{
    private Chart gaugeChart;
    private Series[] gaugeSeries;
    private const int GAUGE_COUNT = 4;

    public GaugeDashboard()
    {
        InitializeGaugeChart();
    }

    private void InitializeGaugeChart()
    {
        gaugeChart = new Chart();
        gaugeChart.Size = new Size(600, 400);

        // 创建2x2的仪表盘布局
        for (int i = 0; i < GAUGE_COUNT; i++)
        {
            ChartArea gaugeArea = new ChartArea($"GaugeArea{i}");
            gaugeArea.Position = new ElementPosition(
                (i % 2) * 50,      // X位置
                (i / 2) * 50,      // Y位置
                45,                // 宽度
                45                 // 高度
            );

            // 配置为雷达图模拟仪表盘
            gaugeArea.Area3DStyle.Enable3D = true;
            gaugeArea.BackColor = Color.LightGray;

            gaugeChart.ChartAreas.Add(gaugeArea);
        }

        // 创建仪表盘系列
        gaugeSeries = new Series[GAUGE_COUNT];
        string[] gaugeNames = { "CPU使用率", "内存使用", "磁盘IO", "网络流量" };
        Color[] gaugeColors = { Color.Red, Color.Blue, Color.Green, Color.Orange };

        for (int i = 0; i < GAUGE_COUNT; i++)
        {
            gaugeSeries[i] = new Series(gaugeNames[i]);
            gaugeSeries[i].ChartType = SeriesChartType.Radar;
            gaugeSeries[i].ChartArea = $"GaugeArea{i}";
            gaugeSeries[i].Color = gaugeColors[i];
            gaugeSeries[i].BorderWidth = 3;

            // 添加仪表盘刻度数据点
            gaugeSeries[i].Points.AddY(0);   // 最小值
            gaugeSeries[i].Points.AddY(25);  // 25%
            gaugeSeries[i].Points.AddY(50);  // 50%
            gaugeSeries[i].Points.AddY(75);  // 75%
            gaugeSeries[i].Points.AddY(100); // 最大值

            gaugeChart.Series.Add(gaugeSeries[i]);
        }

        // 添加指针系列(使用第二个数据点作为指针)
        for (int i = 0; i < GAUGE_COUNT; i++)
        {
            Series pointerSeries = new Series($"{gaugeNames[i]}指针");
            pointerSeries.ChartType = SeriesChartType.Line;
            pointerSeries.ChartArea = $"GaugeArea{i}";
            pointerSeries.Color = Color.Black;
            pointerSeries.BorderWidth = 2;
            pointerSeries.Points.AddY(0); // 指针起始点
            pointerSeries.Points.AddY(50); // 指针当前位置(初始50%)

            gaugeChart.Series.Add(pointerSeries);
        }
    }

    public void UpdateGaugeValue(int gaugeIndex, double value)
    {
        if (gaugeIndex >= 0 && gaugeIndex < GAUGE_COUNT)
        {
            // 更新指针位置
            Series pointerSeries = gaugeChart.Series[$"{gaugeSeries[gaugeIndex].Name}指针"];
            pointerSeries.Points[1].YValues[0] = Math.Max(0, Math.Min(100, value));

            // 根据数值改变颜色
            if (value > 80)
                gaugeSeries[gaugeIndex].Color = Color.Red;
            else if (value > 60)
                gaugeSeries[gaugeIndex].Color = Color.Orange;
            else
                gaugeSeries[gaugeIndex].Color = Color.Green;

            gaugeChart.Invalidate();
        }
    }

    public Chart GetChart()
    {
        return gaugeChart;
    }
}

// 使用示例:模拟实时监控
public class DeviceMonitor : Form
{
    private GaugeDashboard dashboard;
    private Timer updateTimer;

    public DeviceMonitor()
    {
        dashboard = new GaugeDashboard();
        this.Controls.Add(dashboard.GetChart());

        // 启动定时器模拟数据更新
        updateTimer = new Timer();
        updateTimer.Interval = 1000; // 1秒更新一次
        updateTimer.Tick += UpdateTimer_Tick;
        updateTimer.Start();
    }

    private void UpdateTimer_Tick(object sender, EventArgs e)
    {
        Random rand = new Random();

        // 模拟4个仪表盘的实时数据
        for (int i = 0; i < 4; i++)
        {
            double value = rand.NextDouble() * 100;
            dashboard.UpdateGaugeValue(i, value);
        }
    }
}
第 9 章:常见问题与解决方案
9.1 性能优化问题
问题:图表卡顿
- 解决方案1: 减少数据点数量,使用数据采样
- 解决方案2: 优化刷新频率,使用双缓冲
- 解决方案3: 启用图表虚拟化
代码示例:
chart1.Series[0].Points.DataBind(data.Take(1000)); // 限制数据点数量
chart1.ChartAreas[0].AxisX.Interval = 10; // 设置坐标轴间隔
9.2 线程安全问题
问题:跨线程更新图表
- 解决方案: 使用 Control.Invoke 方法
代码示例:
private void UpdateChartFromThread()
{
    if (chart1.InvokeRequired)
    {
        chart1.Invoke(new Action(UpdateChartFromThread));
        return;
    }
    // 更新图表代码
}
9.3 样式配置问题
问题:样式不生效
- 检查点1: ChartArea 与 Series 的关联关系
- 检查点2: 坐标轴范围设置
- 检查点3: 数据点索引正确性
9.4 数据绑定问题
问题:数据绑定失败
- 解决方案1: 检查数据源类型
- 解决方案2: 验证数据格式
- 解决方案3: 使用 DataBind 方法
第 10 章:最佳实践与性能优化
10.1 内存管理
- 及时清理不需要的数据点
- 使用数据绑定而非手动添加
- 避免频繁的图表重绘
10.2 用户体验
- 合理的图表缩放比例
- 清晰的图例说明
- 响应式布局设计
10.3 代码组织
- 模块化的图表配置
- 可重用的图表模板
- 统一的样式管理
附录:常用属性速查表
图表类型 (ChartType)
- Column, Line, Pie, Bar, Area, Point, Bubble
- Spline, StepLine, Range, RangeColumn
- Stock, Candlestick, Radar, Polar
坐标轴属性
- Interval: 刻度间隔
- Minimum/Maximum: 范围设置
- LabelStyle.Format: 标签格式
- MajorGrid: 主网格线
数据系列属性
- Color: 系列颜色
- BorderWidth: 边框宽度
- MarkerStyle: 标记点样式
- ChartType: 图表类型
本指南涵盖了 System.Windows.Forms.DataVisualization.Charting 控件的所有核心功能和实践技巧,可作为开发参考手册使用。

 浙公网安备 33010602011771号