
ELK(1) ELK的安装及使用收集日志
一.elasticsearch的安装和使用
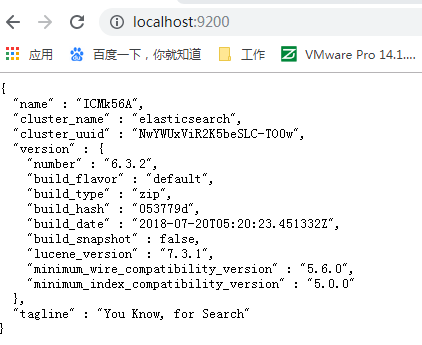
1.去官网下载之前的版本elasticsearch-6.3.2.zip,解压然后执行 bin/elasticsearch.bat启动
http://localhost:9200/ 打开url就是运行成功了
2.使用postman来数据操作
http://localhost:9200/<index>/<type>/[<id>]
index: 索引类似mysql的数据库,type: 类似mysql的表同类数据, id: 类似行
http://localhost:9200/_all GET 查询所有索引
http://localhost:9200/person PUT 创建索引
http://localhost:9200/person DELETE 删除索引
http://localhost:9200/person/_doc/3 PUT 新增数据

http://localhost:9200/person/_doc/1 GET 获取数据
http://localhost:9200/person/_doc/_search?q=first_name:Kate GET 查询数据
二.kibana安装和使用
1.官网https://www.elastic.co/cn/downloads下载kibana-6.3.2-windows-x86_64.zip
版本要匹配都是6.3.2
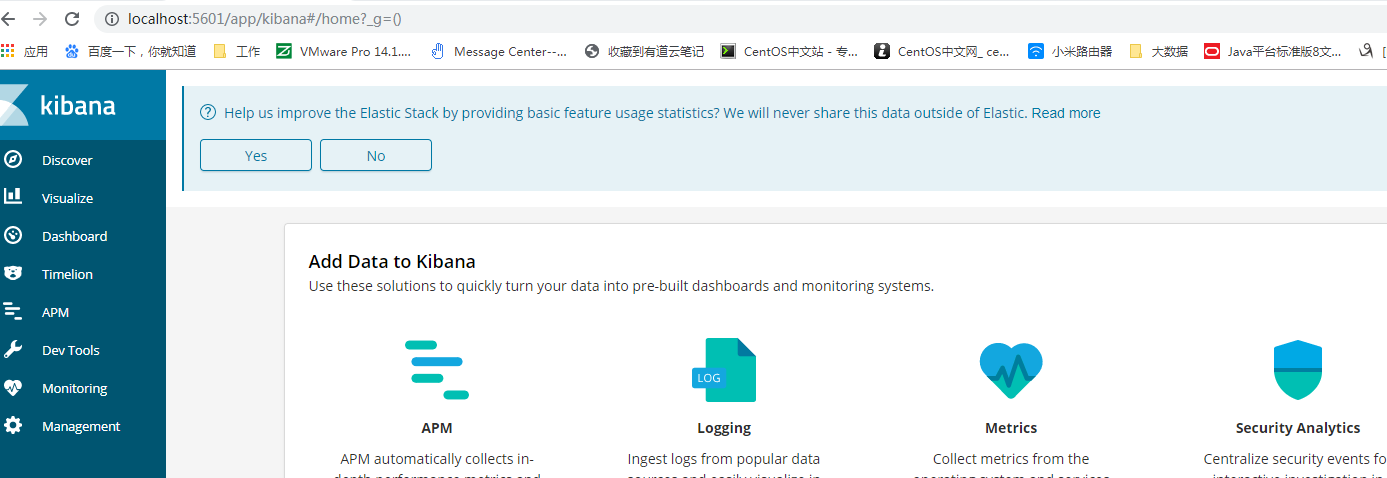
解压,执行 bin/kibana.bat, 打开页面 http://localhost:5601/
2.Dev tools使用
Kibana会自动连到本机运行的elasticsearch上,获取elasticsearch中的数据
GET _all ---获取全部数据

GET /person/_doc/1 ---获取index为person,id为1的数据
GET /person/_doc/_search?q=age:13
POST _analyze ----ik分词器
{
"analyzer": "ik_max_word",
"text": "我是慕课网"
}
POST _analyze
{
"analyzer": "ik_smart",
"text": "我是中国人"
}
查找person中符合条件的数据, must是and, should是or
POST /person/_search
{
  "query": {
    "bool": {
      "must": [
        {
          "match": {
            "first_name": "Jonh"
          }
        },
        {
          "match": {
            "last_name": "tim"
          }
        }
      ]
    }
  }
}
POST /person/_search
{
  "query": {
    "bool": {
      "should": [
        {
          "match": {
            "first_name": "Jonh"
          }
        },
        {
          "match": {
            "last_name": "tim"
          }
        }
      ]
    }
  }
}
删除全部
delete _all
三。Logstash的安装和使用
logstash可以收集各种来源的日志,从file文件中,mysql数据库中,redis中。这里是收集nginx的access.log中的日志
1.官网https://www.elastic.co/cn/downloads/past-releases/logstash-6-3-2下载logstash-6.3.2.zip,解压
2.在bin目录下新建logstash.conf
input{
    stdin{}
}
output{
    stdout{}
}
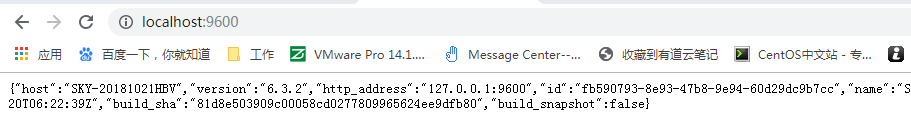
3. 在bin目录执行 logstash -f logstash.conf
http://localhost:9600/ 页面打开查看启动成功
四。logstash获取nginx日志并在kibana展示
1.将nginx的access.log的日志格式改成json类型,修改nginx.conf的http里面
http {
    include       mime.types;
    default_type  application/octet-stream;

    #log_format  main  '$remote_addr - $remote_user [$time_local] "$request" '
    #                  '$status $body_bytes_sent "$http_referer" '
    #                  '"$http_user_agent" "$http_x_forwarded_for"';
    log_format json '{"@timestamp":"$time_iso8601",'
'"host":"$server_addr",'
'"clientip":"$remote_addr",'
'"request":"$request",'
'"size":$body_bytes_sent,'
'"responsetime":$request_time,'
'"upstreamtime":"$upstream_response_time",'
'"upstreamhost":"$upstream_addr",'
'"http_host":"$host",'
'"url":"$uri",'
'"referer":"$http_referer",'
'"agent":"$http_user_agent",'
'"status":"$status"}';

    #access_log  logs/access.log  main;
    access_log  logs/access_json.log  json;
重启nginx 则在/logs/看到access_json.log的日志文件
2.修改logstash的配置,输入输出。
在bin目录新增nginx-accesslog.conf 文件
input{
file {
   path => "D:/tools/nginx-1.12.2/logs/access_json.log" #日志路径
   type => "nginx-access-log"  #类型,自定义
   start_position => "beginning" #从什么位置开始读取文件数据,默认是末尾。导入原有的就设置成beginning,从头开始
   stat_interval => "2"   #间隔多久查看监听的文件是否有更行,默认1s
}
}
output{
   elasticsearch{
     hosts =>["127.0.0.1:9200"]   #elasticsearch服务器地址
     index =>"nginx-access-log-%{+YYYY.MM.dd}.log" #索引名称
}
}
在bin目录 执行logstash -f nginx-accesslog.conf 就可以将access_json.log导入到elasticsearch中
3.kibana日志过滤配置和展示
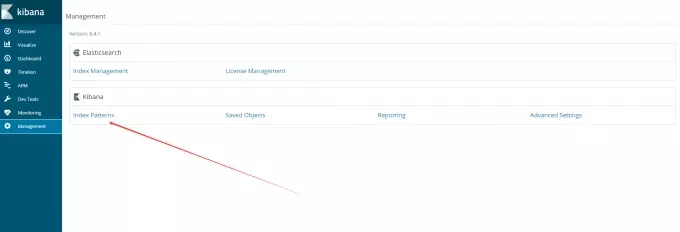
输入logstash中配置的index的名称
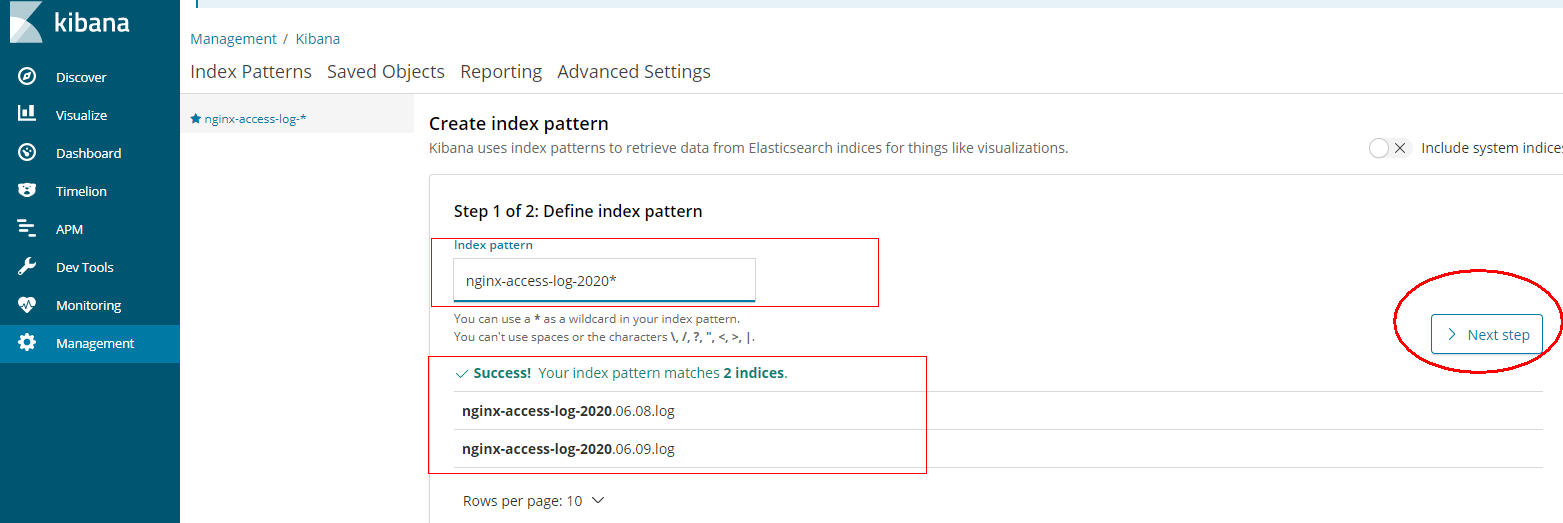
继续下一步,选择带时间戳过滤器

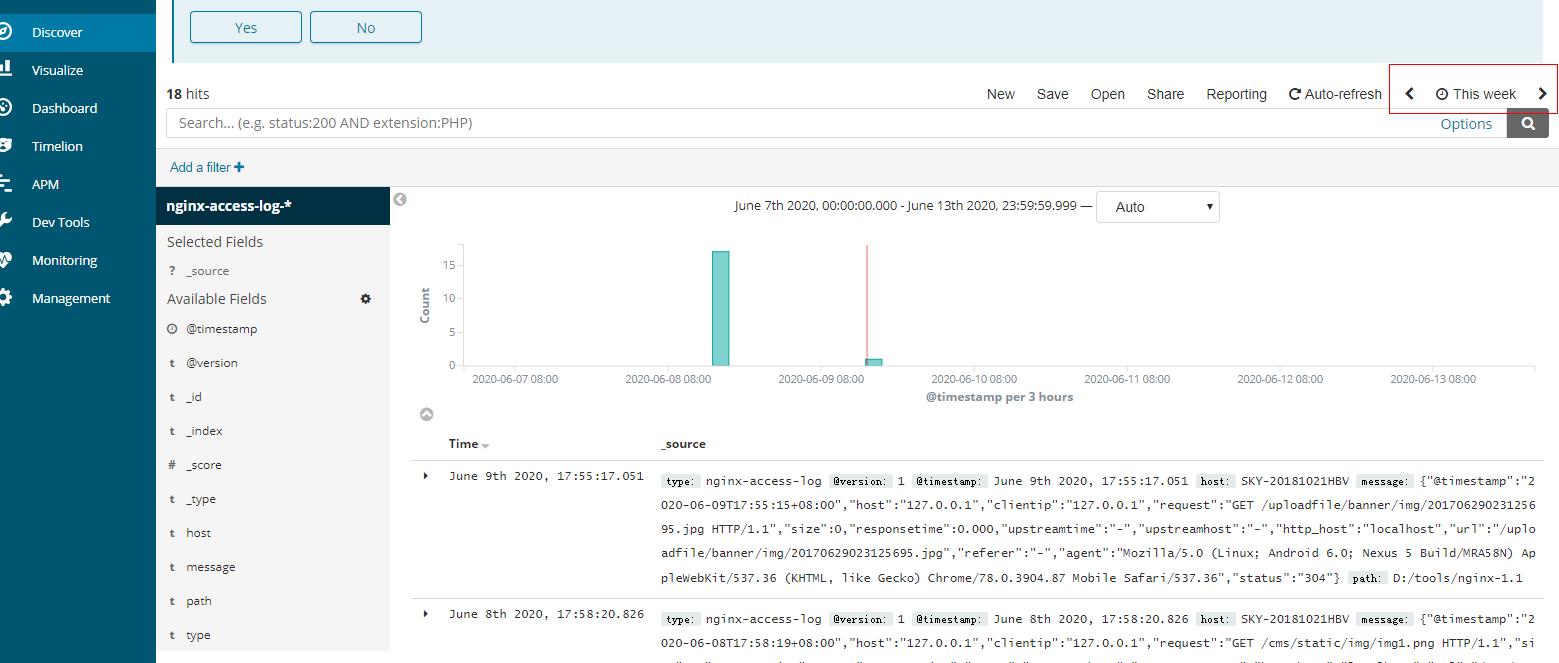
点击左侧Discover菜单,已经发现数据已经展现

 浙公网安备 33010602011771号