prometheus基础
1、下载prometheus
cd /usr/local/src

wget https://github.com/prometheus/prometheus/releases/download/v2.31.1/prometheus-2.31.1.linux-amd64.tar.gz

tar xf prometheus-2.31.1.linux-amd64.tar.gz

mv prometheus-2.31.1.linux-amd64 /usr/local/prometheus-2.31.1
2、创建基础配置文件
cd /usr/local/prometheus-2.31.1
vim prometheus.yml
# 全局配置
global:
  scrape_interval:     15s # 默认,每隔15秒钟抓取一次数据

  # 在与外部系统(比如federation,远程存储系统,Altermanager)通信时,以下标签会贴到时间序列或者告警的后面
  external_labels:
    monitor: 'codelab-monitor'

# 抓取配置
# 在这里配置要抓取的地址
scrape_configs:
  # 任务名会被添加时间序列数据中,稍后会在后面的示例中看到任务名的位置
  - job_name: 'prometheus'

    # 针对prometheus任务,我们设置5s抓取一次数据,覆盖了全局的15s
    scrape_interval: 5s

    # 静态配置,在这里填写所有目标地址的信息,协议默认是http,路径默认是/metrics
    # 即抓取数据时,其实是访问 http://localhost:9090/metrics
    static_configs:
      - targets: ['localhost:9090']
3、启动prometheus
./prometheus --config.file=prometheus.yml
prometheus默认将数据存储在当前目录的data目录下,即:
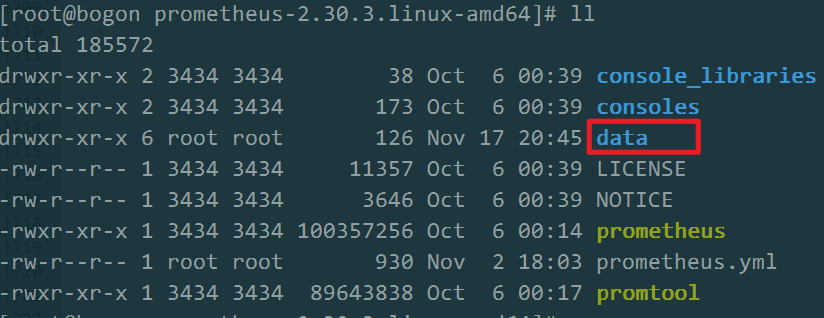
如果要指定其他存储路径(比如存储到/data/prometheus_data),则添加参数:
./prometheus --config.file=prometheus.yml --storage.tsdb.path=/data/prometheus_data
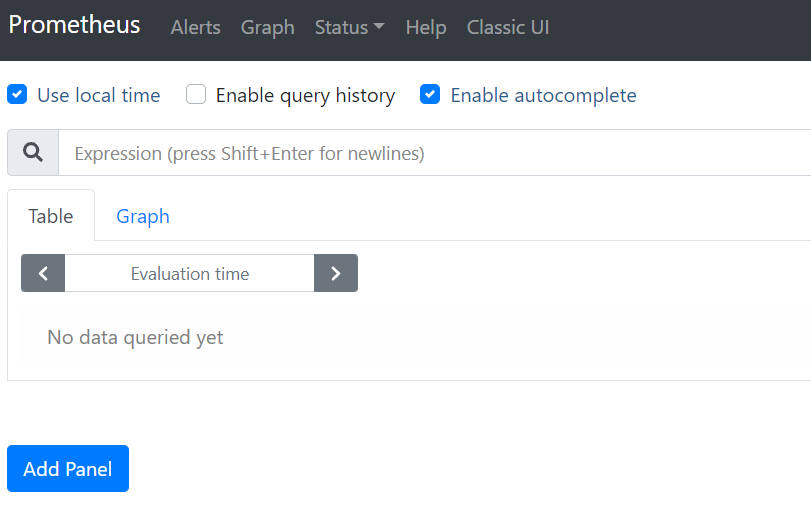
4、访问prometheus的状态页
浏览器访问:http://localhost:9090/,页面如下所示
如果是远程地址,则访问:http://ip:9090/
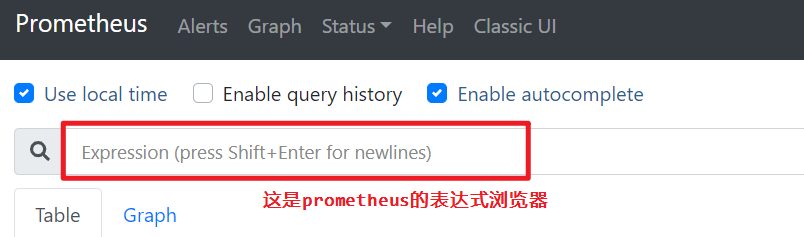
5、使用表达式浏览器
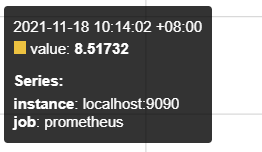
prometheus会从http://localhost:9090/metrics地址读取数据,然后存储起来,之后就可以在状态页面上查询这些数据。
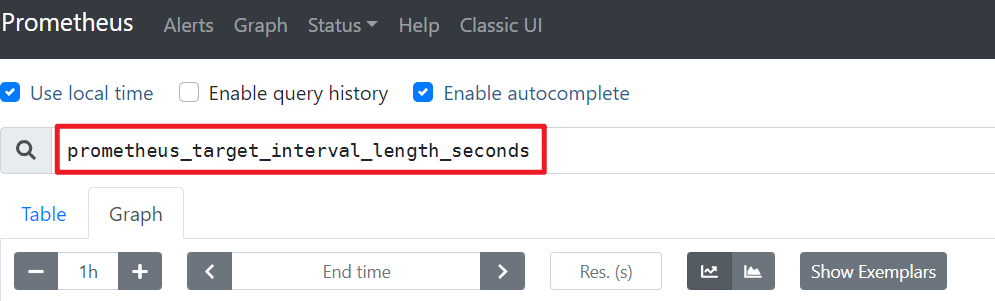
切换到graph标签,然后在表达式浏览器中输入prometheus_target_interval_length_seconds,该度量名
表示每次抓取数据的间隔时间,比如第一次抓取是10:15:05,第二次抓取是10:15:10,则间隔时间是5s。
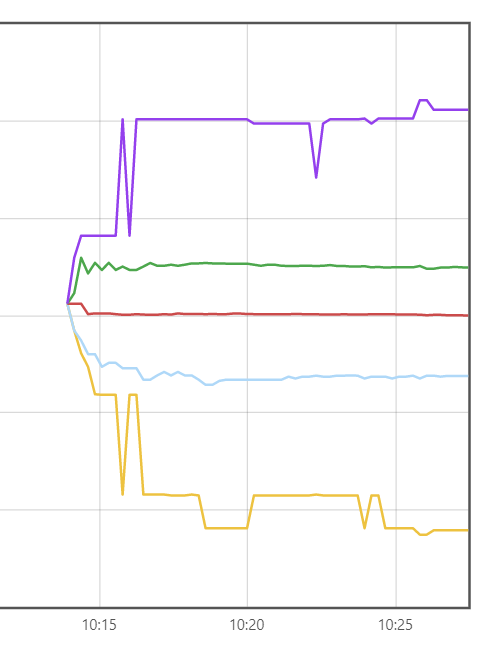
上面是5个时间序列,同时,这5个时间序列都记录了一个值,反映在上面的图中。
在上面的图中,每个时间点,都有5个值。
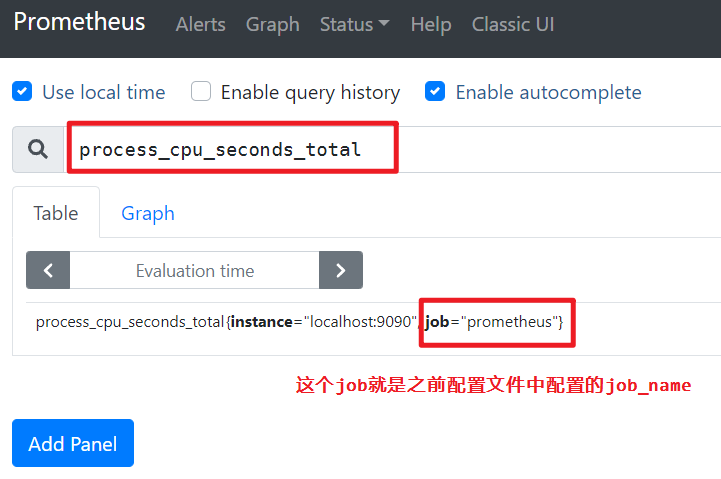
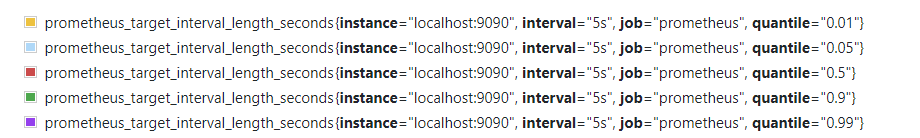
每个时间序列的组成:度量名 + 标签。
其中prometheus_target_interval_length_seconds是度量名,{}代表的就是标签。由于标签内的quantile不同,因此这是5个不同的标签。
其中quantile代表分位数。
这些标签通过quantile指定了不同的延迟百分比。
如果只对99%延迟感兴趣,则执行表达式:prometheus_target_interval_length_seconds{quantile="0.99"}
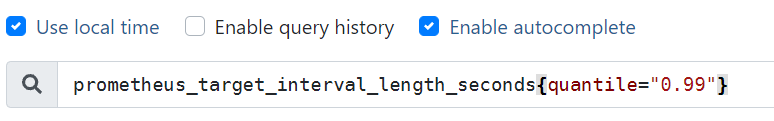

此时图中只有一条线。
如果要计算返回的时间序列的数量,则执行表达式:count(prometheus_target_interval_length_seconds)
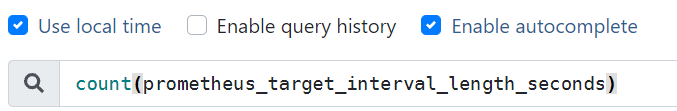
更详细的表达式语法在:https://prometheus.io/docs/prometheus/latest/querying/basics/
6、使用目标样例
下载node_exporter并启动:
wget https://github.com/prometheus/node_exporter/releases/download/v*/node_exporter-*.*-amd64.tar.gz
tar xvfz node_exporter-*.*-amd64.tar.gz
cd node_exporter-*.*-amd64

# 在不同的终端中启动这2个node_exporter
./node_exporter --web.listen-address 127.0.0.1:8080
./node_exporter --web.listen-address 127.0.0.1:8081
./node_exporter --web.listen-address 127.0.0.1:8082
然后修改prometheus的配置文件,从而让prometheus监控这3个目标:
scrape_configs:
  # 这是针对prometheus任务的配置
  - job_name: 'prometheus'

    scrape_interval: 5s

    static_configs:
      - targets: ['localhost:9090']

  # 这是针对node任务的配置
  - job_name:       'node'

    scrape_interval: 5s

    static_configs:
      - targets: ['localhost:8080', 'localhost:8081']
        # 给8080和8081绑定标签 group: 'production',以表示这两个目标是生产服务器
        labels:
          group: 'production'

      - targets: ['localhost:8082']
        # 给8082绑定标签 group: 'canary',以表示这个目标是候选服务器
        labels:
          group: 'canary'
http://localhost:8080/metrics
http://localhost:8081/metrics
http://localhost:8082/metrics
之后,prometheus就会从上述三个地址抓取数据。
验证是否抓取到数据:
node_cpu_seconds_total

展示node任务下,所有目标的cpu总秒数:
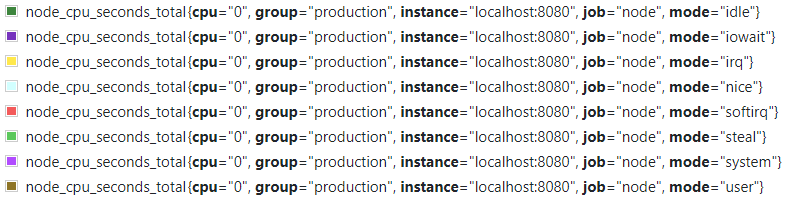
这是目标 8080 上的cpu0的情况,总共有8个mode,因此有8个时间序列,所以在单个时间点,会有8个数据。(每个时间序列携带一个数据)
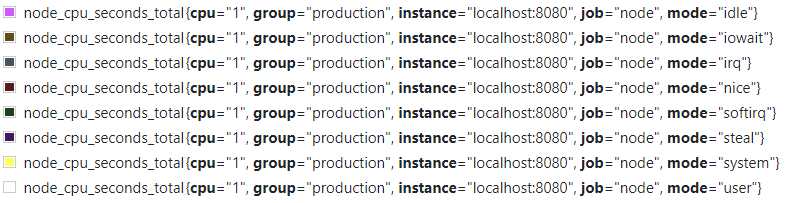
这是目标 8080 上的cpu1的情况,总共有8个mode,因此有8个时间序列,所以在单个时间点,会有8个数据。(每个时间序列携带一个数据)
7、配置规则,将已抓取的数据聚合成新时间序列
如果执行一个查询,该查询需要聚合上千个时间序列来计算,可能会很慢。
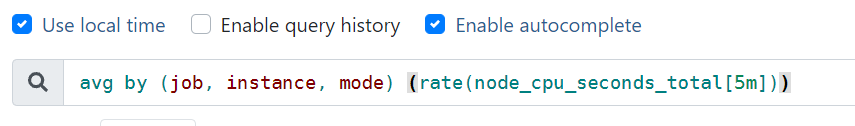
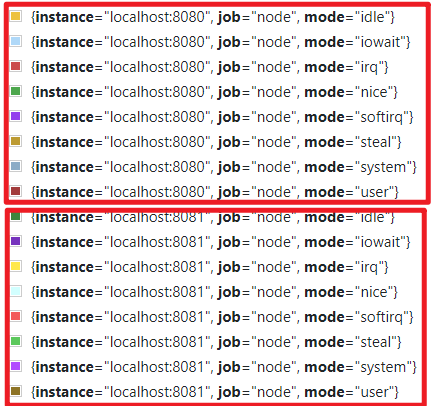
执行一个常规的聚合查询:avg by (job, instance, mode) (rate(node_cpu_seconds_total[5m]))
现在创建一个规则文件:
vim prometheus.rules.yml
groups:
- name: cpu-node
  rules:
  # 创建的新时间序列(从其他表达式聚合而来)
  - record: job_instance_mode:node_cpu_seconds:avg_rate5m
    expr: avg by (job, instance, mode) (rate(node_cpu_seconds_total[5m]))
修改prometheus.yml文件,以加载规则文件:
global:
  scrape_interval:     15s
  evaluation_interval: 15s   # 每隔15s评估一次规则

  external_labels:
    monitor: 'codelab-monitor'

rule_files:
  - 'prometheus.rules.yml'

scrape_configs:
  - job_name: 'prometheus'

    scrape_interval: 5s

    static_configs:
      - targets: ['localhost:9090']

  - job_name:       'node'

    scrape_interval: 5s

    static_configs:
      - targets: ['localhost:8080', 'localhost:8081']
        labels:
          group: 'production'

      - targets: ['localhost:8082']
        labels:
          group: 'canary'
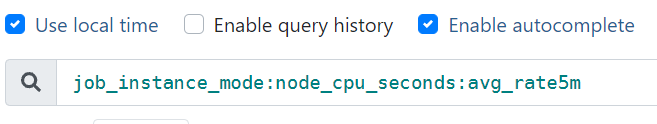
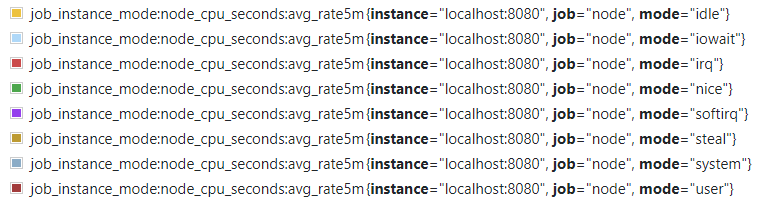
重新启动prometheus,然后执行新表达式:
job_instance_mode:node_cpu_seconds:avg_rate5m
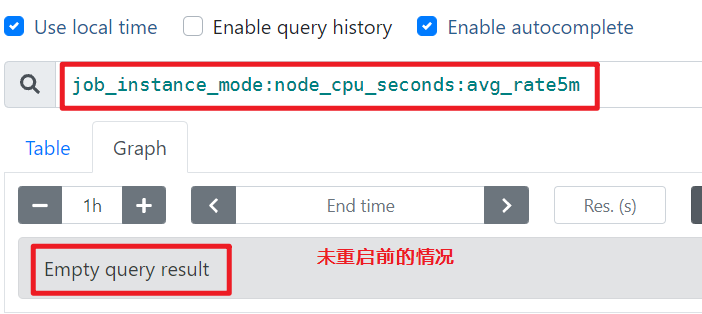
重启之后:

 浙公网安备 33010602011771号