

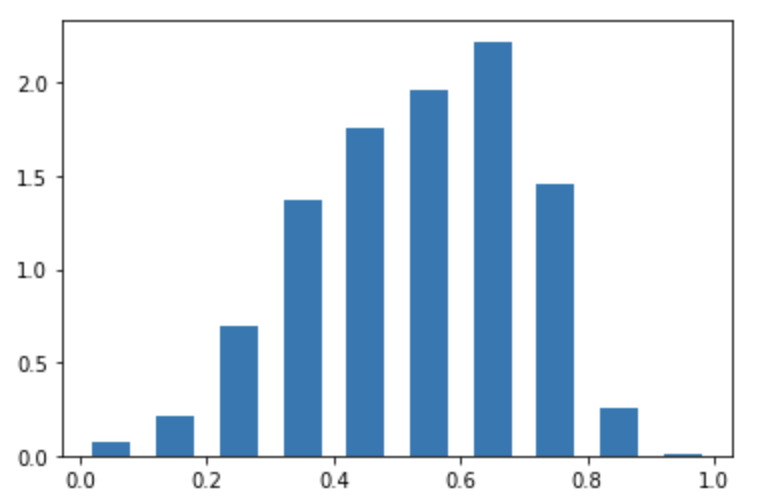
plt.hist绘制直方图
import matplotlib.pyplot as plt
x = pdf.loc[:, 'sway_intention']
plt.hist(x, bins=10, range=(0, 1), density=True, stacked=True, weights=None, cumulative=False, bottom=None, histtype=u'bar', align=u'mid', orientation=u'vertical', rwidth=0.6, log=False, color=None, label=None)

 浙公网安备 33010602011771号