哔哩哔哩热榜爬虫程序及数据处理

完整的代码与结果在最下面
一、设计方案
1.爬虫的目标是哔哩哔哩排行榜上视频的信息(https://www.bilibili.com/ranking/all/0/1/7)
2.爬取的内容包括网页上显示的所有内容,有排名标题,播放量,弹幕数,up,得分以及视频的url

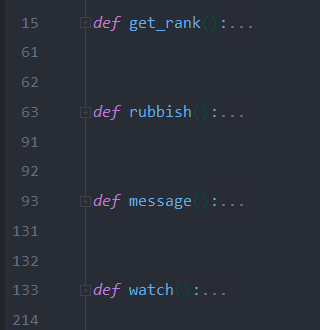
3.设计方案:根据作业的要求,制作爬虫程序爬取信息并进行数据处理,整个程序分成四个部分,包括数据爬取:(get_rank),数据清洗与处理:(rubbish),文本分析生成词云:(message),数据分析与可视化:(watch)四个部分,所用到的库有request,BeautifulSoup,csv,collections,jieba,io,wordcloud,matplotlib。使用的IDE为anaconda环境配置的pycharm
设计难点:难点主要在数据处理方面,因为哔哩哔哩排行榜上爬取到的数据全都不是单纯的数字,所以在数据处理时遇到了许多问题,这方面查找资料的时间也最长
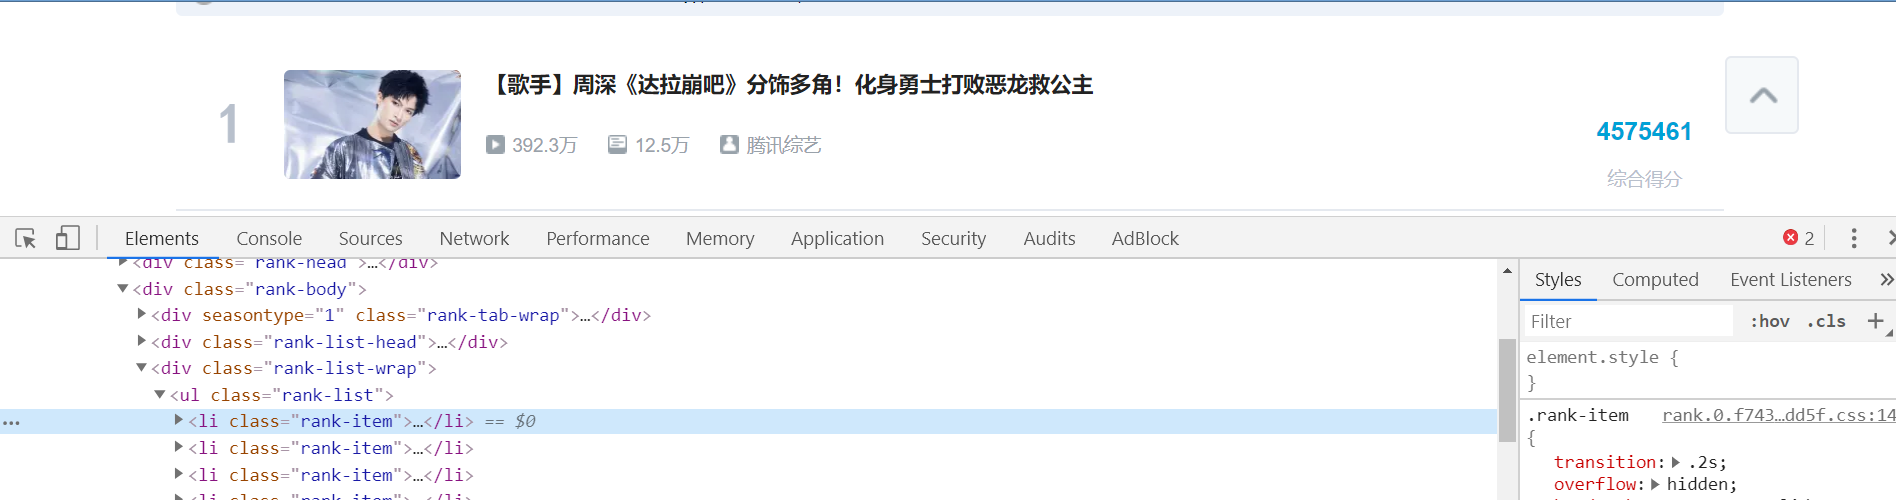
二、主题页面的结构特征分析
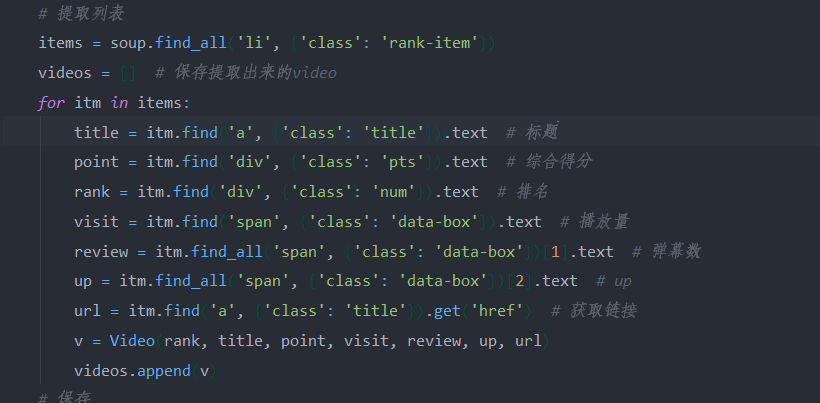
通过观察网页代码,发现排行榜上的每一个视频的标签为li,类名为rank-item,并且我们通过len函数打印提取到的数量也正好100符合排行榜的视频量,所以我们可以在当中继续得到视频其他信息的属性,在代码中都有注释。
三、网络爬虫程序设计
# 代码中注释部分的print都是为了调试用的
1.数据爬取(get_rank)
在保存数据部分用了self函数创建数据对象来将数据读入video对象中并且放在一个列表里,最后保存在csv文件中


import csv
import requests
from bs4 import BeautifulSoup
import pandas as pd
from collections import OrderedDict
import jieba
import io
from wordcloud import WordCloud
import matplotlib.pyplot as plt


# 注释部分的print都是为了调试用的


def get_rank():  # 数据爬取与采集
    # 发起网络请求
    url = 'https://www.bilibili.com/ranking/all/0/1/7'
    response = requests.get(url)
    html_text = response.text
    soup = BeautifulSoup(html_text, 'html.parser')

    # 用来保存视频信息的对象
    class Video:
        def __init__(self, rank, title, point, visit, review, up, url):
            self.rank = rank
            self.title = title
            self.point = point
            self.visit = visit
            self.review = review
            self.up = up
            self.url = url

        def to_csv(self):
            return [self.rank, self.title, self.point, self.visit, self.review, self.up, self.url]

        @staticmethod
        def csv_title():
            return ['排名', '标题', '分数', '播放量', '弹幕数', 'UP', 'URL']

    # 提取列表
    items = soup.find_all('li', {'class': 'rank-item'})
    videos = []  # 保存提取出来的video
    for itm in items:
        title = itm.find('a', {'class': 'title'}).text  # 标题
        point = itm.find('div', {'class': 'pts'}).text  # 综合得分
        rank = itm.find('div', {'class': 'num'}).text  # 排名
        visit = itm.find('span', {'class': 'data-box'}).text  # 播放量
        review = itm.find_all('span', {'class': 'data-box'})[1].text  # 弹幕数
        up = itm.find_all('span', {'class': 'data-box'})[2].text  # up
        url = itm.find('a', {'class': 'title'}).get('href')  # 获取链接
        v = Video(rank, title, point, visit, review, up, url)
        videos.append(v)
    # 保存
    file_name = f'top100.csv'
    with open(file_name, 'w', newline='') as f:
        pen = csv.writer(f)
        pen.writerow(Video.csv_title())
        for v in videos:
            pen.writerow(v.to_csv())  # 导出数据到csv文件中
    print('保存csv成功')


get_rank()
结果: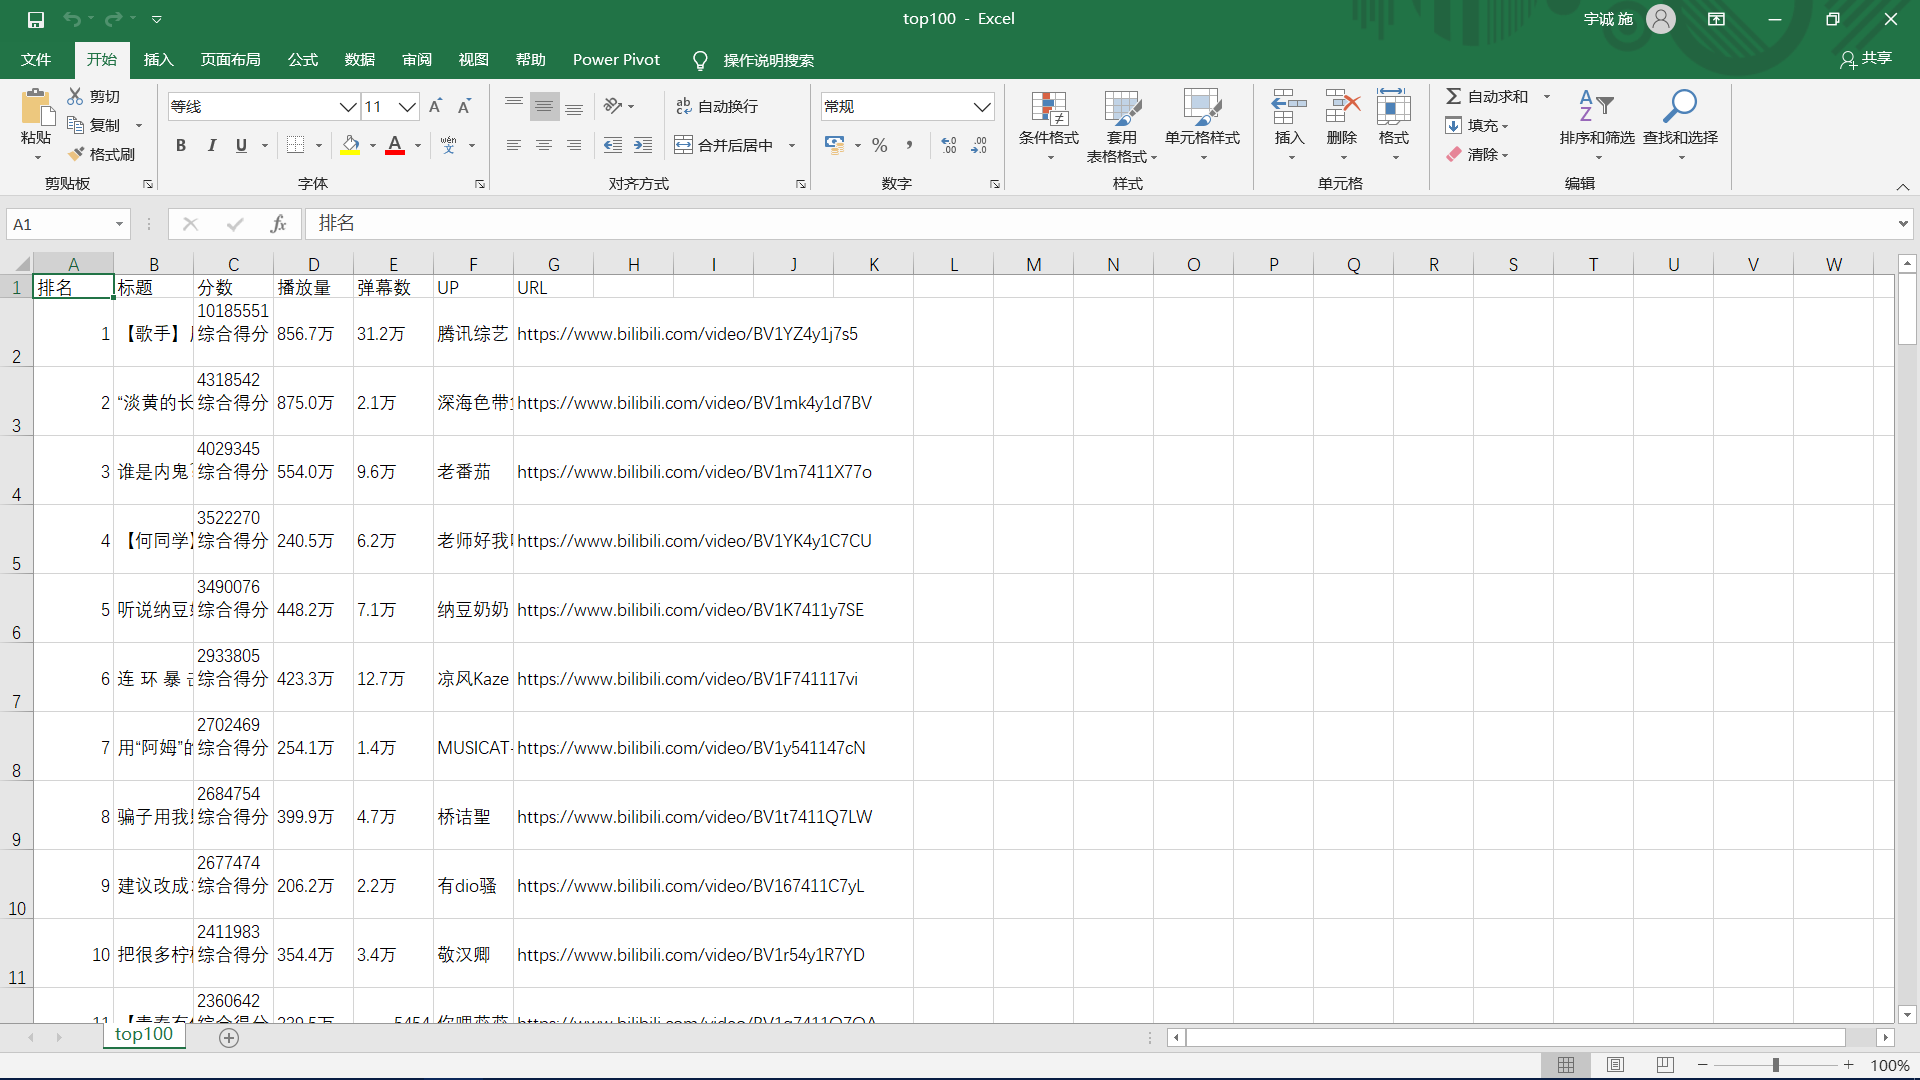
2.数据清洗与处理(rubbish)
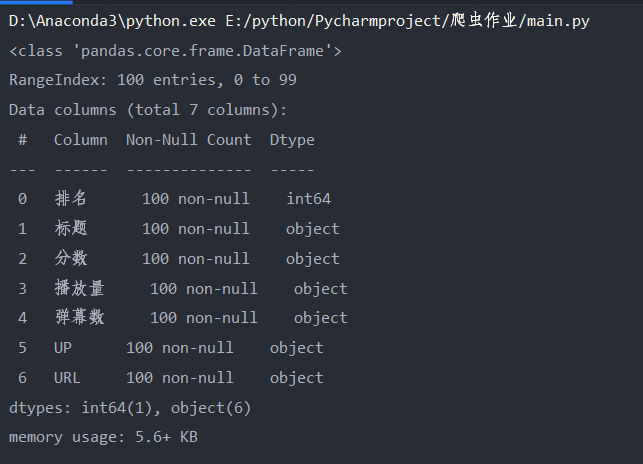
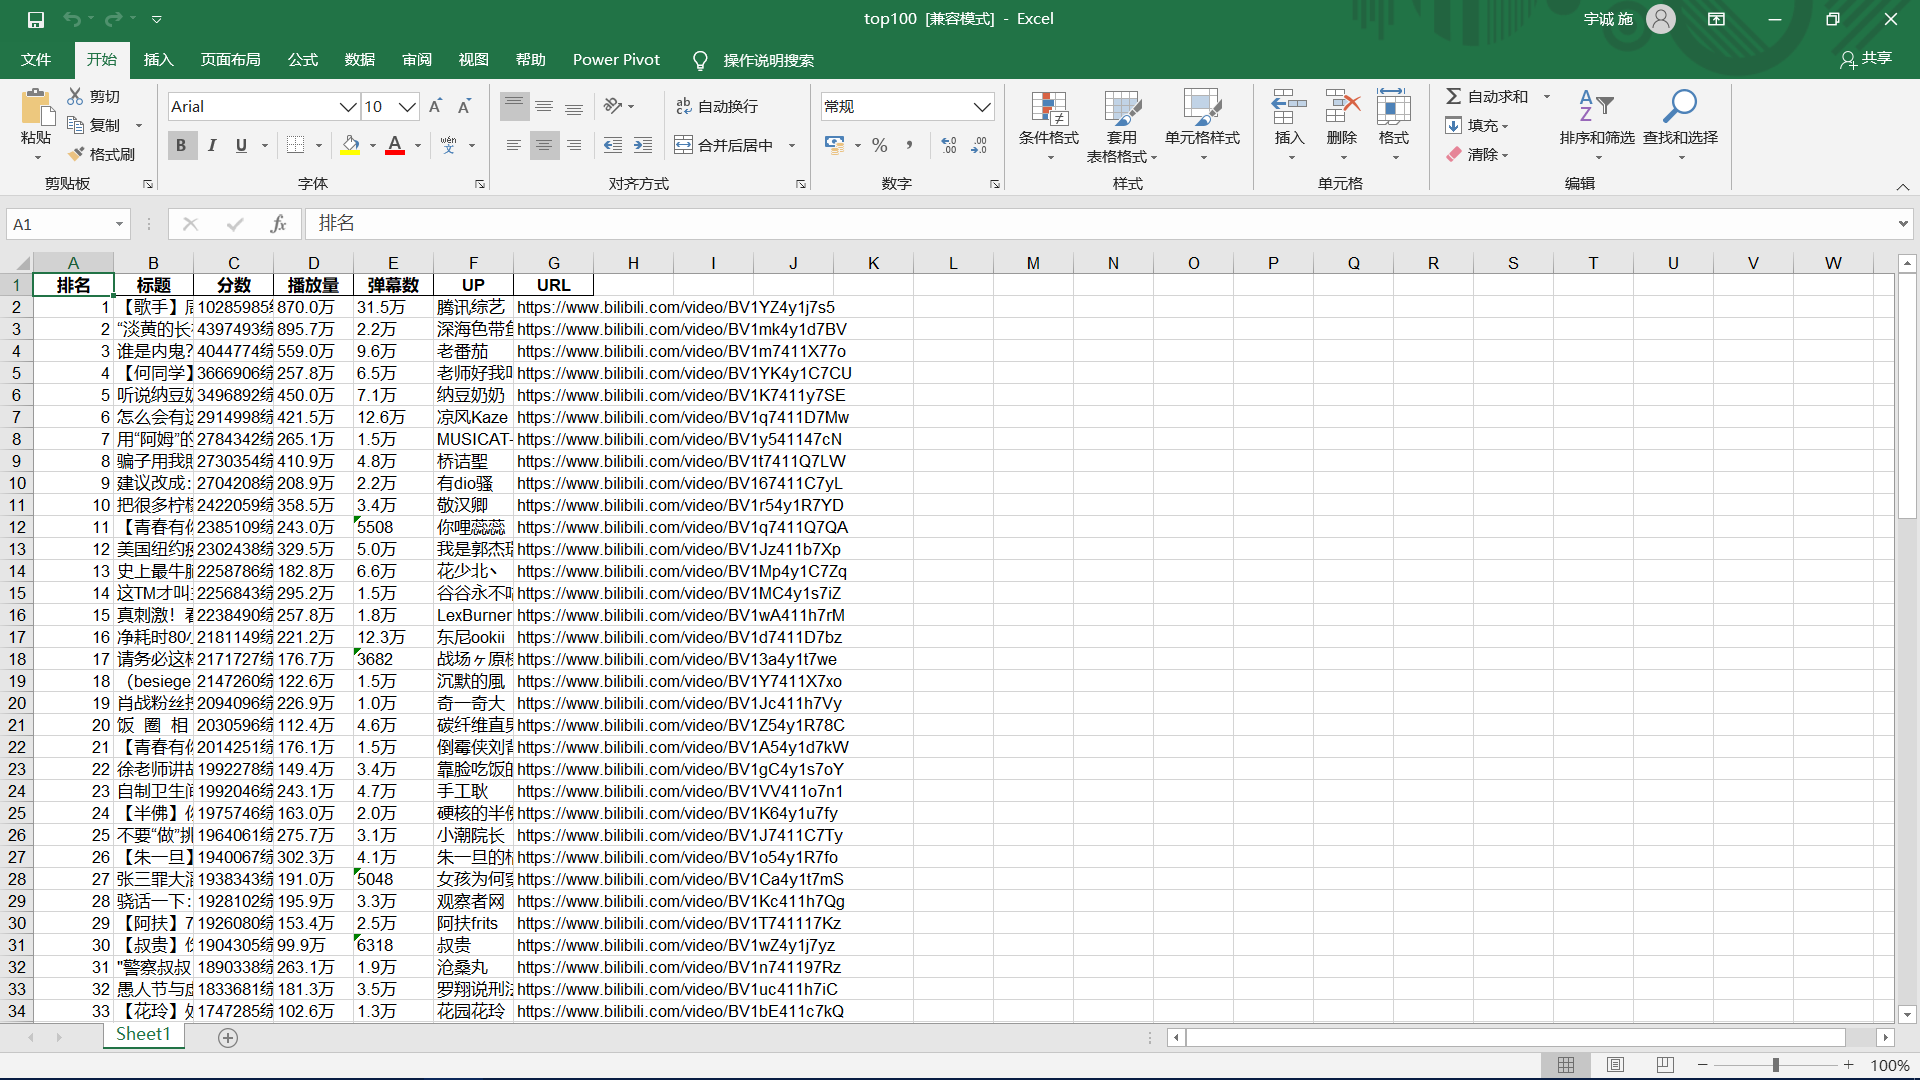
这一部分遇到了几个小问题,包括pycharm控制窗的输出结果不会显示所有数据,以及数据的编码问题,都在网上找到解决的方法,最后将清洗过的数据保存为xls文件
def rubbish():  # 对数据进行清洗和处理
    # pycharm控制窗的输出结果不会显示所有数据,所以在网上得到加入这三行代码进行解决方便查看结果
    pd.set_option('display.width', 1000)  # 加了这一行那表格的一行就不会分段出现了
    # 显示所有列
    pd.set_option('display.max_columns', None)
    # 显示所有行
    pd.set_option('display.max_rows', None)
    # 对齐输出结果
    pd.set_option('display.unicode.ambiguous_as_wide', True)
    pd.set_option('display.unicode.east_asian_width', True)

    # 使用‘utf-8’会报错,使用其他解码会乱码,最终在网上得到了答案:‘在后面加入指定编译器为python即可’
    # 将csv格式数据写入到excel中
    df = pd.read_csv('top100.csv', engine='python', error_bad_lines=False)  # 当某行数据有问题时,不报错,直接跳过,处理脏数据时使用
    # print(df)   #输出csv表格中结果
    data = OrderedDict()  # 有序字典
    # print(df.columns)     #列名
    for line in list(df.columns):
        data[line] = list(df[line])  # 构建excel格式

    obj = pd.DataFrame(data)
    obj.to_excel('top100.xls', index=False)
    # 查看统计信息,设置参数buf来存储字符串使数据不打印出来
    buf = io.StringIO()
    df.info(buf=buf)
    s = buf.getvalue()
    # print(s)
    print('保存xls成功')


rubbish()
3.文本分析生成词云:(message)
文本分析,包括使用jieba库进行分词和wouldcould生成词云,先用列的标题进行查询,读取标题所在的那一列保存在txt文档中,然后使用jieba库进行分词,使用wouldcould制作词云保存成图片
def message():  # 文本分析,包括使用jieba库进行分词和wouldcould生成词云
    # 用DictReader读取csv的某一列,用列的标题查询
    with open('top100.csv', 'rt') as csvfile:
        reader = csv.DictReader(csvfile)
        column = [row['标题'] for row in reader]
    # print(column)
    # 将标题列保存到txt文件中
    file = open('top100标题.txt', 'w')
    file.write(str(column))
    file.close()  # 关闭文件
    print('保存txt成功')

    # 使用jieba库进行中文分词
    final = ""
    # 文件夹位置
    filename = r"top100标题.txt"
    # 打开文件夹,读取内容,并进行分词
    with open(filename, 'r', encoding='gb18030') as f:
        for line in f.readlines():
            word = jieba.cut(line)
            for i in word:
                final = final + i + " "
    # print(final)
    print('jieba分词成功')

    # 使用worldcould制作词云
    # 打开文本
    text = open('top100标题.txt').read()
    # 生成对象
    wc = WordCloud(font_path='C:\Windows\Fonts\simfang.ttf', width=800, height=600, mode='RGBA',
                   background_color=None).generate(text)
    # 显示词云
    plt.imshow(wc, interpolation='bilinear')
    plt.axis('off')
    plt.show()
    # 保存到文件
    wc.to_file('标题词云.png')  # 生成图像是透明的
    print('保存词云成功')


message()
jieba库分词结果: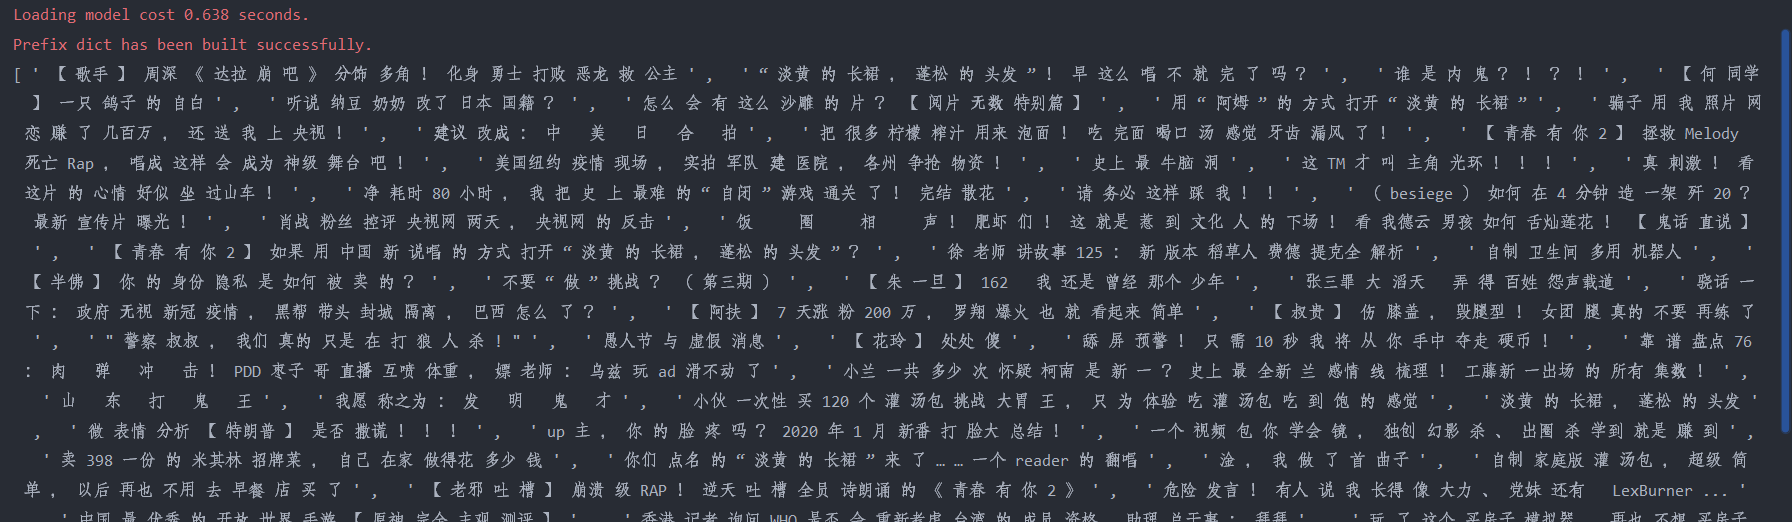
保存结果:
4.数据分析与可视化:(watch)
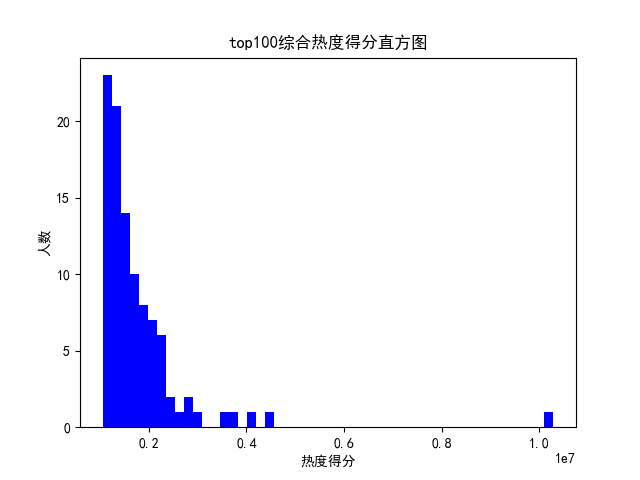
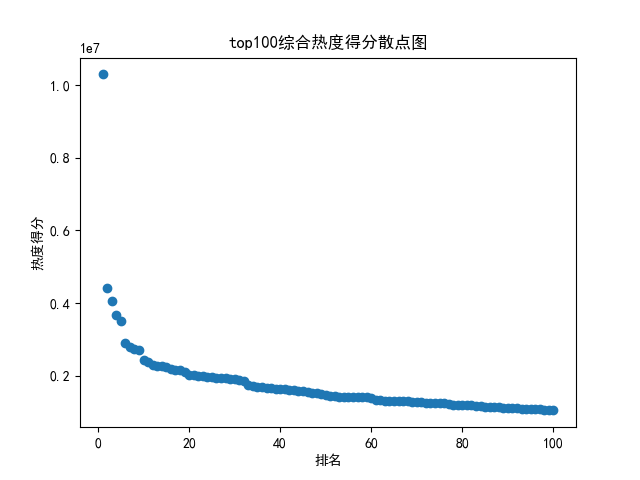
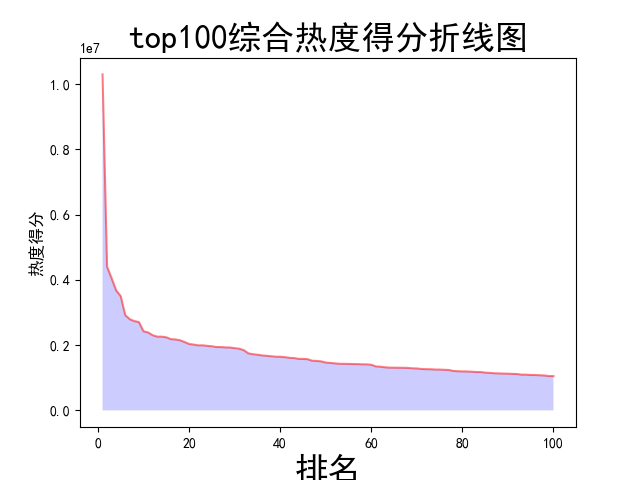
数据分析与可视化,包括绘制折线图,柱形图,直方图,散点图
def watch():  # 数据分析与可视化,包括绘制折线图,柱形图,直方图,散点图
    # 获得绘图数据
    point = pd.read_csv('top100.csv', engine='python')
    # print(data.isnull().sum)
    # 将字符串数据进行去除替换
    rank = point['排名']
    # print(rank)
    points = point['分数'].map(lambda x: int(x.replace('综合得分', '')))
    # print(points)
    plt.rcParams['font.sans-serif'] = ['SimHei']  # 用来正常显示中文标签
    plt.rcParams['axes.unicode_minus'] = False  # 用来正常显示负号
    # 根据数据绘制折线图
    plt.plot(rank, points, c='red', alpha=0.5)
    # 绘图表区域着色
    plt.fill_between(rank, points, facecolor='blue', alpha='0.2')
    # 设置图形的格式
    plt.title('top100综合热度得分折线图', fontsize=24)
    plt.xlabel('排名', fontsize=24)
    plt.ylabel('热度得分', fontsize=12)
    # 参数刻度线样式设置
    plt.tick_params(axis='both', which='major', labelsize=10)
    # 保存图片
    plt.savefig(fname="top100综合热度得分折线图.png", figsize=[10, 10])
    # 显示折线图
    plt.show()
    print('折线图保存成功')
    # 根据数据绘制柱形图
    # 创建基础图
    fig = plt.figure()
    # 在基础图上仅绘制一个图,括号中的三个参数代表基础图中的统计图布局,参数一次代表:图的行数量、图的列数量、第几个图。本例中,为1行1列,第一个图
    bar1 = fig.add_subplot(1, 1, 1)
    # 绘制柱形图,align表示条形与标签中间对齐。
    bar1.bar(rank, points, align='center', color="blue")
    # 设置x、y轴标签
    plt.xlabel("排名")
    plt.ylabel("热度得分")
    # 设置统计图标题
    plt.title("top100综合热度得分柱形图")
    # 保存图片
    plt.savefig(fname="top100综合热度得分柱形图.png", figsize=[10, 10])
    # 显示统计图
    plt.show()
    print('柱形图保存成功')
    # 绘制直方图
    # 绘制基础图
    fig = plt.figure()
    hist1 = fig.add_subplot(1, 1, 1)
    # 绘制直方图
    # bins=50 表示每个变量的 值应该被分成 50 份。normed=False 表示直方图显示的是频率分布
    hist1.hist(points, bins=50, color="blue", density=False)
    # 确定坐标轴位置
    hist1.xaxis.set_ticks_position("bottom")
    hist1.yaxis.set_ticks_position("left")
    # 设置坐标轴标签
    plt.xlabel("热度得分")
    plt.ylabel("人数")
    # 设置标题
    plt.title("top100综合热度得分直方图")
    # 保存图片
    plt.savefig(fname="top100综合热度得分直方图.png", figsize=[10, 10])
    # 显示图形
    plt.show()
    print('直方图保存成功')
    # 绘制散点图
    fig = plt.figure()
    scatter1 = fig.add_subplot(1, 1, 1)
    # 导入数据
    scatter1.scatter(rank, points)
    # 确定坐标轴位置
    scatter1.xaxis.set_ticks_position('bottom')
    scatter1.yaxis.set_ticks_position('left')
    # 设置坐标轴标签
    plt.xlabel("排名")
    plt.ylabel("热度得分")
    # 设置图表标题
    plt.title("top100综合热度得分散点图")
    # 保存图片
    plt.savefig(fname="top100综合热度得分散点图.png", figsize=[10, 10])
    # 显示图形
    plt.show()
    print('散点图保存成功')


watch()
结果:


完整代码
import csv
import requests
from bs4 import BeautifulSoup
import pandas as pd
from collections import OrderedDict
import jieba
import io
from scipy.optimize import leastsq
from wordcloud import WordCloud
import matplotlib.pyplot as plt


# 注释部分的print都是为了调试用的

def get_rank():  # 数据爬取与采集
    try:
        # 发起网络请求
        url = 'https://www.bilibili.com/ranking/all/0/1/7'
        response = requests.get(url)
        html_text = response.text
        soup = BeautifulSoup(html_text, 'html.parser')

        # 用来保存视频信息的对象
        class Video:
            def __init__(self, rank, title, point, visit, review, up, url):
                self.rank = rank
                self.title = title
                self.point = point
                self.visit = visit
                self.review = review
                self.up = up
                self.url = url

            def to_csv(self):
                return [self.rank, self.title, self.point, self.visit, self.review, self.up, self.url]

            # 使用静态方法
            @staticmethod
            def csv_title():
                return ['排名', '标题', '分数', '播放量', '弹幕数', 'UP', 'URL']

        # 提取列表
        items = soup.find_all('li', {'class': 'rank-item'})
        videos = []  # 保存提取出来的video
        for itm in items:
            title = itm.find('a', {'class': 'title'}).text  # 标题
            point = itm.find('div', {'class': 'pts'}).text  # 综合得分
            rank = itm.find('div', {'class': 'num'}).text  # 排名
            visit = itm.find('span', {'class': 'data-box'}).text  # 播放量
            review = itm.find_all('span', {'class': 'data-box'})[1].text  # 弹幕数
            up = itm.find_all('span', {'class': 'data-box'})[2].text  # up
            url = itm.find('a', {'class': 'title'}).get('href')  # 获取链接
            v = Video(rank, title, point, visit, review, up, url)
            videos.append(v)
        # 保存
        file_name = f'top100.csv'
        with open(file_name, 'w', newline='') as f:
            pen = csv.writer(f)
            pen.writerow(Video.csv_title())
            # 导出数据到csv文件中
            for v in videos:
                pen.writerow(v.to_csv())
        print('保存csv成功')
    except:
        return "保存csv失败"


def rubbish():  # 对数据进行清洗和处理
    try:
        # pycharm控制窗的输出结果不会显示所有数据,所以在网上得到加入这三行代码进行解决方便查看结果
        # 加了这一行那表格的一行就不会分段出现了
        pd.set_option('display.width', 1000)
        # 显示所有列
        pd.set_option('display.max_columns', None)
        # 显示所有行
        pd.set_option('display.max_rows', None)
        # 对齐输出结果
        pd.set_option('display.unicode.ambiguous_as_wide', True)
        pd.set_option('display.unicode.east_asian_width', True)

        # 使用‘utf-8’会报错,使用其他解码会乱码,最终在网上得到了答案:‘在后面加入指定编译器为python即可’
        # 将csv格式数据写入到excel中
        df = pd.read_csv('top100.csv', engine='python', error_bad_lines=False)  # 当某行数据有问题时,不报错,直接跳过,处理脏数据时使用
        # print(df)   #输出csv表格中结果
        data = OrderedDict()  # 有序字典
        # print(df.columns)     #列名
        # 构建excel格式
        for line in list(df.columns):
            data[line] = list(df[line])
        obj = pd.DataFrame(data)
        obj.to_excel('top100.xls', index=False)
        # 查看统计信息,设置参数buf来存储字符串使数据不打印出来
        buf = io.StringIO()
        df.info(buf=buf)
        s = buf.getvalue()
        print(s)
        print('保存xls成功')
    except:
        return "保存xls失败"


rubbish()


def message():  # 文本分析,包括使用jieba库进行分词和wouldcould生成词云
    try:
        # 用DictReader读取csv的某一列,用列的标题查询
        with open('top100.csv', 'rt') as csvfile:
            reader = csv.DictReader(csvfile)
            column = [row['标题'] for row in reader]
        # print(column)
        # 将标题列保存到txt文件中
        file = open('top100标题.txt', 'w')
        file.write(str(column))
        # 关闭文件
        file.close()
        print('保存txt成功')
    except:
        return "保存txt失败"

    try:
        # 使用jieba库进行中文分词
        final = ""
        # 文件夹位置
        filename = r"top100标题.txt"
        # 打开文件夹,读取内容,并进行分词
        with open(filename, 'r', encoding='gb18030') as f:
            for line in f.readlines():
                word = jieba.cut(line)
                for i in word:
                    final = final + i + " "
        # print(final)
        print('jieba分词成功')
    except:
        return 'jieba分词失败'

    try:
        # 使用worldcould制作词云
        # 打开文本
        text = open('top100标题.txt').read()
        # 生成对象
        wc = WordCloud(font_path='C:\Windows\Fonts\simfang.ttf',
                       width=800,
                       height=600,
                       mode='RGBA',
                       background_color=None).generate(text)
        # 显示词云
        plt.imshow(wc, interpolation='bilinear')
        plt.axis('off')
        plt.show()
        # 保存到文件
        wc.to_file('标题词云.png')  # 生成图像是透明的
        print('保存词云成功')
    except:
        return '保存词云失败'


message()


def watch():  # 数据分析与可视化,包括绘制折线图,柱形图,直方图,散点图
    try:
        # 获得绘图数据
        point = pd.read_csv('top100.csv', engine='python')
        # print(data.isnull().sum)
        # 将字符串数据进行去除替换
        rank = point['排名']
        # print(rank)
        points = point['分数'].map(lambda x: int(x.replace('综合得分', '')))
        # print(points)
        # 用来正常显示中文标签
        plt.rcParams['font.sans-serif'] = ['SimHei']
        # 用来正常显示负号
        plt.rcParams['axes.unicode_minus'] = False
        print('获取绘图数据成功')
    except:
        return '获取数据失败'

    try:
        # 根据数据绘制折线图
        plt.plot(rank,
                 points,
                 c='red',
                 alpha=0.5)
        # 绘图表区域着色
        plt.fill_between(rank,
                         points,
                         facecolor='blue',
                         alpha='0.2')
        # 设置图形的格式
        plt.title('top100综合热度得分折线图',
                  fontsize=24)
        plt.xlabel('排名',
                   fontsize=24)
        plt.ylabel('热度得分',
                   fontsize=12)
        # 参数刻度线样式设置
        plt.tick_params(axis='both',
                        which='major',
                        labelsize=10)
        # 保存图片
        plt.savefig(fname="top100综合热度得分折线图.png",
                    figsize=[10, 10])
        # 显示折线图
        plt.show()
        print('折线图保存成功')
    except:
        return '折线图保存失败'

    try:
        # 根据数据绘制柱形图
        # 创建基础图
        fig = plt.figure()
        # 在基础图上仅绘制一个图,括号中的三个参数代表基础图中的统计图布局,参数一次代表:图的行数量、图的列数量、第几个图。本例中,为1行1列,第一个图
        bar1 = fig.add_subplot(1, 1, 1)
        # 绘制柱形图,align表示条形与标签中间对齐。
        bar1.bar(rank,
                 points,
                 align='center',
                 color="blue")
        # 设置x、y轴标签
        plt.xlabel("排名")
        plt.ylabel("热度得分")
        # 设置统计图标题
        plt.title("top100综合热度得分柱形图")
        # 保存图片
        plt.savefig(fname="top100综合热度得分柱形图.png",
                    figsize=[10, 10])
        # 显示统计图
        plt.show()
        print('柱形图保存成功')
    except:
        return '柱形图保存失败'

    try:
        # 绘制直方图
        # 绘制基础图
        fig = plt.figure()
        hist1 = fig.add_subplot(1, 1, 1)
        # 绘制直方图
        # bins=50 表示每个变量的 值应该被分成 50 份。normed=False 表示直方图显示的是频率分布
        hist1.hist(points,
                   bins=50,
                   color="blue",
                   density=False)
        # 确定坐标轴位置
        hist1.xaxis.set_ticks_position("bottom")
        hist1.yaxis.set_ticks_position("left")
        # 设置坐标轴标签
        plt.xlabel("热度得分")
        plt.ylabel("人数")
        # 设置标题
        plt.title("top100综合热度得分直方图")
        # 保存图片
        plt.savefig(fname="top100综合热度得分直方图.png", figsize=[10, 10])
        # 显示图形
        plt.show()
        print('直方图保存成功')
    except:
        return '直方图保存失败'

    try:
        # 绘制散点图
        fig = plt.figure()
        scatter1 = fig.add_subplot(1, 1, 1)
        # 导入数据
        scatter1.scatter(rank, points)
        # 确定坐标轴位置
        scatter1.xaxis.set_ticks_position('bottom')
        scatter1.yaxis.set_ticks_position('left')
        # 设置坐标轴标签
        plt.xlabel("排名")
        plt.ylabel("热度得分")
        # 设置图表标题
        plt.title("top100综合热度得分散点图")
        # 保存图片
        plt.savefig(fname="top100综合热度得分散点图.png",
                    figsize=[10, 10])
        # 显示图形
        plt.show()
        print('散点图保存成功')
    except:
        return '散点图保存失败'


watch()
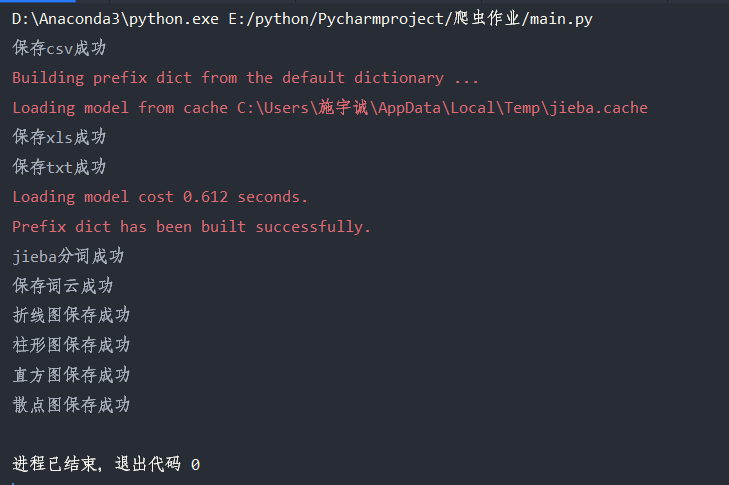
运行结果


四、结论
通过爬虫程序的制作,认识到利用爬虫程序可以做到很多很酷的事情,能够通过爬虫爬取信息并运用其他库处理信息对工作效率的提升是多么的大,提高了自己对python的兴趣,坚定了认真学习的目标。与java相比python确实上手快 库多 简洁,java就一个httpclient就够学好久了。

 浙公网安备 33010602011771号