istio可观测性
可观测性
istio将envoy的可观测性功能进一步简化,可以实现网格到网格之间指标采集,暴露等,但网格内业务应用内部自身的数据是采集不了的,所以还需要在业务程序中做进一步处理
istio支持:
- 指标:服务间通信指标、envoy stats指标(内置)、控制平面指标
- 日志:访问日志,envoy自身日志
- 链路追踪:envoy间传播机制
业务应用需要支持:
- 指标:业务应用自身指标暴露
- 日志:自身日志
- 链路追踪:兼容追踪系统的埋点
指标
指标包括:
- 代理指标:
- 服务指标:
- 控制平面指标:istiod自身的指标,普罗米修斯住区端口为15014/tcp
envoy统计数据分类:
- upstream:离开当前envoy实例的统计信息,包括集群管健康、断路器、tls等
- downstream:传入当前envoy实例的统计信息,包括侦听器、http连接管理器、tcp代理过滤器等
- envoy server:envoy服务实例自身信息,包括运行时间、分配内存等
代理级指标
属于数据平面,envoy出入流量生成指标、自身管理指标,普罗米修斯抓取端口为15020/tcp
说明文档:https://www.envoyproxy.io/docs/envoy/latest/configuration/upstream/cluster_manager/cluster_stats
http连接器相关:https://www.envoyproxy.io/docs/envoy/latest/configuration/http/http_conn_man/stats#config-http-conn-man-stats
默认情况下,istio只是启用envoy的小部分信息采集,相关指标键为:
- 键前缀匹配:reporter=、cluster_manager、listenrer_manager、server、cluster.xds-grpc、wasm、component
- 键后缀匹配:rbac.allowed、rbac.denied、shadow_allowed、shadow_denied
注:envoy使用15020端口暴露指标,相关pod借助注解向普罗米修斯scraper指定抓取位置
查看:
envoy访问端点:
/stats
/stats/prometheus
命令:
kubectl exec pod名 -c istio-proxy -- pilot-agent GET /stats
kubectl exec pod名 -- curl localhost:15000/stats/prometheus

istioctl pc bootstrap pod名 |jq .bootstrap.statsConfig
配置
默认定义在MeshConfig.defaultConfig配置段。每个pod中sidecar需要用注解配置
全局级别
注:全局的配置需要重启sidecar,已经运行的不会生效,新运行的才生效
apiVersion: install.istio.io/v1alpha1
kind: IstioOperator
spec:
  profile: demo
  meshConfig:
    defaultConfig:
      proxyStatsMatcher:
        inclusionPrefixes: [str]      #使用前缀匹配开启的的指标键
        - 'upstream_rq_retry'		#
        inclusionSuffixes: [str]      #使用后缀匹配开启的指标键
        inclusionRegexps: [str]       #使用正则匹配开启的指标键
        - '.*circuit_breakers.*'	#网格级别启用断路器、重试、上游连接信息统计
pod级别
...
metadata:
  annotations:
    proxyStatsMatcher:
      inclusionRegexps:
      - '.*circuit_breakers.*'
      inclusionPrefixes:
      - 'upstream_rq_retry'
      - 'upstream_cx'
服务级指标
用于监控服务通信,属于数据平面指标,包括延迟、流量、错误、饱和度。指标有各envoy实例的WASM插件提供(stats、stackdriver)
使用被动模式,普罗米修斯抓取则生成,而且每次只会收集最小的数据集合,避免存储压力
实现方式
借助于特定extension插件植入到envoy
加载方式:
- 静态预编译:使用c++编写filter,集成到envoy源码,更新时重新编译envoy
- 动态加载:基于wasm动态加载filter,完成envoy扩展
插件:
metadata-exchange:
提供连接双方的元数据(client/server)
http流量使用自定义标头:
- envoy.wasm.matadata_exchange.upstream
- envoy.wasm.metadata_exchange.downstream
tcp流量基于ALPN隧道、基于前缀的协议,istio-peer-exchange
stats
负责将传入和传出的流量指标记录到envoy统计,并给普罗米修斯抓取
指标:
源码中,对指标并没有加istio_前缀,这个前缀是通过envoyfilter中的配置加上的,所以当需要重新打标时,匹配的指标名为无istio_前缀的
http、http2和grpc指标:
- istio_requests_total 处理的总请求数,计数器类型
- istio_request_duration_milliseconds 请求持续时长,直方图类型
- istio_request_bytes 请求体大小,直方图类型
- istio_response_bytes 响应体大小,直方图类型
- istio_request_messages_total grpc连接,请求消息总数
- istio_response_messages_total grpc连接,响应消息总数
tcp指标:
- istio_tcp_send_bytes_total tcp连接中总共发送的字节数,计数器类型
- istio_tcp_received_bytes_total tcp连接中总接收字节数,计数器类型
- istio_tcp_connections_opened_total 总打开的tcp连接数,计数器类型
- istio_tcp_connections_closed_total 总关闭的tcp连接数,计数器类型
指标标识方式
指标名称、维度(标签)、通信连接属性(标签值)三者结合使用
在同1个指标上,使用不同的维度,即代表不同的时间序列
维度中的各个标签值,来自通信双方报文或连接的指标值
通信双方:
- server端:请求流量中的入站方(inbound)
- client端:请求流量中出站方(outbound)
istio默认使用的标签:
- report:指标reporter的身份标识
- 服务端是sidecar envoy时为destination
- 客户端是sidecar envoy或ingress gateway时,为source
- source workload:源工作负载标识,缺少信息时为:unknown
- source workload namespace:源工作负载的命名空间,无信息为unknown
- source principal:源工作负载的身份标识,通常为spiffie id
- source app:源程序名,值为工作负载上的app标签值,无则显示unknown
- source version:源程序版本,值为工作负载上version标签值,无则为unknown
- destination workload:目标工作负载的标识,无则为unknown
- destination workload namespace
- destination principal
- destination app
- destination version
- destination service:请求报文中的目标svc全称
- destination service name:目标svc简称
- destination service namespace:目标服务的命名空间
- request protocol:请求协议
- response code
- connection security policy:请求中使用的认证策略。由itsio负责,reporter为:
- destation时,标识为mutial_tls(双向tls)
- 为source时,则因无法正确识别标识为unknown
- response flags:响应标志,值为envoy访问日志中的"%RESPONSE_FLAGS%"
- canonical service:workload可能属于多个服务,但1个workload只能属于1个规范服务,所以指标上会基于服务名称和版本生成标签:
- source_canonical_service、source_canonical_revision
- destination_canonical_service、destination_canonical_revision
- destination cluster:目标workload所在的集群
- source cluster:源工作负载集群
查看
istioctl pc bootstrap admin |jq .bootstrap.statsConfig
配置
在首次部署istio时,使用EnvoyFilter资源定义,envoyfilter定义在默认命名空间(istio-system)
只能配置全局模式
注:出于性能考虑,wasm插件是直接编译进envoy中,istio也提供了独立的stats wasm插件,要使用独立插件,可以在安装istio时指定:
istioctl install -s value.telemetry.v2.prometheus.wasmEnabled=true
配置属性
配置服务级指标时,各指标的标签值通常要引用自连接的属性,这些属性是内置的
tcp属性:
由metadata-exchange扩展提供tcp连接的有关属性
- name pod名称
- namespace pod的ns
- labels workload的标签
- owner workload的属主
- workload_name 工作负载名
- platform_metadata 系统平台
- istio_version istio版本
- mesh_id 网格标识
- cluster_id 工作负载所在的集群标识
- app_containers 应用容器的名称
http属性
- request.path URL的路径
- request.url_path 不包含查询参数的url路径
- request.host 请求主机
- request.scheme 协议
- request.method
- request.headers:请求标头,小写格式
- request.referer referer标头
- request.useragent ua标头
- request.time 接收到第一个字节的时间
- request.id x-request-id标头中的请求标识
- request.protocol 请求协议
全局配置
istioctl install -f 清单
apiVersion: install.istio.io/v1alpha1
kind: IstioOperator
spec:
#  meshConfig:
#    defaultConfig:
#      extraStatTags:
#      - request_method
#      - request_host
  profile: demo
  values:
    telemetry:
      v2:
        prometheus:
          configOverride:
            inboundSidecar:		#入站sidecar envoy配置
              metrics:
              - name: request_total		#在request_total指标上做标签修改
                dimensions:			#新增标签
                  request_host: request.host
                  request_method: request.method
                tags_to_remove:		#删除标签
                - request_protocol
            outboundSidecar:	#出站sidecar envoy配置
              metrics:
              - name: requests_total	#在request_total指标上做标签修改
                dimensions:
                  request_host: request.host
                  request_method: request.method
                tags_to_remove:
                - request_protocol
            gateway:		#网关envoy配置
              metrics:
              - name: requests_total
                dimensions:
                  request_host: request.host
                  request_method: request.method
                tags_to_remove:
                - request_protocol
命名空间配置
apiVersion: telemetry.istio.io/v1alpha1
kind: Telemetry
metadata:
  name: namespace-metrics
  namespace: default
spec:
  metrics:
  - providers:
    - name: prometheus
    overrides:
    - tagOverrides:		#为所有指标添加2个标签
        request_method:
          value: "request.method"
        request_host:
          value: "request.host"
pod配置
kind: Deployment
spec:
  template:
    metadata:
      annotations:
        sidecar.istio.io/extraStatTags: request_method,request_host
控制平面指标
由istiod负载暴露,端口:15014/tcp
监控istiod自身状况
文档:https://istio.io/latest/zh/docs/reference/commands/pilot-discovery/#metrics
指标组
- citadel
- galley
- pilot
- istiod
- process
- webhook
日志
主要由数据平面的envoy生成
访问日志数据可以保存在后端存储系统中(sink),目前支持的sink:
- 文件:异步io架构,不会阻塞主线程
- grpc
- stdout
- stderr
配置
istiooperator资源:
用meshconfig配置
meshConfig:
  accessLogFile: /dev/stdout        #空为禁用
  accessLogFormat: ''               #空为默认
  accessLogEncoding: TEXT           #默认TEXT编码,支持JSON
telemetry资源:
更细粒度的控制
kind: Telemetry
spec:
  accessLogging:
  - {}
链路追踪
istio通过envoy做链路追踪,被代理的应用在内部只用转发span上下文即可,如envoy使用skywalking,业务代码中也要传递skywalking上下文
链路追踪机制参考envoy的跟踪机制
注:启用链路追踪时,必须先用IstioOperator,在全局定义一个用于追踪的providers,然后在全局、命名空间、pod级别中引用它
配置
opetator
全局
spec:
  meshConfig:
    anableTracing: true
    defaultConfig:
      tracing:
        sampling: 100.0           #采样率,0.0到100.0,默认100%,一定要修改小点,可能集群过大时数据体量非常大
        max_path_tag_length: 256  #路径标签最大长度
pod
kind: Deployment
  ...
    metadata:
      annotations:
        proxy.istio.io/config: |
          tracing:
            sampling: 10
            ...
telemetry
全局
kind: Telemetry
metadata:
  namespace: istio-system
spec:
  tracing:
  - providers:
    - name: localtrace
    customTags:
      foo:
        literal:
          value: bar
命名空间
kind: Telemetry
metadata:
  namespace: 自定义命名空间
spec:
  tracing:
  - customTags:
      foo:
        literal:
          value: bar
pod
kind: Telemetry
metadata:
  namespace: 自定义命名空间
spec:
  selector:
    matchLabels:
      service.istio.io/canonical-name: ft
  tracing:
  - disableSpanReporting: true
配置
istiooperators配置
meshconfig内置配置段定义,或使用istioctl install打补丁
全局生效
apiVersion: install.istio.io/v1alpha1
kind: IstioOperator
spec:
  meshConfig:
    enabledTracing: true          #启用追踪
    accessLogFile: /dev/stdout    #启用日志
    defaultConfig:
      tracing: {}               #在代理上的追踪机制
      proxyStatsMatcher: {}            #stats插件提供的指标
pod注解配置
pod级别生效
kind: Deployment
spec:
  ...
  template:
  metadata:
    ...
    annotations:
      proxy.istio.io/config: |
        tracing: {}
        proxyStatsMatcher: {}
telemetries配置
生效范围:
- 为根命名空间(istio-system)配置
- 为指定命名空间配置
- 为指定pod配置
语法
kubectl explain telemetries
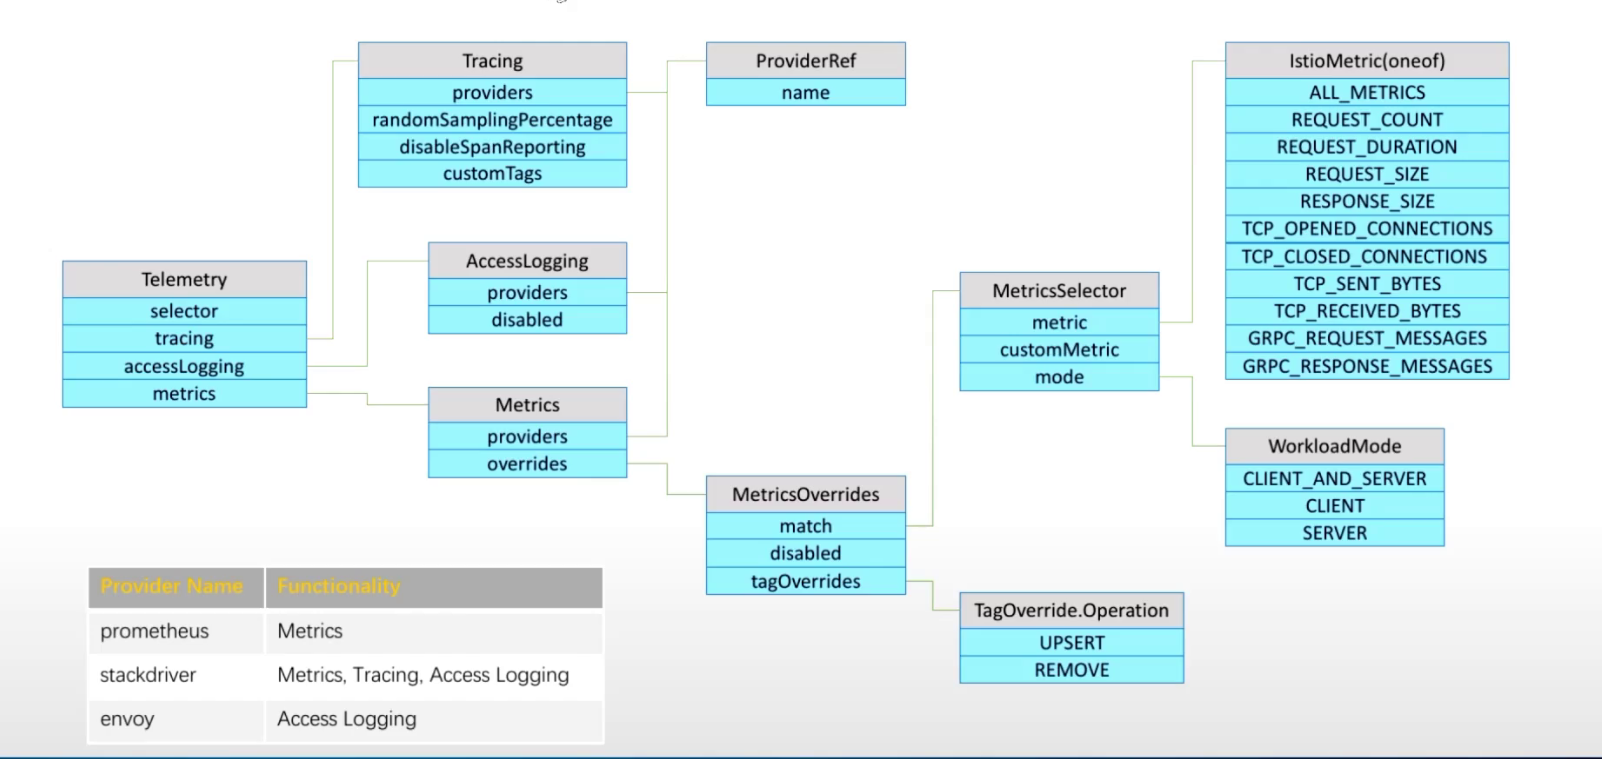
apiVersion: telemetry.istio.io/v1alpha1
kind: Telemetry
metadata:
  namespace: 自定义命名空间
spec:
  accessLogging:        #日志相关
  - disabled: str
    filter:
      expression: str
    match:
      mode: str
    providers:
    - name: str
        #stackdrive
        #envoy
  metrics:              #指标相关
  - overrides:          #重新打标、自定义标签
    - disabled: str     #匹配后禁用指标
      match:            #匹配指标
        customMetric: str       #自定义指标,可能需要二次开发envoy
        metric: str             #匹配内置的指标,属于服务级指标(istiod)
          #ALL_METRICS,所有指标
          #REQUEST_COUNT
          #REQUEST_DURATION,请求延迟
          #REQUEST_SIZE
          #RESPONE_SIZE
          #TCP_OPENED_CONNECTIONS
          #TCP_CLOSED_CONNECTIONS
          #TCP_SEND_BYTES
          #TCP_RECEVIED_BYTES
          #GRPC_REQUEST_MESSAGES
          #GRPC_RESPONSE_MESSAGES
        mode: str       #指标收集模式,从哪个视角采集数据,客户端可能包含向多个服务端请求;而服务端可能接受多个客户端的请求
          #CLIENT_AND_SERVER,客户端和服务端都采集
          #CLIENT,以客户端视角采集
          #SERVER,以服务端视角采集
      tagOverrides:     #标签覆盖
        upsert: str     #插入
        remove: str     #删除
    providers:          #指定数据接收服务,providers需要在istio operator api中提前定义(meshconfig中)
    - name: str      #使用内置定义好的providers,使用其他的需要提前在meshconfig中定义,然后在此处定义
        #prometheus
        #stackdrive
    reportingInterval: str
  tracing:            #追踪相关
  - customTags:
    disableSpanReporting: str
    match:
      mode: str
    providers:
    - name: str
        #stackdrive
    randomSamplingPercentage: int
    useRequestIdForTraceSampling: str
  selector:               #选择生效pod,不定义,或定义在根命名空间中,表示所有都生效
    matchLabels: {}
案例
参考发布在稀土掘金的部分吧,只写了配置skywalking,其他的参考官方文档:istio配置skywalking

 浙公网安备 33010602011771号