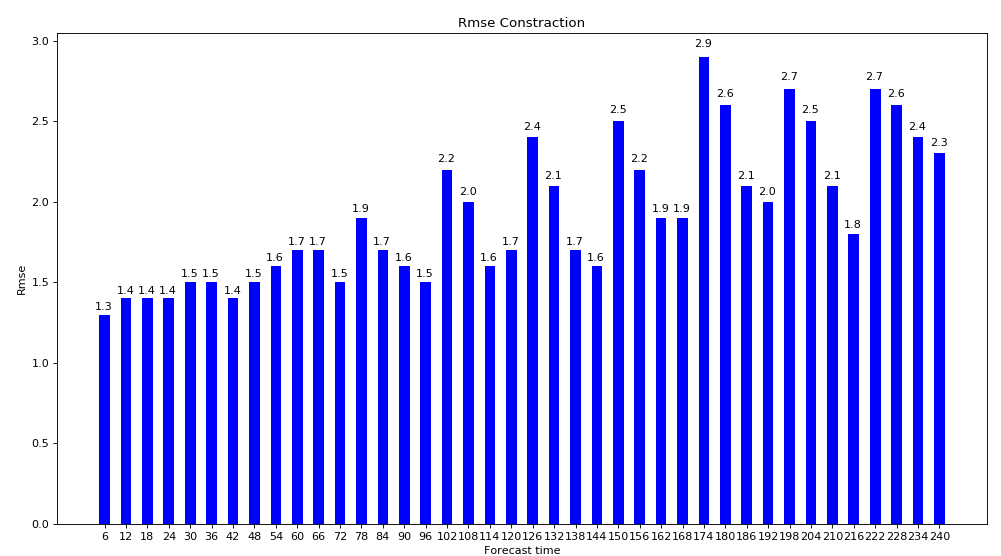
 1 #!usr/bin/env python
 2 # -*- coding: utf-8 -*-
 3 import os
 4 import numpy as np
 5 import pandas as pd
 6 import matplotlib.pyplot as plt
 7
 8 base_dir = 'd:/Pattern/'
 9 input_base_dir = base_dir + 'data_graph_save/'
10 rmse_list = []
11 xlabel_list = [str(x) for x in range(6, 241, 6)]
12 xlabel = tuple(xlabel_list)
13 print(xlabel)
14 for i in range(6, 241, 6):
15     fileName = input_base_dir + 'output_' + str(i) + '.csv'
16     print(fileName)
17     data = pd.read_csv(fileName)
18     n_data = data.shape[0]
19     data_true = data.iloc[:, 6]
20     data_predict = data.iloc[:, 7]
21
22     rmse_predict = np.sqrt(np.array(np.square(data_predict - data_true)).sum() / n_data)
23     rmse_list.append(rmse_predict)
24
25 rmse_array = np.array(rmse_list).round(1)
26 print(rmse_array)
27
28 plt.figure(figsize=(15, 8), dpi=80)
29 ax = plt.subplot(1, 1, 1)
30
31 # plt.hist(pd.Series(rmse_array), bins=rmse_array.shape)
32 width = 0.5
33 x_bar = np.arange(len(xlabel_list))
34 rect1 = ax.bar(left=x_bar, height=rmse_array, width=width, color="blue")
35
36 for rec in rect1:
37     x = rec.get_x()
38     height = rec.get_height()
39     ax.text(x-0.2, 1.02*height, str(height))
40
41 ax.set_xticks(x_bar)
42 ax.set_xticklabels(xlabel)
43
44 plt.title('Rmse Constraction')
45 plt.xlabel('Forecast time')
46 plt.ylabel('Rmse')
47 plt.savefig('Rmse_tmp.png')
48 plt.show()
结果