ELK之十二----Nginx日志写入到数据库中及显示IP地址城市
一、logstash结合filebeat收集日志写入到数据库中
框架图
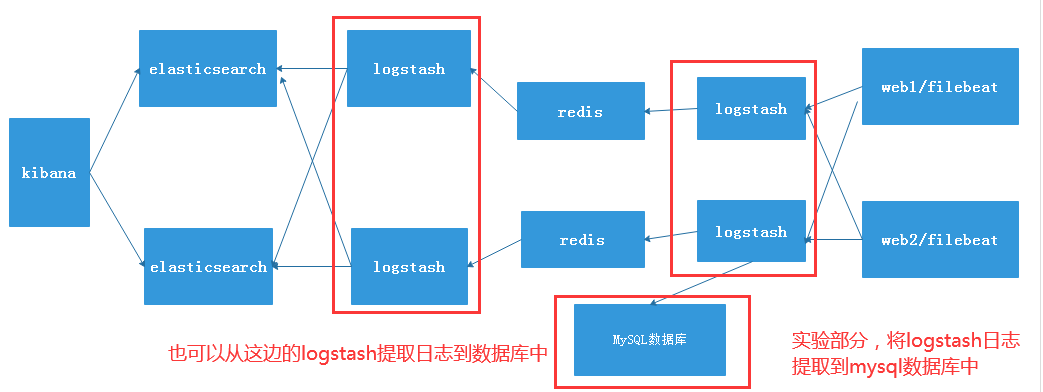
原理:由于部分重要日志需要按照开发的要求将日志存储到数据库中,也是个比较重点以及难点的问题,此实验是在ELK之十的基础上进行搭建的,需要将ELK之十搭建完成才能搭建此环境:ELK之十链接:https://www.cnblogs.com/struggle-1216/p/12502928.html
1、安装mariadb-server数据库
1、安装数据库并启动
# yum install mariadb-server  -y
# systemctl start mariadb
2、创建一个数据库并授权
[root@filebeat-1 ~]# mysql
Welcome to the MariaDB monitor.  Commands end with ; or \g.
Your MariaDB connection id is 3
Server version: 5.5.64-MariaDB MariaDB Server

Copyright (c) 2000, 2018, Oracle, MariaDB Corporation Ab and others.

Type 'help;' or '\h' for help. Type '\c' to clear the current input statement.

MariaDB [(none)]> create database elk character set utf8 collate utf8_bin;
Query OK, 1 row affected (0.00 sec)

MariaDB [(none)]> grant all privileges on elk.* to elk@"192.168.7.%" identified by '123456';
Query OK, 0 rows affected (0.00 sec)

MariaDB [(none)]>
3、在另一台mysql客户端主机进行测试连接
[root@logstash-1 conf.d]# mysql -uelk -p123456 -h192.168.7.105
Welcome to the MariaDB monitor.  Commands end with ; or \g.
Your MariaDB connection id is 4
Server version: 5.5.64-MariaDB MariaDB Server

Copyright (c) 2000, 2018, Oracle, MariaDB Corporation Ab and others.

Type 'help;' or '\h' for help. Type '\c' to clear the current input statement.

MariaDB [(none)]>
2、在logstash主机上安装jdbc插件
1、安装logstash-output-jdbc插件
[root@logstash-1 conf.d]# logstash-plugin install logstash-output-jdbc
2、在官网下载jar包
MySQL Connector/J是MySQL官方JDBC驱动程序JDBC(Java Data Base Connectivity,java数据库连接)是一种用于执行SQL语句的Java API,可以为多种关系数据库提供统一访问,它由一组用Java语言编写的类和接口组成。
官方下载地址:https://dev.mysql.com/downloads/
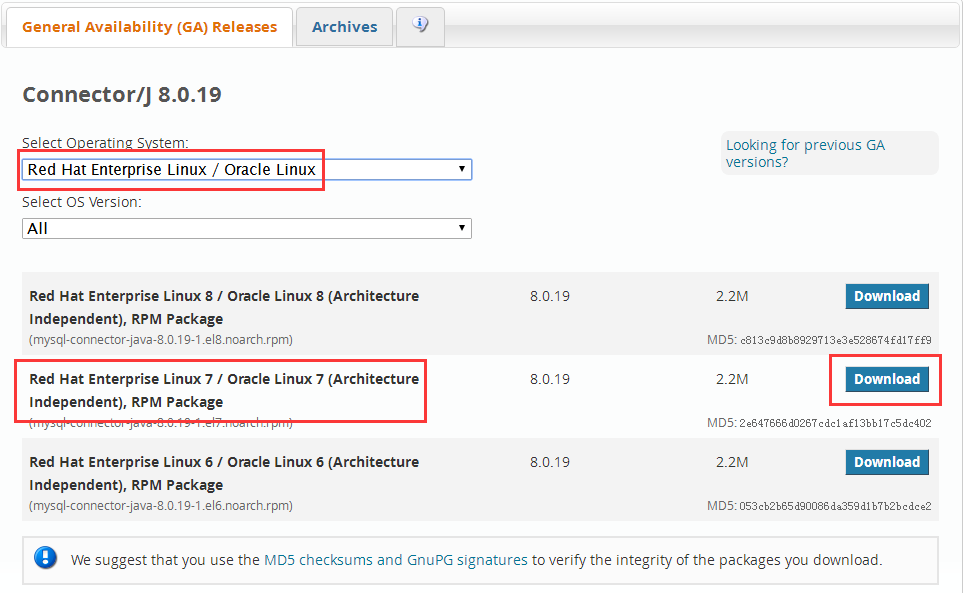
下载对应系统版本的包:mysql-connector-java-8.0.19-1.el7.noarch
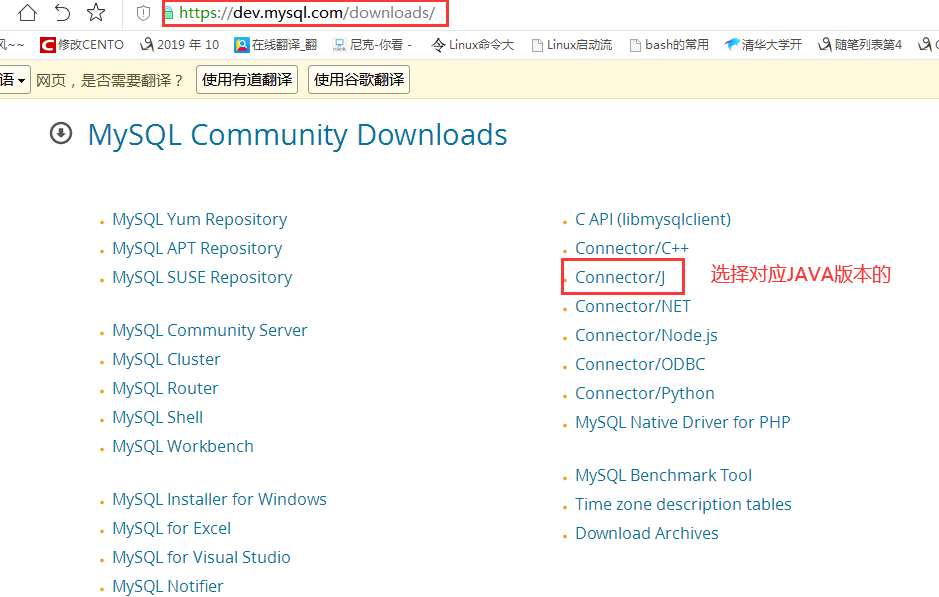
选择对应版本的包进行下载
3、创建一个存放jar包的目录,将下载的包进行安装,并将生成的jar复制到指定创建的目录下。
[root@logstash-1 jdbc]# yum install mysql-connector-java-8.0.19-1.el7.noarch.rpm -y
[root@logstash-1 ~]# mkdir /usr/share/logstash/vendor/jar/jdbc -p
[root@logstash-1 ~]# cd /usr/share/logstash/vendor/jar/jdbc
[root@logstash-1 jdbc]# ll /usr/share/java/mysql-connector-java.jar
-rw-r--r-- 1 root root 2348827 Dec  4 20:06 /usr/share/java/mysql-connector-java.jar  # 将此jar包存在上面创建的目录下
[root@logstash-1 jdbc]# cp /usr/share/java/mysql-connector-java.jar /usr/share/logstash/vendor/jar/jdbc/
4、重启logstash服务,要保证此时的logstash服务要能够启动
[root@logstash-1 jdbc]# systemctl restart logstash
[root@logstash-1 jdbc]# tail -f /var/log/logstash/logstash-plain.log
[2020-03-16T14:48:43,692][INFO ][logstash.agent           ] Successfully started Logstash API endpoint {:port=>9600} # 此时的logstash已经启动
[root@logstash-1 jdbc]# logstash-plugin  list | grep logstash-output-jdbc  # 查看此时的输出插件是否存在
logstash-output-jdbc
3、在mariadb数据库创建收集日志表
1、在数据库中创建一个收集日志的elklog表
[root@filebeat-1 ~]# mysql
Welcome to the MariaDB monitor.  Commands end with ; or \g.
Your MariaDB connection id is 13
Server version: 5.5.64-MariaDB MariaDB Server

Copyright (c) 2000, 2018, Oracle, MariaDB Corporation Ab and others.

Type 'help;' or '\h' for help. Type '\c' to clear the current input statement.

MariaDB [(none)]> use elk;
Reading table information for completion of table and column names
You can turn off this feature to get a quicker startup with -A

Database changed
MariaDB [elk]> create table elklog (clientip varchar(64),responsetime varchar(16),http_host varchar(64),http_user_agent varchar(256),url varchar(128),time timestamp(0)); # 创建收集日志的elklog表,需要定义字段名称
4、在logstash服务器上将nginx日志传递到数据库中
1、在logstash服务器的/etc/logstash/conf.d目录下创建一个收集nginx日志的配置文件
[root@logstash-1 conf.d]# cat  filebeat-to-logstash.conf
input {
  beats {
    host => "192.168.7.101"
    port => 5044
    codec => "json"
  }
}


output {
  if [fields][app] == "syslog" {
  redis {
       host => "192.168.7.104"
       port => "6379"
       db => "0"
       data_type => "list"
       password => "123456"
       key =>  "filebeat-syslog-7-103"
       codec => "json"
  }}

  if [fields][app] == "nginx" {
  redis {
       host => "192.168.7.104"
       port => "6379"
       db => "0"
       data_type => "list"
       password => "123456"
       key =>  "filebeat-nginx-log-7-103"
       codec => "json"
  }
   jdbc { # 使用mysql模块将日志传递到数据库中
   connection_string => "jdbc:mysql://192.168.7.105/elk?user=elk&password=123456&useUnicode=true&characterEncoding=UTF8" # IP地址为数据库地址
   statement => ["INSERT INTO elklog(clientip,responsetime,http_host,http_user_agent,url,status) VALUES(?,?,?,?,?,?)", "clientip","responsetime","http_host","http_user_agent","url","status"]  # 定义字段时,与上面创建elklog对应,?为有几个字段就写几个
  }}
}
2、重启logstash服务
# systemctl restart logstash
5、在数据库中查看收集到的nginx日志
MariaDB [elk]> select * from elklog\G;
*************************** 1. row ***************************
       clientip: 192.168.7.1
   responsetime: 0.0
      http_host: 192.168.7.103
http_user_agent: Mozilla/5.0 (Windows NT 6.1; WOW64) AppleWebKit/537.36 (KHTML, like Gecko) Chrome/78.0.3904.108 Safari/537.36
            url: /index.html
         status: 304
           time: 2020-03-16 16:34:05
*************************** 2. row ***************************
       clientip: 192.168.7.1
   responsetime: 0.0
      http_host: 192.168.7.103
http_user_agent: Mozilla/5.0 (Windows NT 6.1; WOW64) AppleWebKit/537.36 (KHTML, like Gecko) Chrome/78.0.3904.108 Safari/537.36
            url: /index.html
         status: 304
           time: 2020-03-16 16:34:05
*************************** 3. row ***************************
       clientip: 192.168.7.1
   responsetime: 0.0
      http_host: 192.168.7.103
http_user_agent: Mozilla/5.0 (Windows NT 6.1; WOW64) AppleWebKit/537.36 (KHTML, like Gecko) Chrome/78.0.3904.108 Safari/537.36
            url: /index.html
         status: 304
           time: 2020-03-16 16:34:05
*************************** 4. row ***************************
       clientip: 192.168.7.1
   responsetime: 0.0
      http_host: 192.168.7.103
http_user_agent: Mozilla/5.0 (Windows NT 6.1; WOW64) AppleWebKit/537.36 (KHTML, like Gecko) Chrome/78.0.3904.108 Safari/537.36
            url: /index.html
         status: 304
           time: 2020-03-16 16:34:05
*************************** 5. row ***************************
       clientip: 192.168.7.1
   responsetime: 0.0
      http_host: 192.168.7.103
http_user_agent: Mozilla/5.0 (Windows NT 6.1; WOW64) AppleWebKit/537.36 (KHTML, like Gecko) Chrome/78.0.3904.108 Safari/537.36
            url: /index.html
         status: 304
           time: 2020-03-16 16:34:05
*************************** 6. row ***************************
       clientip: 192.168.7.1
   responsetime: 0.0
      http_host: 192.168.7.103
http_user_agent: Mozilla/5.0 (Windows NT 6.1; WOW64) AppleWebKit/537.36 (KHTML, like Gecko) Chrome/78.0.3904.108 Safari/537.36
            url: /index.html
         status: 304
           time: 2020-03-16 16:34:05
*************************** 7. row ***************************
       clientip: 192.168.7.1
   responsetime: 0.0
      http_host: 192.168.7.103
http_user_agent: Mozilla/5.0 (Windows NT 6.1; WOW64) AppleWebKit/537.36 (KHTML, like Gecko) Chrome/78.0.3904.108 Safari/537.36
            url: /index.html
         status: 304
           time: 2020-03-16 16:34:05
*************************** 8. row ***************************
       clientip: 192.168.7.1
   responsetime: 0.0
      http_host: 192.168.7.103
http_user_agent: Mozilla/5.0 (Windows NT 6.1; WOW64) AppleWebKit/537.36 (KHTML, like Gecko) Chrome/78.0.3904.108 Safari/537.36
            url: /index.html
         status: 304
           time: 2020-03-16 16:34:05
二、通过地图统计客户IP地址所在城市
1、下载官网地图
地图官方下载地址:https://dev.maxmind.com/geoip/geoip2/geolite2/
1、下载官网的地图软件,并将软件存放到/etc/logstash目录下,对压缩包文件进行解压
[root@logstash logstash]# pwd
/etc/logstash
[root@logstash logstash]# tar xvf GeoLite2-City_20190723.tar.gz
[root@logstash logstash]# ll GeoLite2-City_20190723/GeoLite2-City.mmdb
-rw-r--r-- 1 root root 61762964 Jul 23  2019 GeoLite2-City_20190723/GeoLite2-City.mmdb # 此配置文件是我们需要引用
2、配置logstash主机配置文件,将日志传递到elasticsearch主机
1、修改Logstash的/etc/logstash/conf.d目录下的配置文件,加入一个加载地址地图的模块
[root@logstash conf.d]# cat logstash-to-es.conf
input {
   redis {
     host => "192.168.7.104"
     port => "6379"
     db => "0"
     password => "123456"
     data_type => "list"
     key => "filebeat-syslog-7-103"
     codec => "json"
   }
   redis {
     host => "192.168.7.104"
     port => "6379"
     db => "0"
     password => "123456"
     data_type => "list"
     key => "filebeat-nginx-log-7-103"
     codec => "json"
   }
}

   filter {
        if [fields][app] == "nginx"  {  # 使用nginx服务的类型进行判断
        geoip {
                source => "clientip"
                target => "geoip"
                database => "/etc/logstash/GeoLite2-City_20190723/GeoLite2-City.mmdb"  # 修改指定的地址位置
                add_field => [ "[geoip][coordinates]", "%{[geoip][longitude]}" ]
                add_field => [ "[geoip][coordinates]", "%{[geoip][latitude]}"  ]
        }
    mutate {
      convert => [ "[geoip][coordinates]", "float"]
	}
  }
}


output {
  if [fields][app] == "syslog" {
    elasticsearch {
      hosts => ["192.168.7.100:9200"]
      index => "logstash-syslog-7-103-%{+YYYY.MM.dd}"
    }}

  if [fields][app] == "nginx" {
    elasticsearch {
      hosts => ["192.168.7.100:9200"]
      index => "logstash-nginx-accesslog-7-103-%{+YYYY.MM.dd}"
    }}
}
2、测试Logstash配置文件
[root@logstash conf.d]# logstash -f logstash-to-es.conf -t
WARNING: Could not find logstash.yml which is typically located in $LS_HOME/config or /etc/logstash. You can specify the path using --path.settings. Continuing using the defaults
Could not find log4j2 configuration at path /usr/share/logstash/config/log4j2.properties. Using default config which logs errors to the console
[WARN ] 2020-03-16 19:09:09.448 [LogStash::Runner] multilocal - Ignoring the 'pipelines.yml' file because modules or command line options are specified
Configuration OK # 显示OK,说明配置文件没问题
3、重启Logstash服务
# systemctl restart logstash
3、在nginx服务器上进行测试
1、在nginx服务器上导入部分log。
[root@filebate src]# tail -n1000 access.log >> /var/log/nginx/access.log
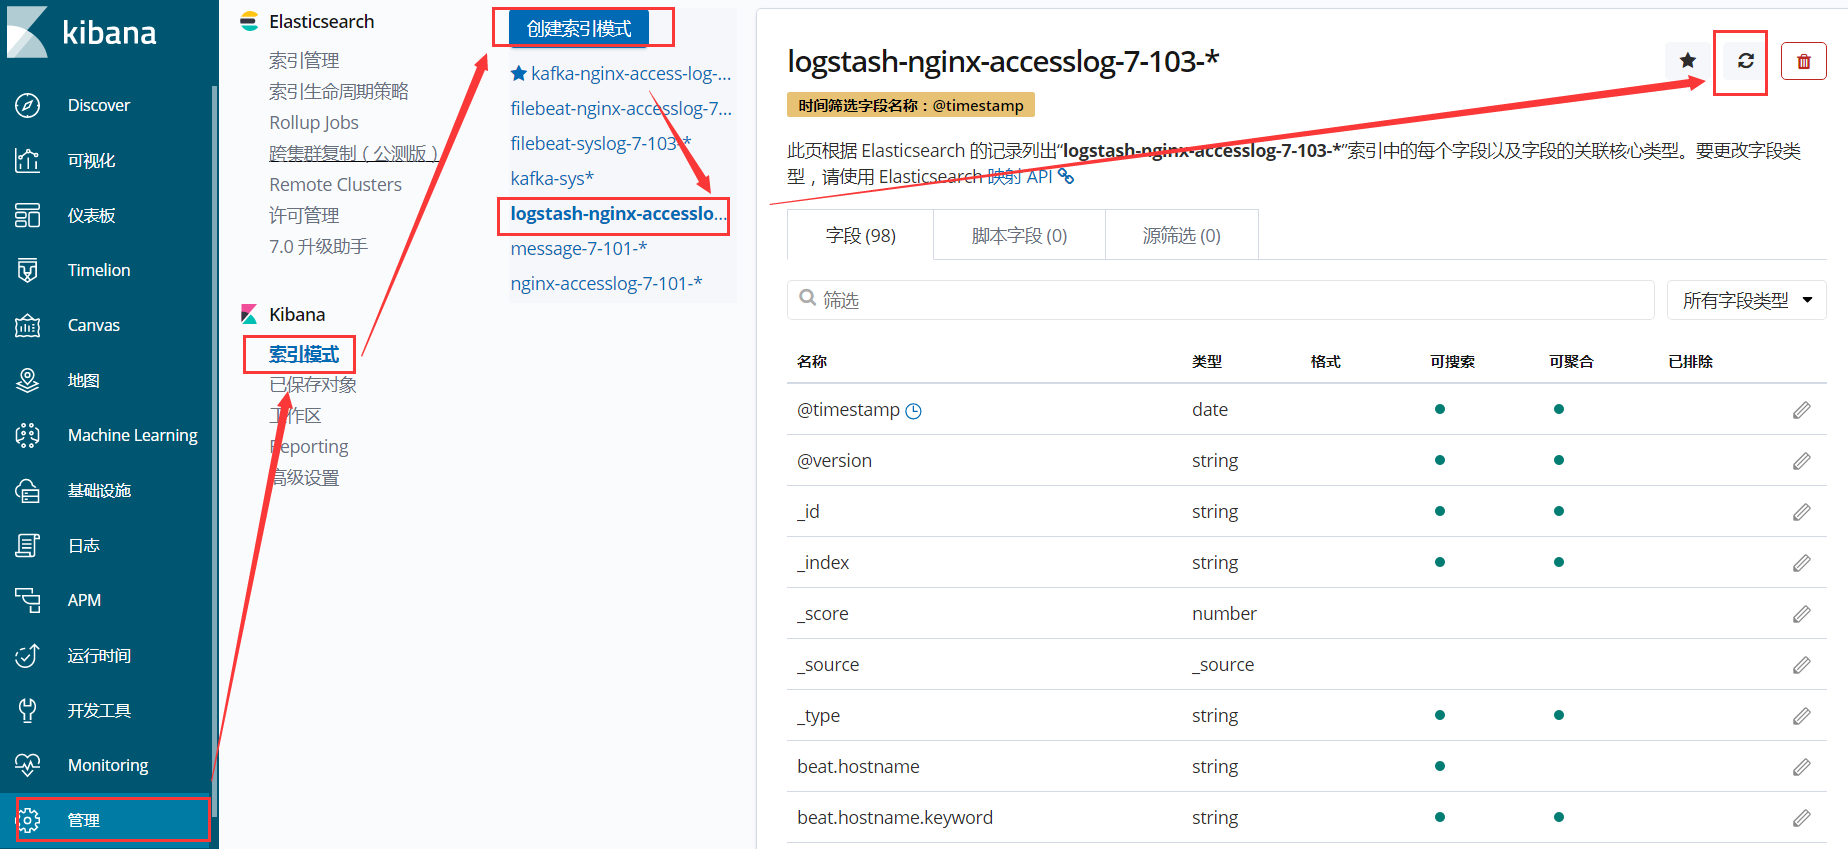
2、在kibana刷新一下之前生成的索引文件信息,就会加载最新的索引信息
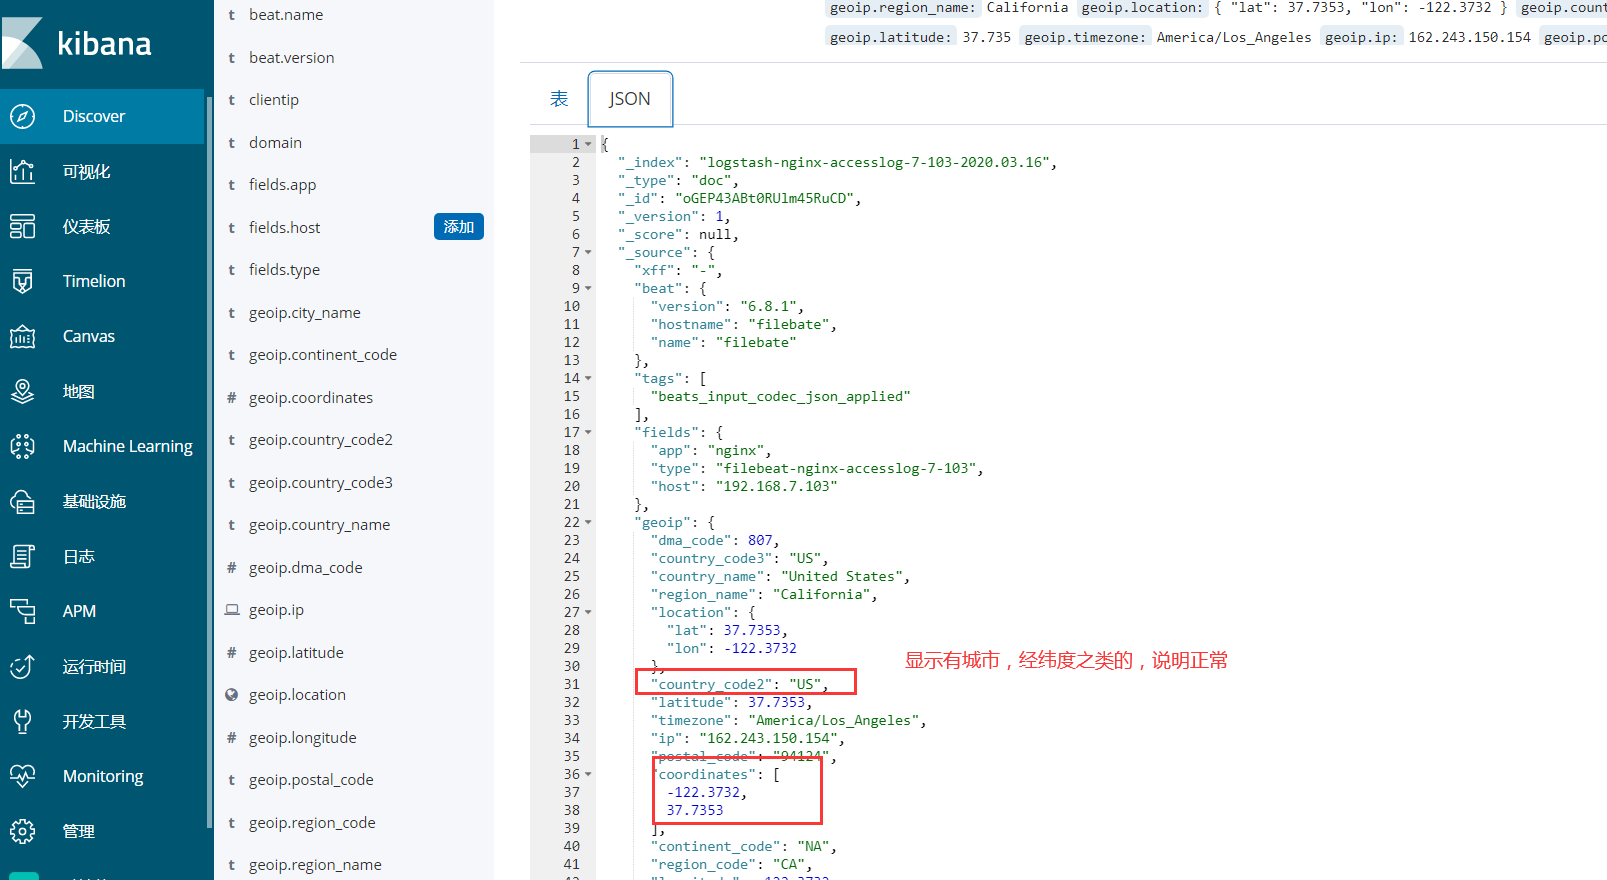
4、discover查看日志状态
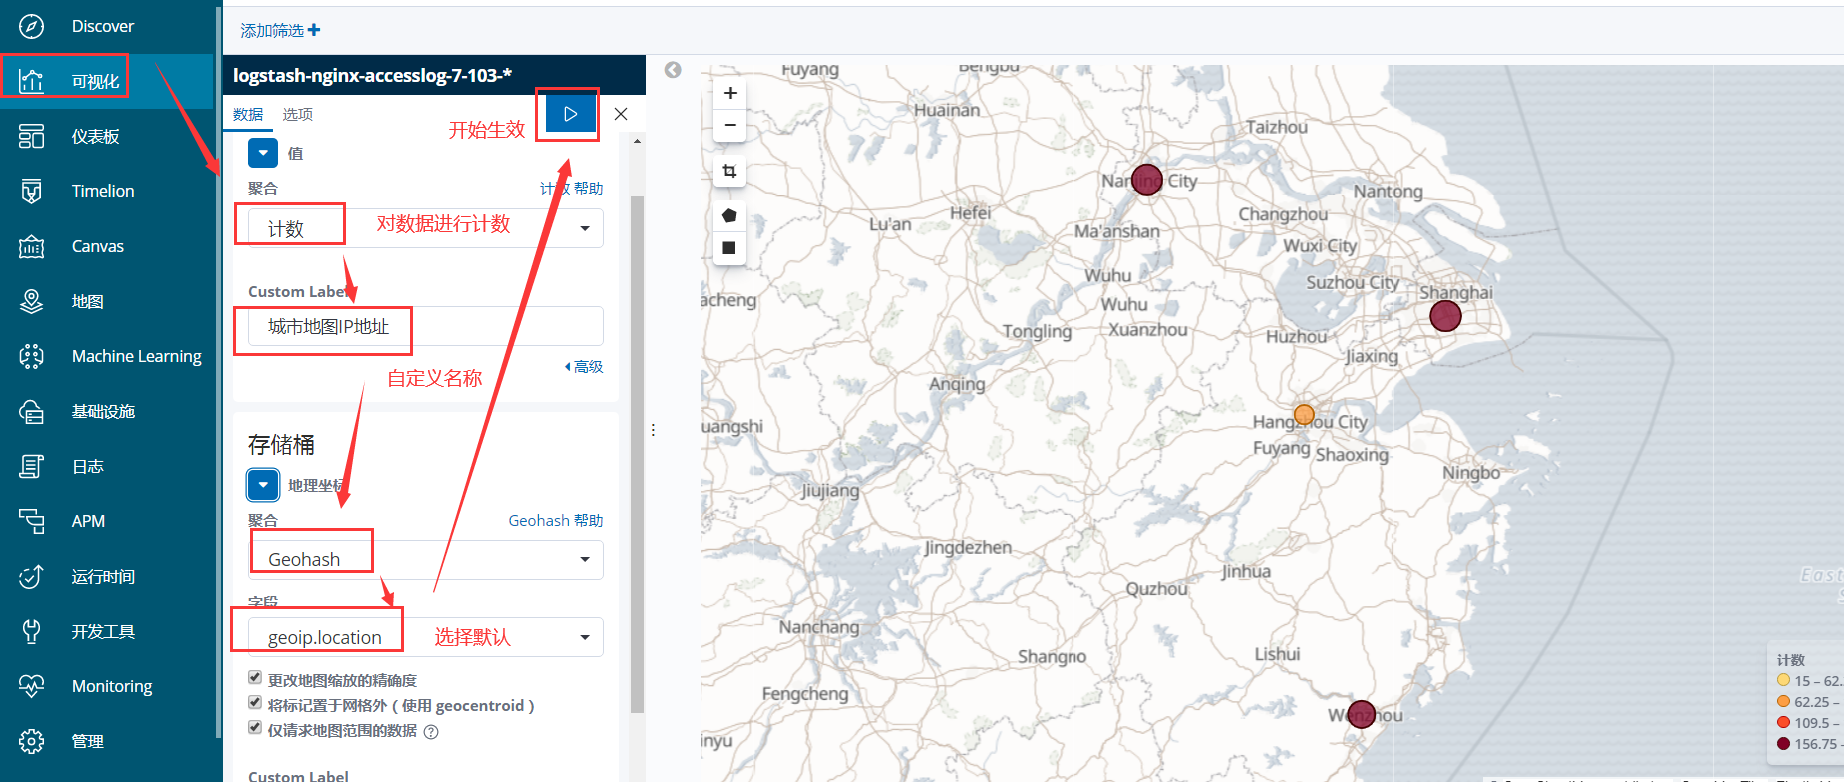
5、在可视化进行创建地图,并保存

 浙公网安备 33010602011771号