最小二乘法的直线拟合
由于网上没有找到直接的代码,就来写一下。
原理部分可以回去看高数,核心就是以直线的斜率和截距为变量,让误差最小化。以下是代码部分
import numpy as np
import matplotlib.pyplot as plt

def linear_least_squares(q_list, n_list):
    """
    最小二乘法直线拟合

    参数:
    q_list: x坐标数据列表
    n_list: y坐标数据列表

    返回:
    slope: 直线斜率
    intercept: 直线截距
    fig: 图像对象
    """

    # 将列表转换为numpy数组
    x = np.array(q_list)
    y = np.array(n_list)

    # 计算必要的数据和
    n = len(x)
    sum_x = np.sum(x)
    sum_y = np.sum(y)
    sum_xy = np.sum(x * y)
    sum_x2 = np.sum(x ** 2)

    # 计算斜率和截距
    slope = (n * sum_xy - sum_x * sum_y) / (n * sum_x2 - sum_x ** 2)
    intercept = (sum_y - slope * sum_x) / n

    # 计算拟合的y值
    y_fit = slope * x + intercept

    # 计算相关系数R²
    y_mean = np.mean(y)
    ss_tot = np.sum((y - y_mean) ** 2)
    ss_res = np.sum((y - y_fit) ** 2)
    r_squared = 1 - (ss_res / ss_tot)

    # 创建图像
    fig, ax = plt.subplots(figsize=(10, 6))

    # 绘制原始数据点
    ax.scatter(x, y, color='blue', label='original data', s=50, alpha=0.7)

    # 绘制拟合直线
    ax.plot(x, y_fit, color='red', linewidth=2, label=f'Fitted Line: y = {slope:.4f}x + {intercept:.4f}')

    # 设置图表属性
    ax.set_xlabel('q', fontsize=12)
    ax.set_ylabel('n', fontsize=12)
    ax.set_title('Least Squares Linear Fit', fontsize=14)
    ax.legend(fontsize=10)
    ax.grid(True, alpha=0.3)

    # 在图上显示参数
    textstr = f'Slope: {slope:.4f}\nIntercept: {intercept:.4f}\nR²: {r_squared:.4f}'
    ax.text(0.05, 0.95, textstr, transform=ax.transAxes, fontsize=10,
            verticalalignment='top', bbox=dict(boxstyle='round', facecolor='wheat', alpha=0.5))

    plt.tight_layout()

    return slope, intercept, fig


# 实例
q_list = [1, 2, 3, 4, 5, 6, 7, 8, 9, 10]
n_list = [2.1, 4.2, 5.8, 8.1, 9.9, 12.1, 13.8, 16.2, 17.9, 20.1]

# 调用拟合函数
slope, intercept, fig = linear_least_squares(q_list, n_list)

# 打印结果
print(f"直线方程: y = {slope:.4f}x + {intercept:.4f}")
print(f"斜率: {slope:.4f}")
print(f"截距: {intercept:.4f}")

# 显示图像
plt.show()
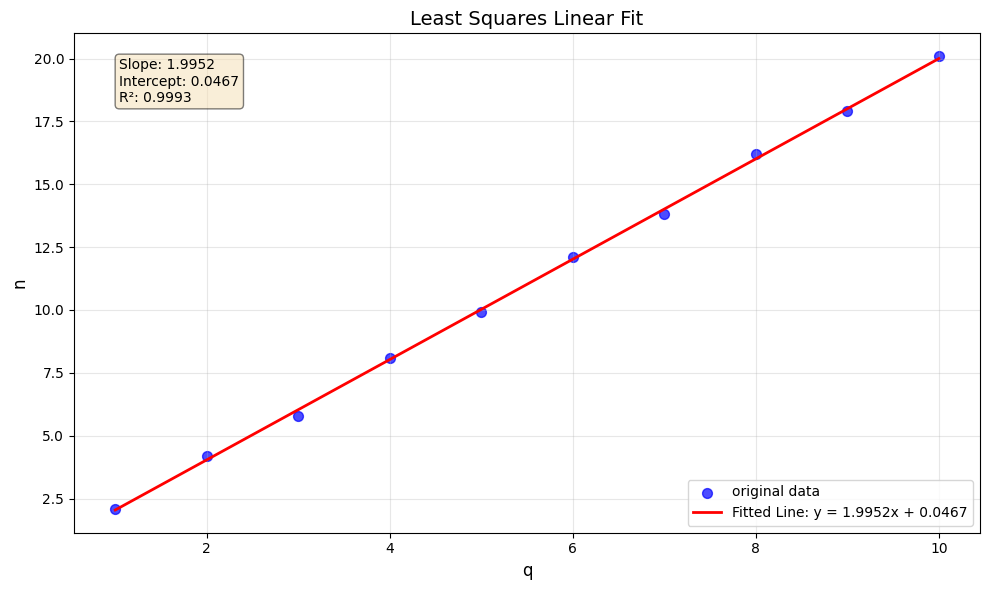
运行结果:
直线方程: y = 1.9952x + 0.0467
斜率: 1.9952
截距: 0.0467

 浙公网安备 33010602011771号