


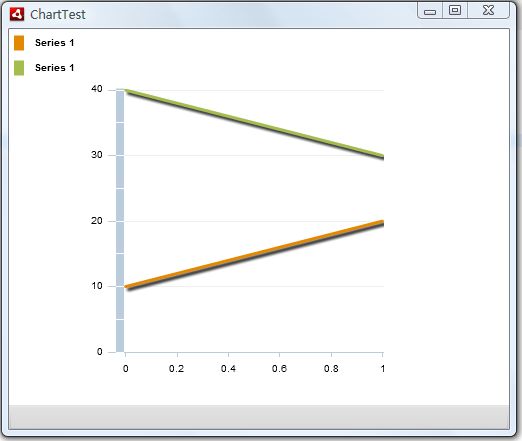
Line Chart 示例
效果如下图:
ChartTest.mxml 内容如下:
<?xml version="1.0" encoding="utf-8"?>
<s:WindowedApplication xmlns:fx="http://ns.adobe.com/mxml/2009"
xmlns:s="library://ns.adobe.com/flex/spark"
xmlns:mx="library://ns.adobe.com/flex/mx"
width="500" height="400">
<fx:Declarations>
<!-- 将非可视元素(例如服务、值对象)放在此处 -->
</fx:Declarations>
<mx:LineChart x="80" y="50" width="300" height="300" id="ctLine">
<mx:series>
<mx:LineSeries displayName="Series 1" yField="value1"/>
<mx:LineSeries displayName="Series 1" yField="value2"/>
</mx:series>
<mx:dataProvider>
<fx:XMLList xmlns="">
<stock>
<value1>10</value1>
<value2>40</value2>
</stock>
<stock>
<value1>20</value1>
<value2>30</value2>
</stock>
</fx:XMLList>
</mx:dataProvider>
</mx:LineChart>
<mx:Legend dataProvider="{ctLine}"/>
</s:WindowedApplication>
其中数据源 dataProvider 里的 XML 也可以在 fx:Script 区域内用 ActionScript 代码实现。

 浙公网安备 33010602011771号