
安装prometheus
1.安装go环境
#下载
wget -c https://storage.googleapis.com/golang/go1.8.3.linux-amd64.tar.gz

#解压
tar -zxvf go1.8.3.linux-amd64.tar.gz -C /usr/local/

#配置环境变量
vim /etc/profile

export PATH=$PATH:/usr/local/go/bin

source /etc/profile

#验证
go version
2.安装peometheus服务端
#下载
 wget -c https://github.com/prometheus/prometheus/releases/download/v2.24.1/prometheus-2.24.1.linux-amd64.tar.gz

#解压
tar -zxvf prometheus-2.24.1.linux-amd64.tar.gz -C /opt/

#启动
cd /opt/prometheus-2.24.1.linux-amd64/
nohup ./prometheus &

#开放防火墙端口
firewall-cmd --zone-public --add-port=9090/tcp
firewall-cmd --zone-public --add-port=9090/tcp --permanent

#访问
192.168.80.121:9090
3.以systemd服务启动peometheus
3.1创建用户
groupadd -r prometheus
useradd -r -g prometheus -s /sbin/nologin -M prometheus
chown -R prometheus:proemtheus /opt/prometheus-2.24.1.linux-amd64
chown -R prometheus:proemtheus /opt/prometheus-data
chown -R prometheus:prometheus /var/log/prometheus.log
3.2创建启动脚本
#!/bin/bash
/opt/prometheus-2.24.1.linux-amd64/prometheus --config.file=/opt/prometheus-2.24.1.linux-amd64/prometheus.yml --web.enable-lifecycle --storage.tsdb.path="/opt/prometheus-data" --storage.tsdb.retention=15d &>> /var/log/prometheus.log
3.3创建服务
vim /usr/lib/systemd/system/prometheus.service
[Unit]
Description=Prometheus
Documentation=https://prometheus.io/docs/introduction/overview/
Wants=network-online.target
After=network-online.target

[Service]
User=prometheus
Group=prometheus
# 启动脚本
ExecStart=/opt/prometheus-2.24.1.linux-amd64/prometheus.sh

[Install]
WantedBy=multi-user.target
3.4启动
systemctl enable prometheus
systemctl start prometheus
systemctl status prometheus
4.安装prometheus客户端
#以主机为例
#更多请参考
https://prometheus.io/download/
https://prometheus.io/docs/instrumenting/exporters/

#下载
wget -c https://github.com/prometheus/node_exporter/releases/download/v1.0.1/node_exporter-1.0.1.linux-amd64.tar.gz

#解压
tar -zxvf node_exporter-1.0.1.linux-amd64.tar.gz -C /opt/

#运行
nohup ./node_exporter &

#开放端口
firewall-cmd --zone=public --add-port=9100/tcp
firewall-cmd --zone=public --add-port=9100/tcp --permanent
4.1修改服务端配置文件
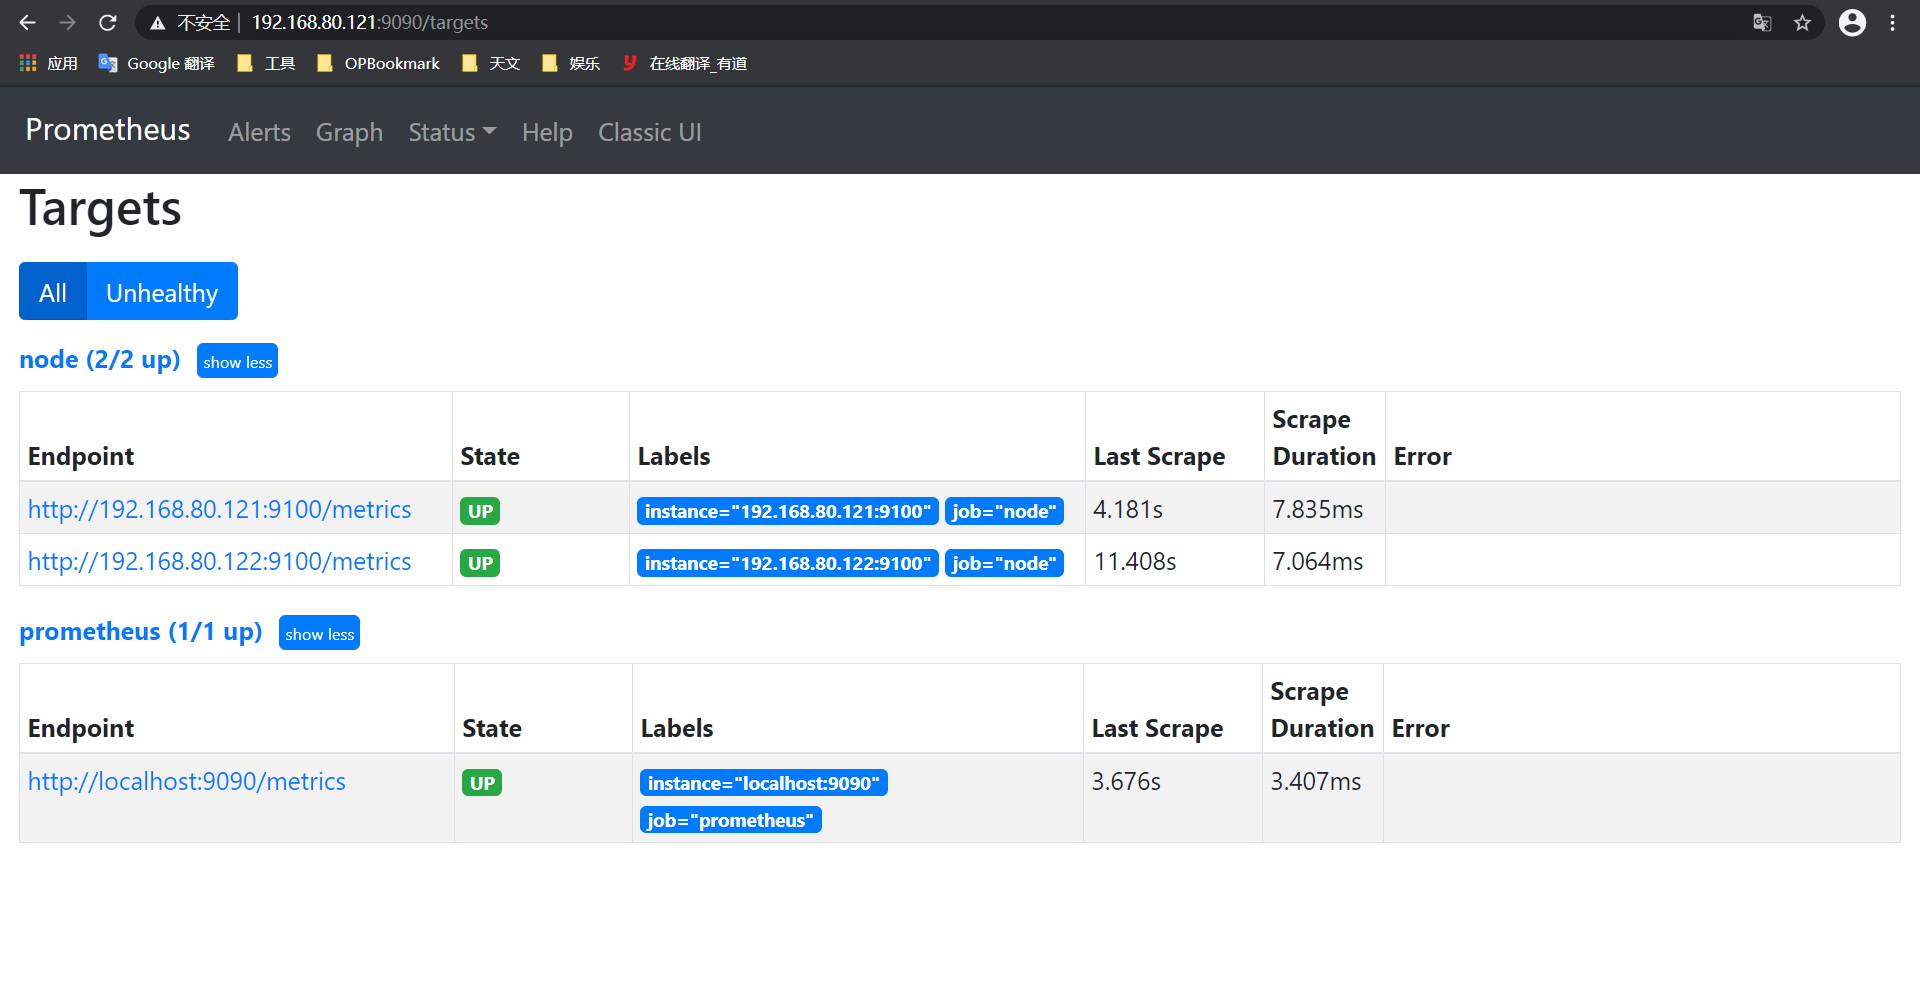
[root@centos2 /opt/prometheus-2.24.1.linux-amd64]$ cat prometheus.yml
# my global config
global:
  scrape_interval:     15s # Set the scrape interval to every 15 seconds. Default is every 1 minute.
  evaluation_interval: 15s # Evaluate rules every 15 seconds. The default is every 1 minute.
  # scrape_timeout is set to the global default (10s).

# Alertmanager configuration
alerting:
  alertmanagers:
  - static_configs:
    - targets:
      # - alertmanager:9093

# Load rules once and periodically evaluate them according to the global 'evaluation_interval'.
rule_files:
  # - "first_rules.yml"
  # - "second_rules.yml"

# A scrape configuration containing exactly one endpoint to scrape:
# Here it's Prometheus itself.
scrape_configs:
  # The job name is added as a label `job=<job_name>` to any timeseries scraped from this config.
  - job_name: 'prometheus'

    # metrics_path defaults to '/metrics'
    # scheme defaults to 'http'.

    static_configs:
    - targets: ['localhost:9090']

  - job_name: 'node'
    static_configs:
    - targets: ['192.168.80.121:9100','192.168.80.122:9100']
#新增
  - job_name: 'node'
    static_configs:
    - targets: ['192.168.80.121:9100','192.168.80.122:9100']
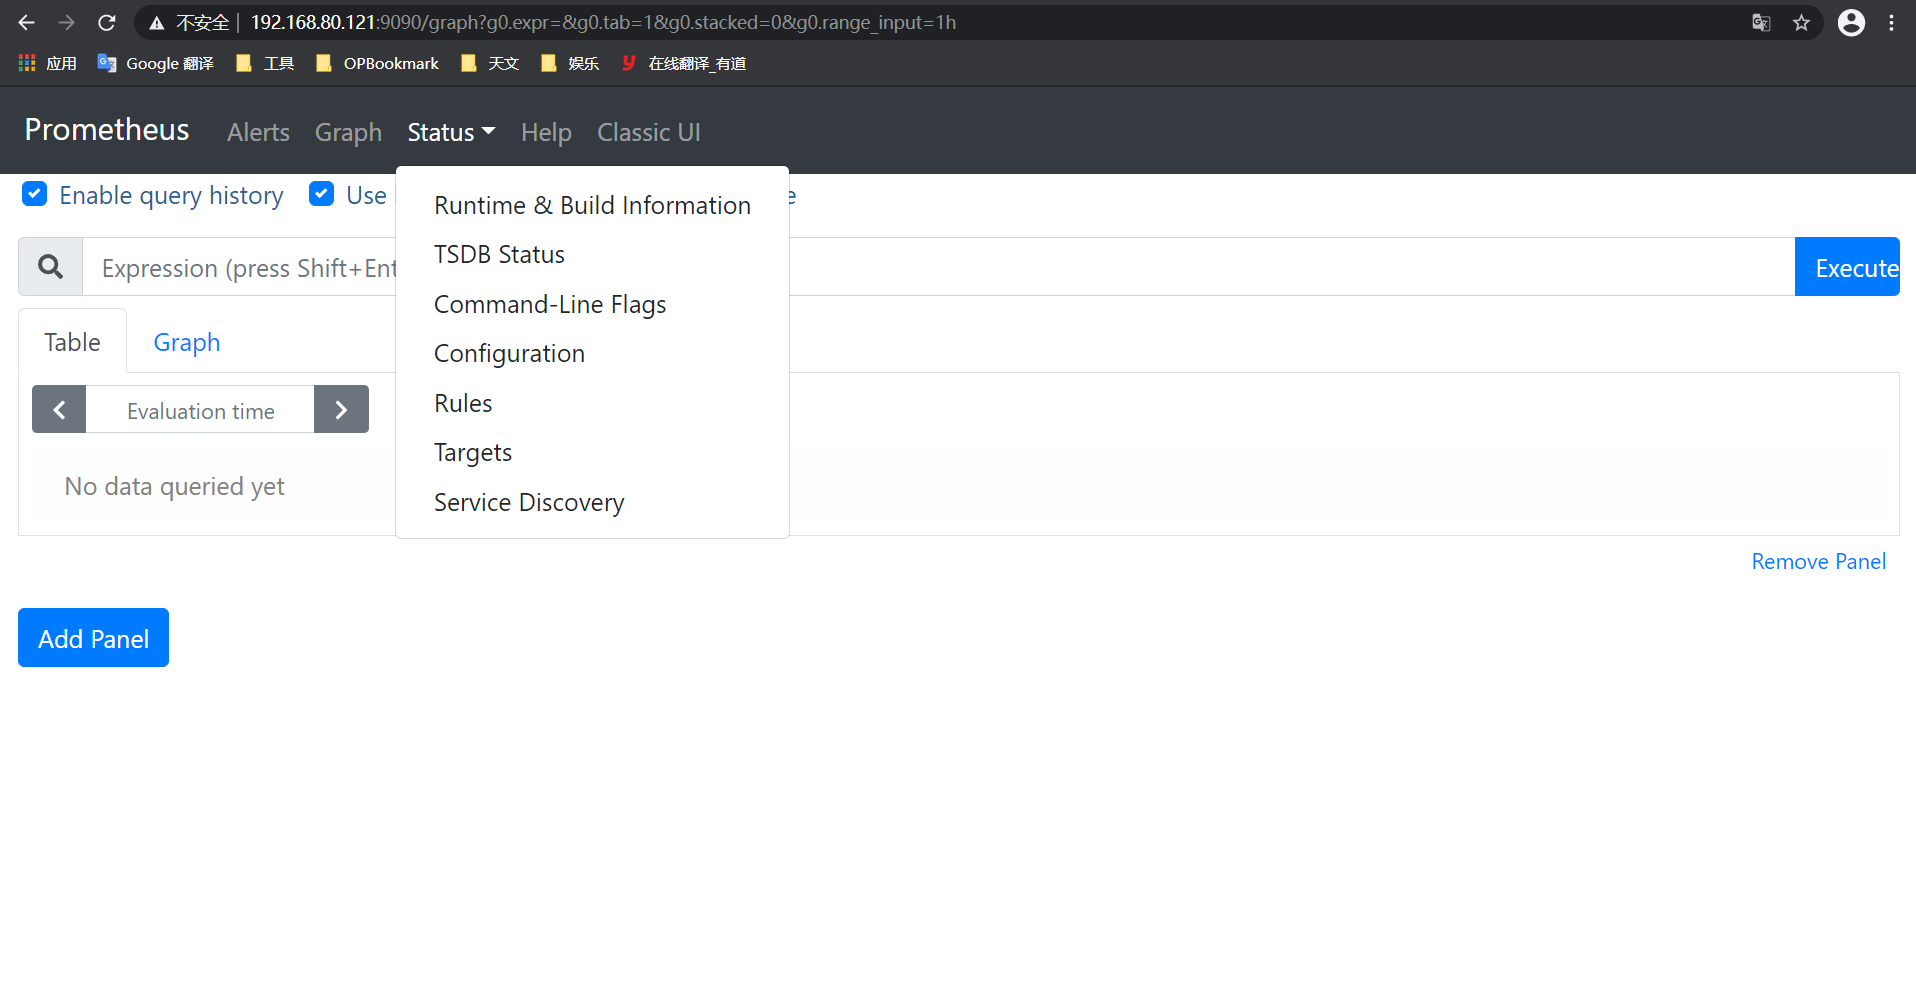

5.安装Grafana
#下载
wget -c https://dl.grafana.com/oss/release/grafana-7.3.7-1.x86_64.rpm

#安装
yum -y install grafana-7.3.7-1.x86_64.rpm

#官网指导
https://grafana.com/grafana/download
5.1启动与访问
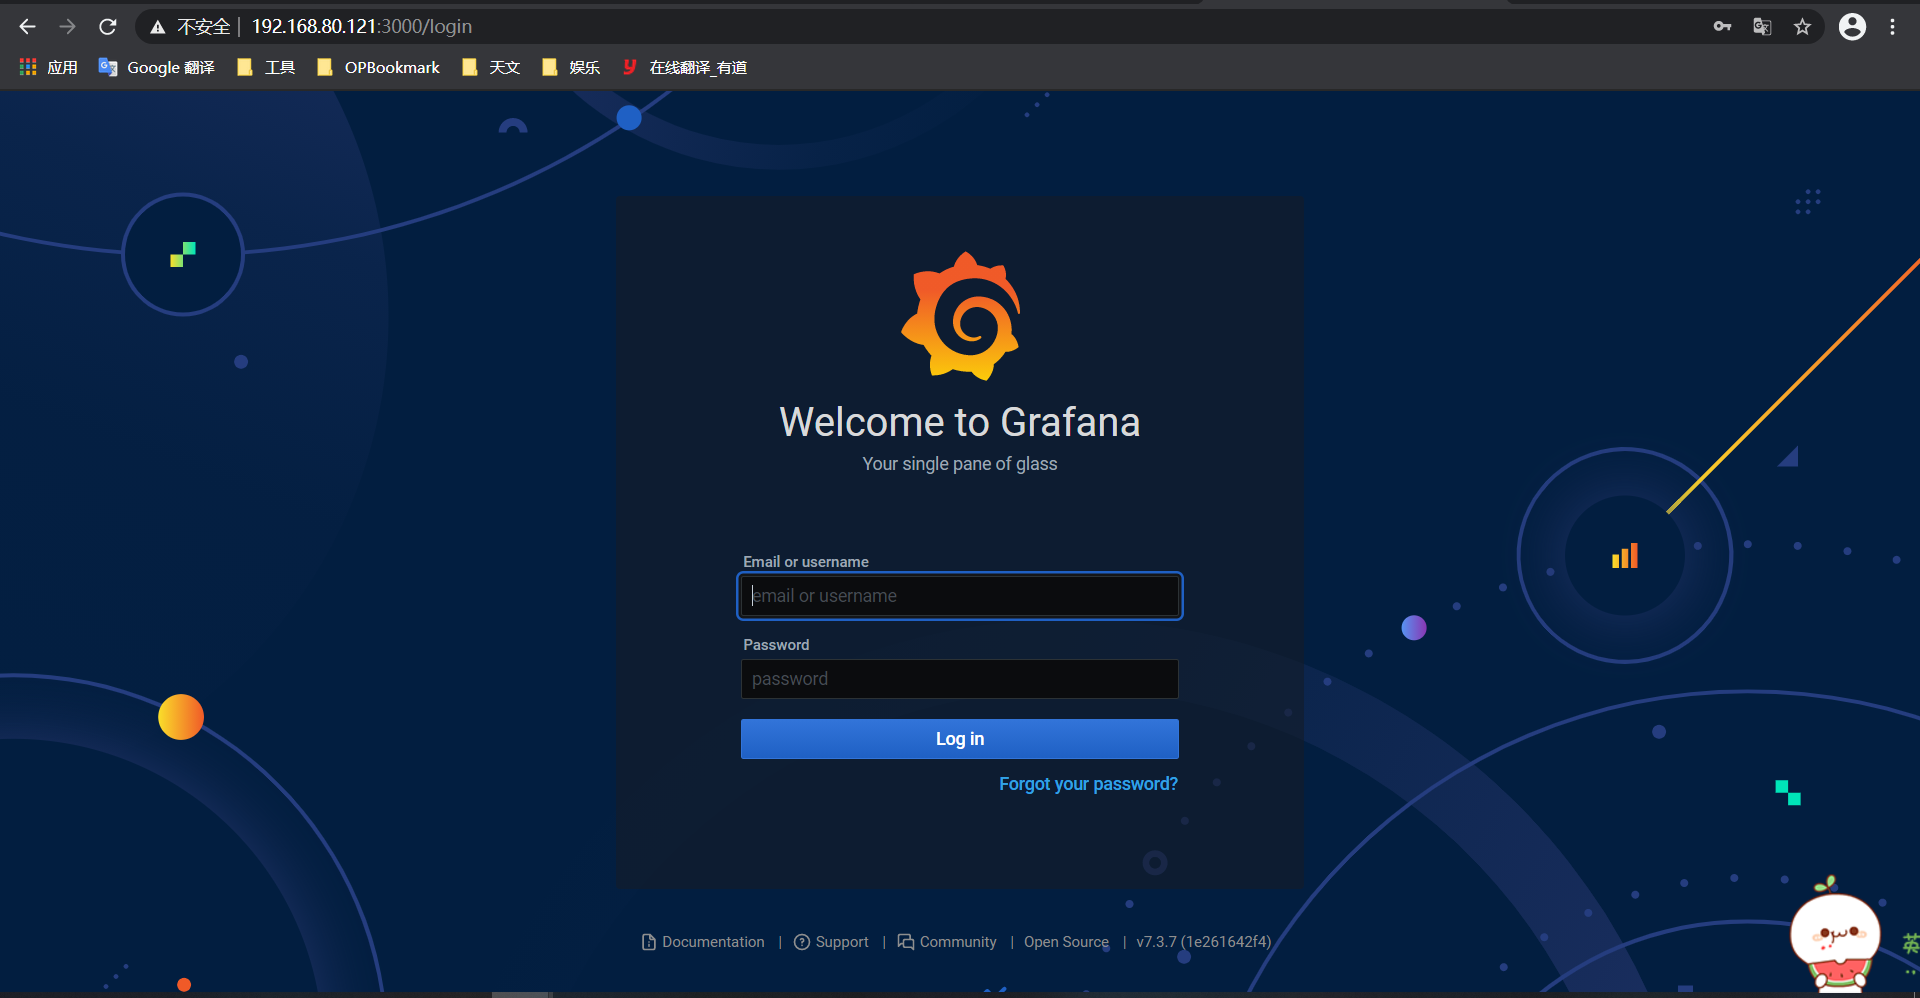
#添加系统服务
chkconfig --add /etc/init.d/grafana-server

#启动
systemctl enable grafana-server
systemctl start grafana-server

#开放端口
firewall-cmd --zone=public --add-port=3000/tcp
firewall-cmd --zone=public --add-port=3000/tcp --permanent

#访问
192.168.80.121:3000
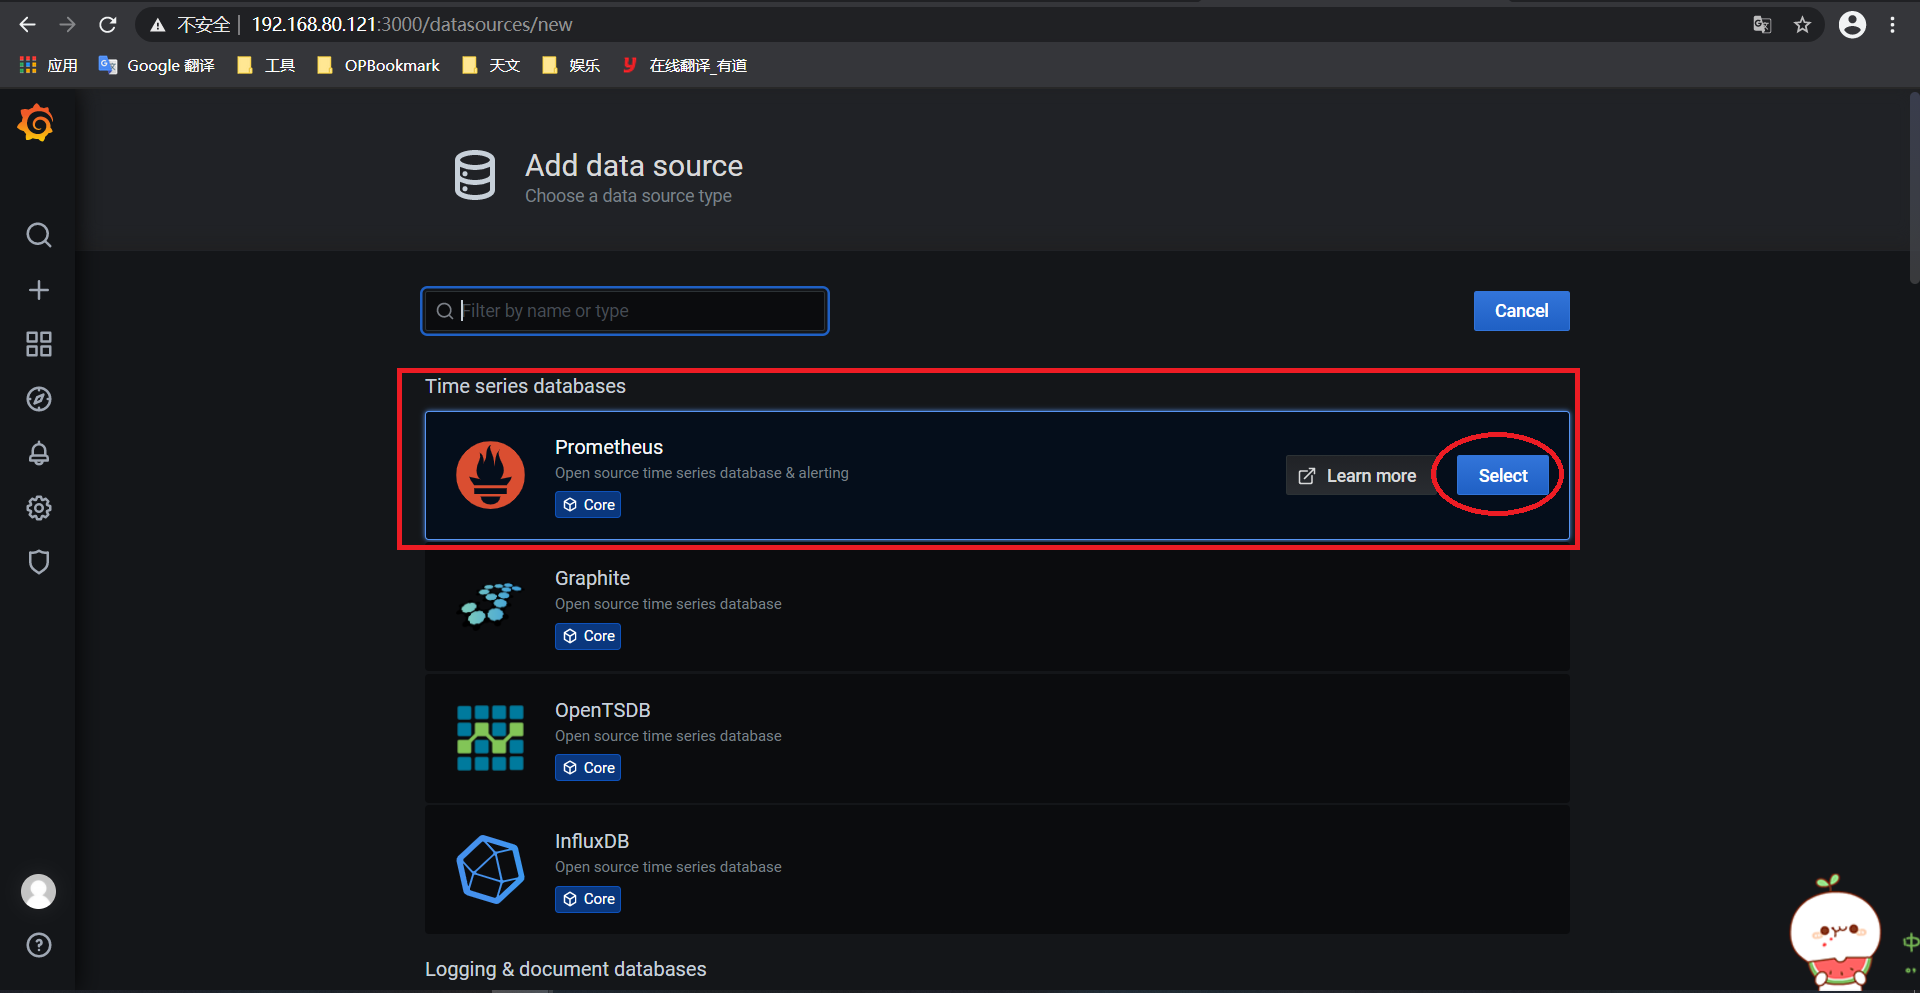
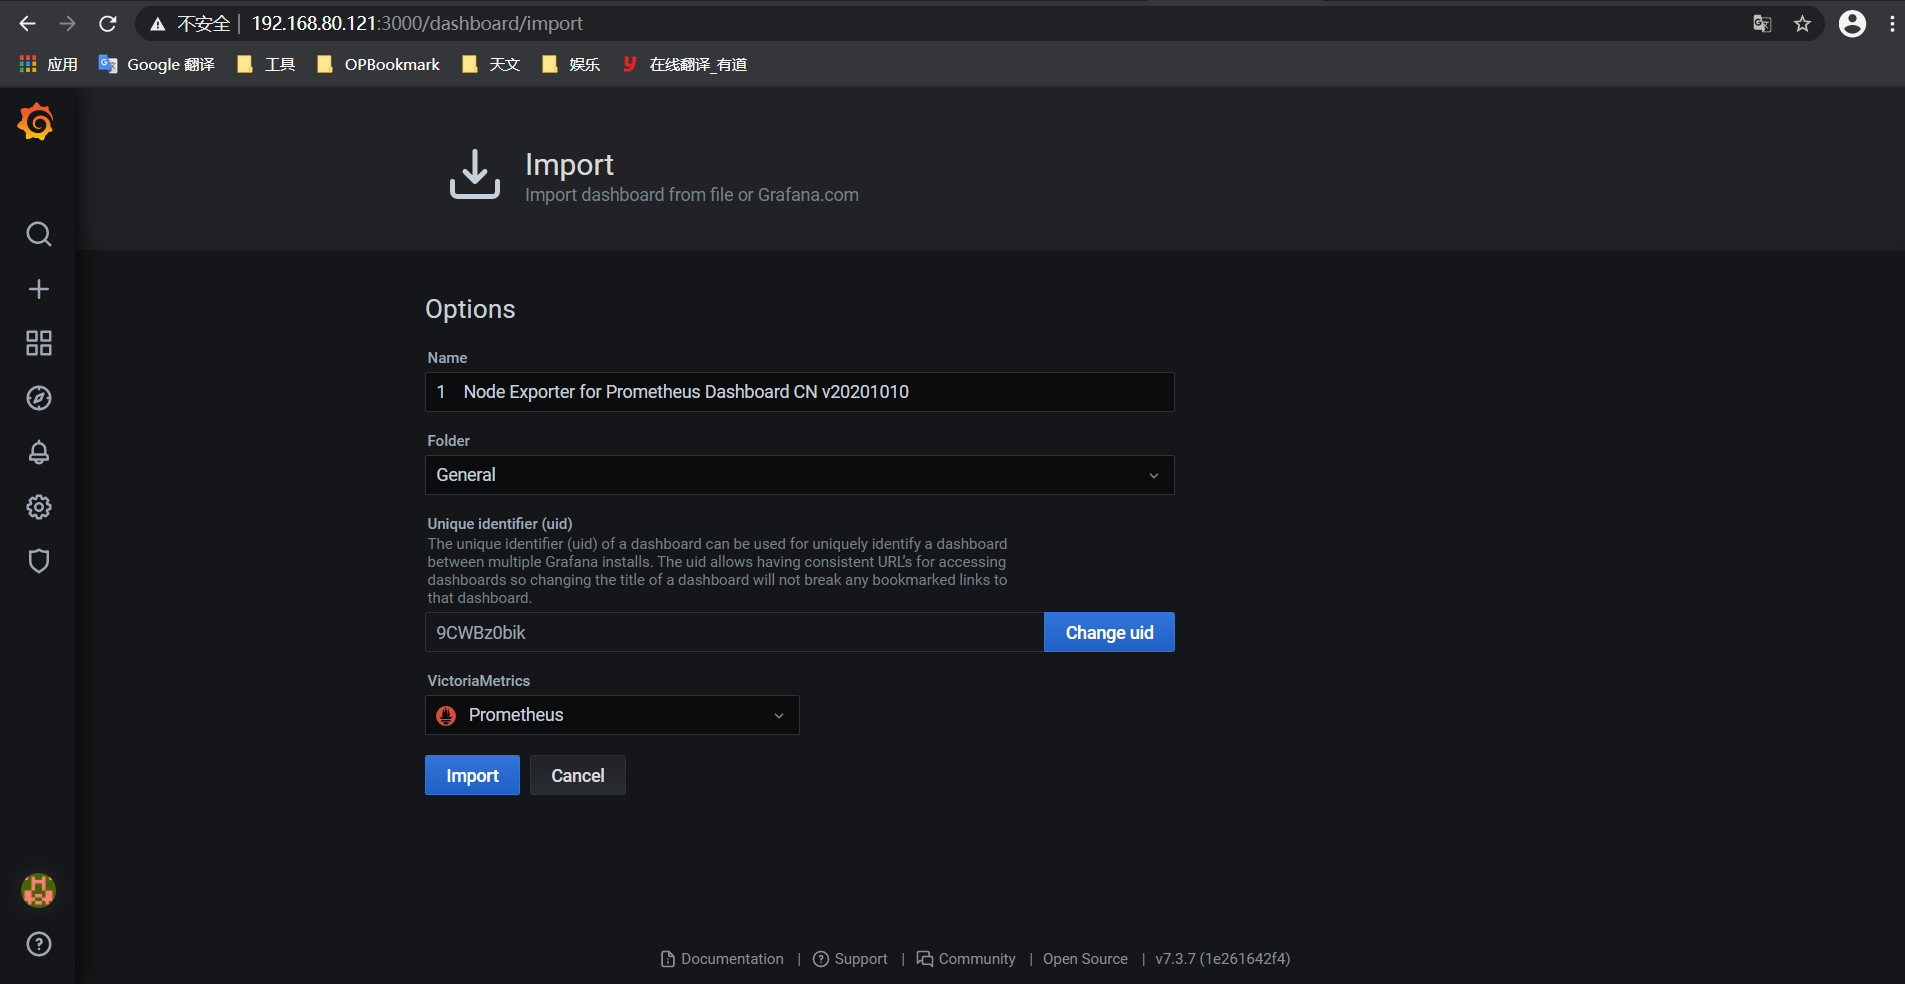
账户密码均为admin,首次访问会让修改密码,还需添加数据源。
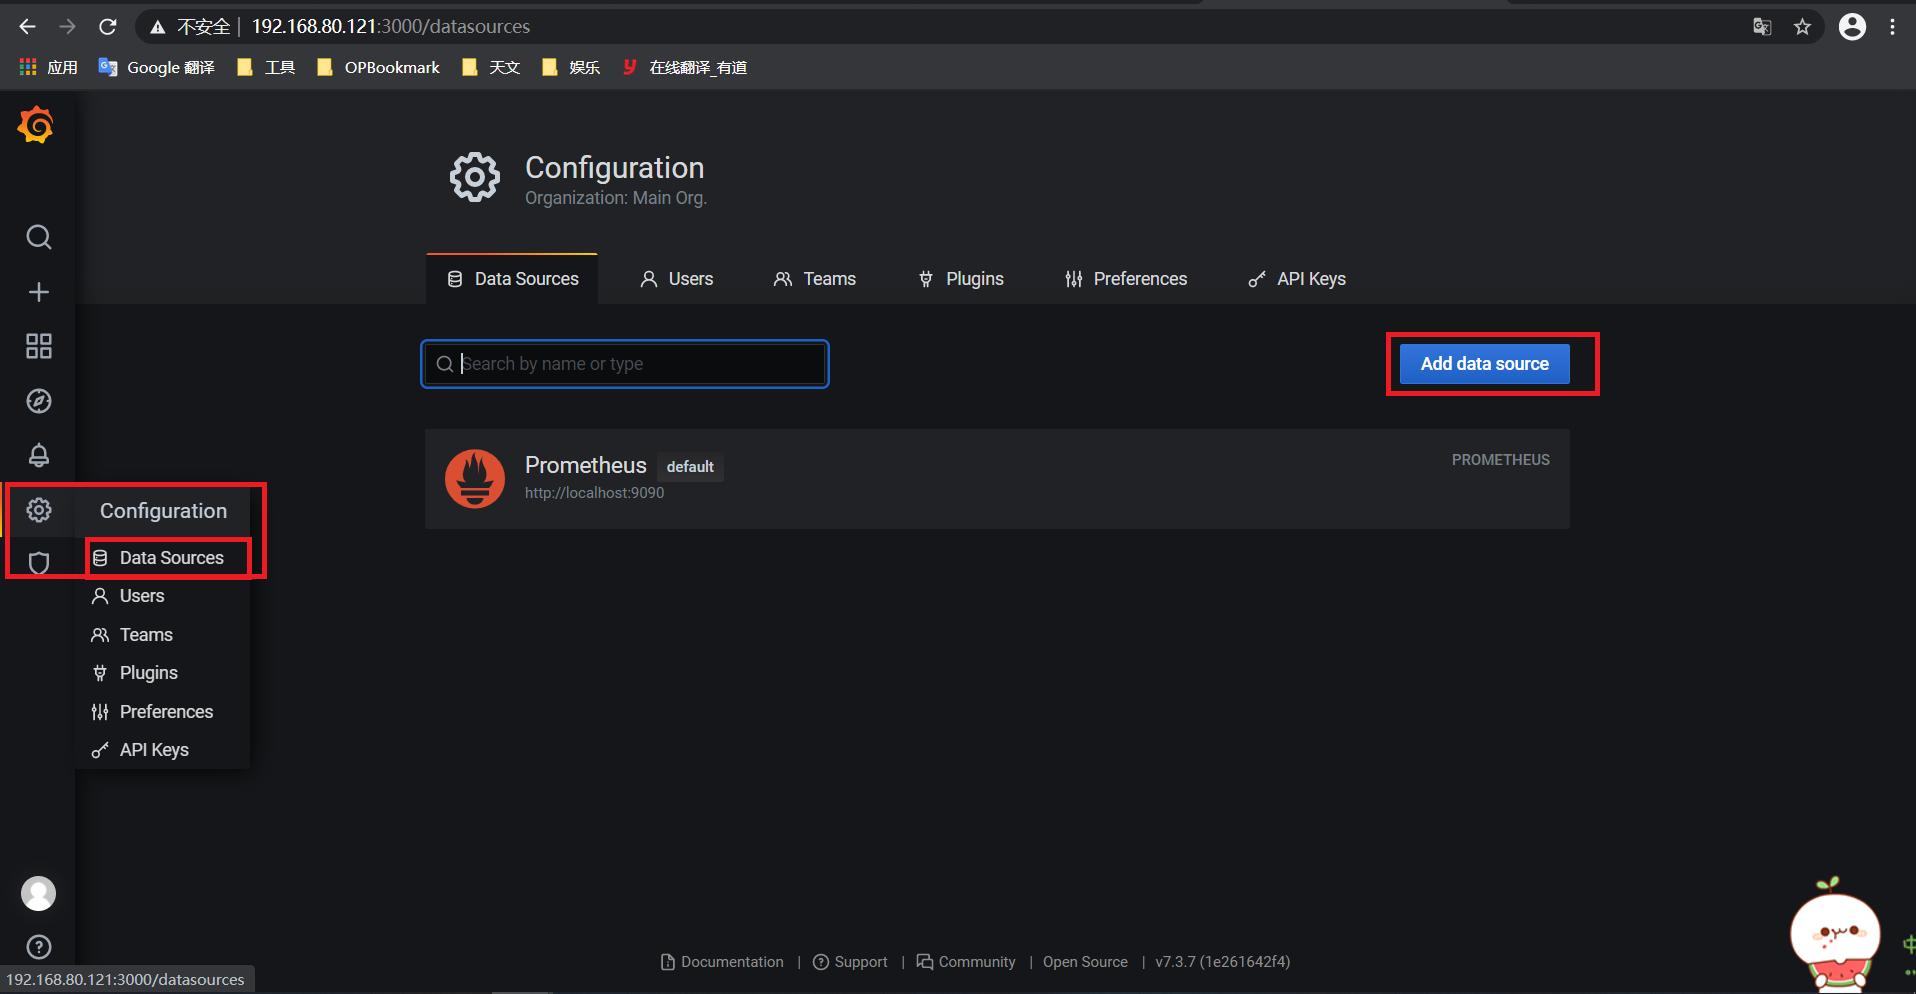
都默认即可。

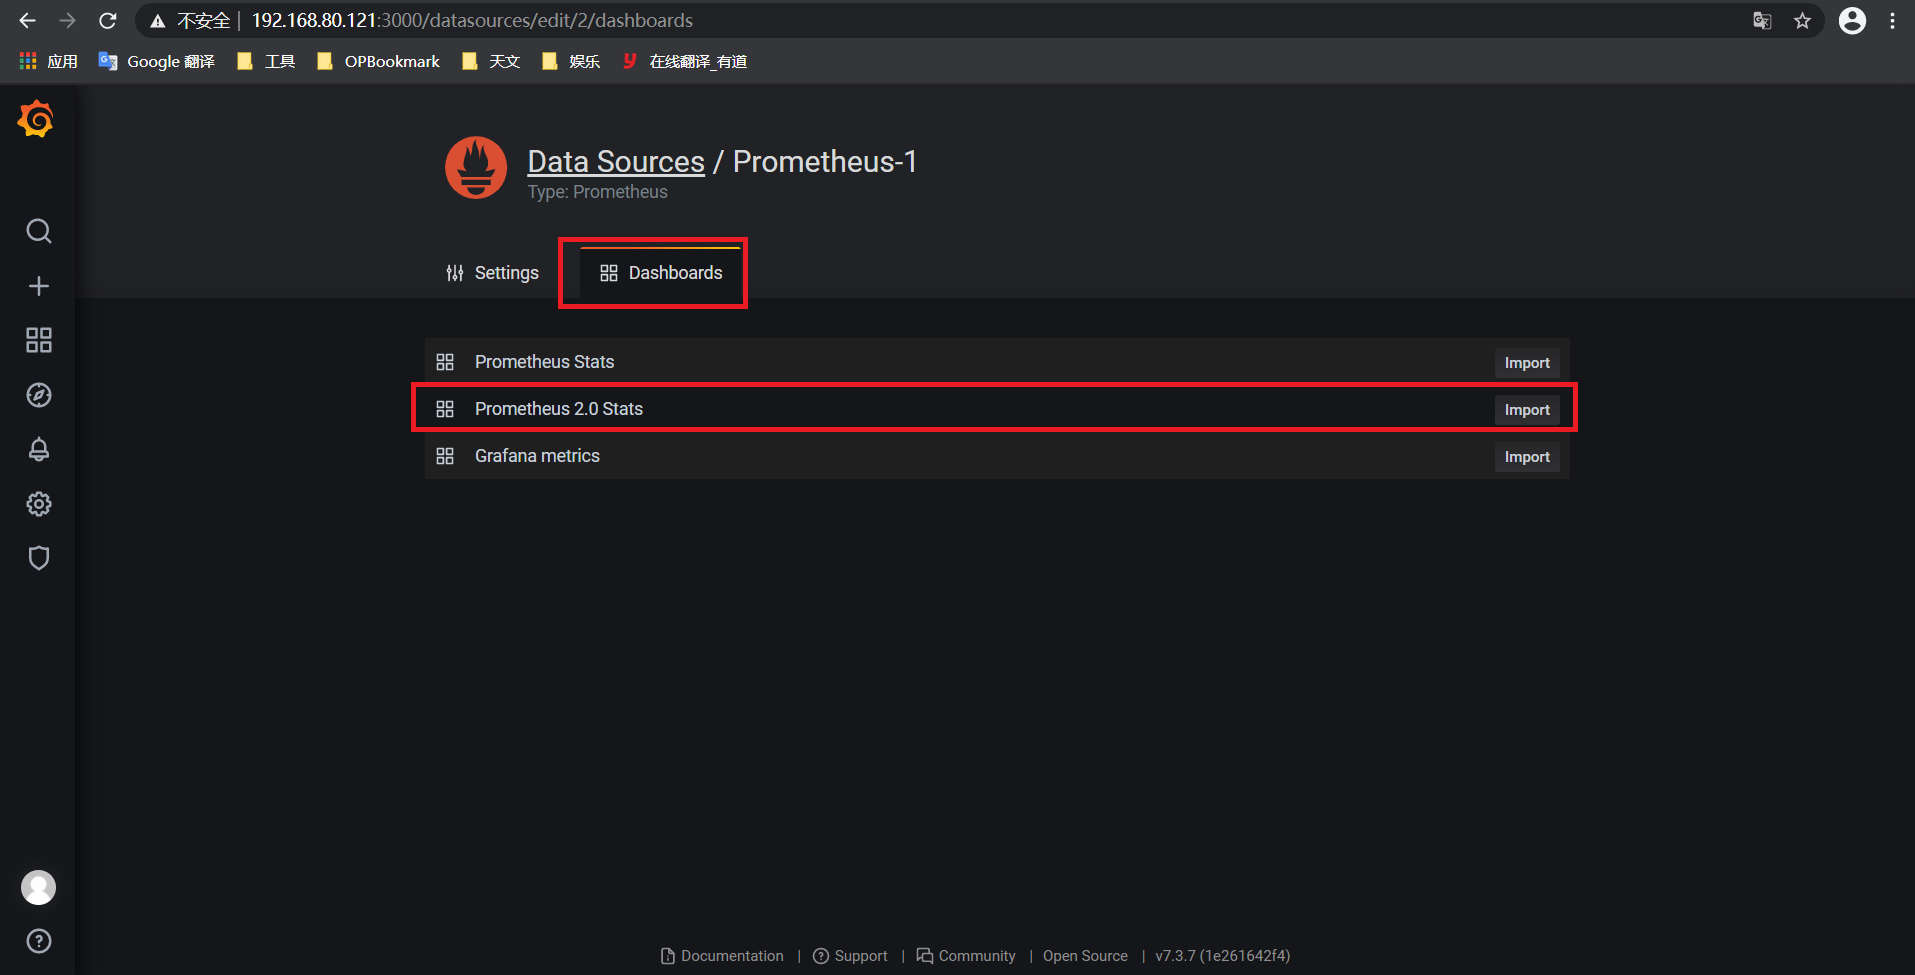
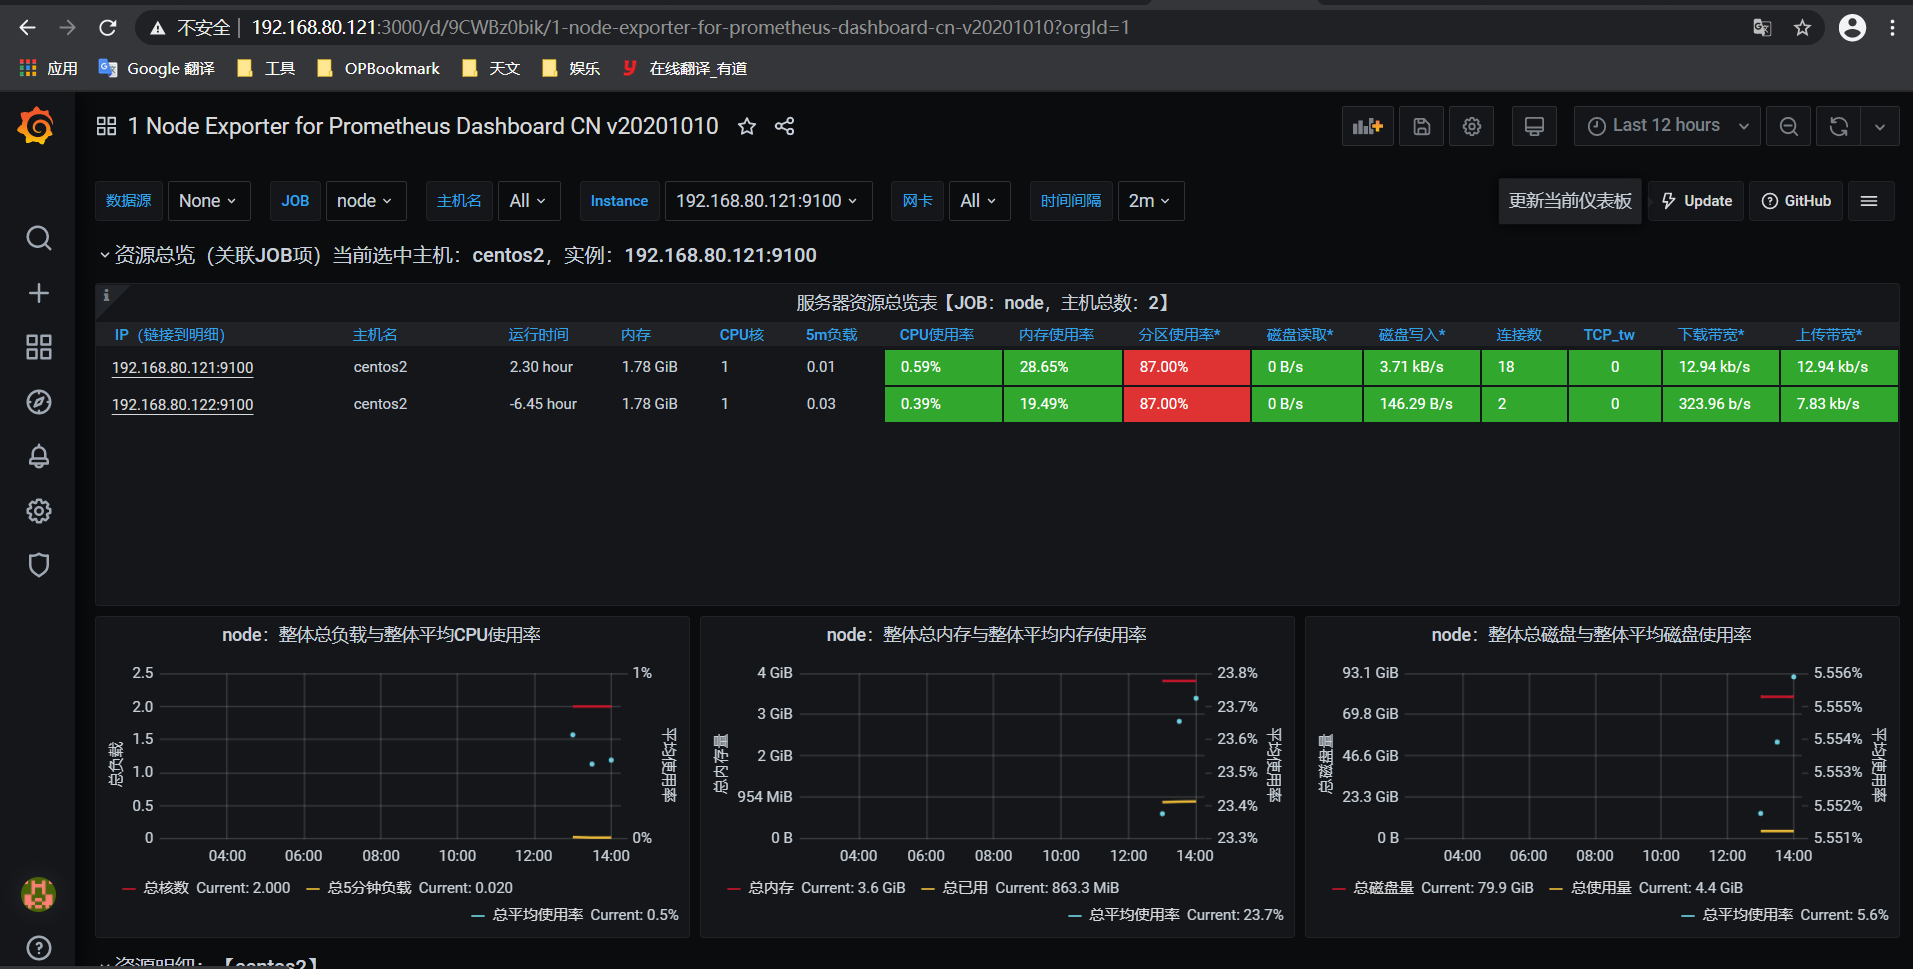
最后保存并查看。


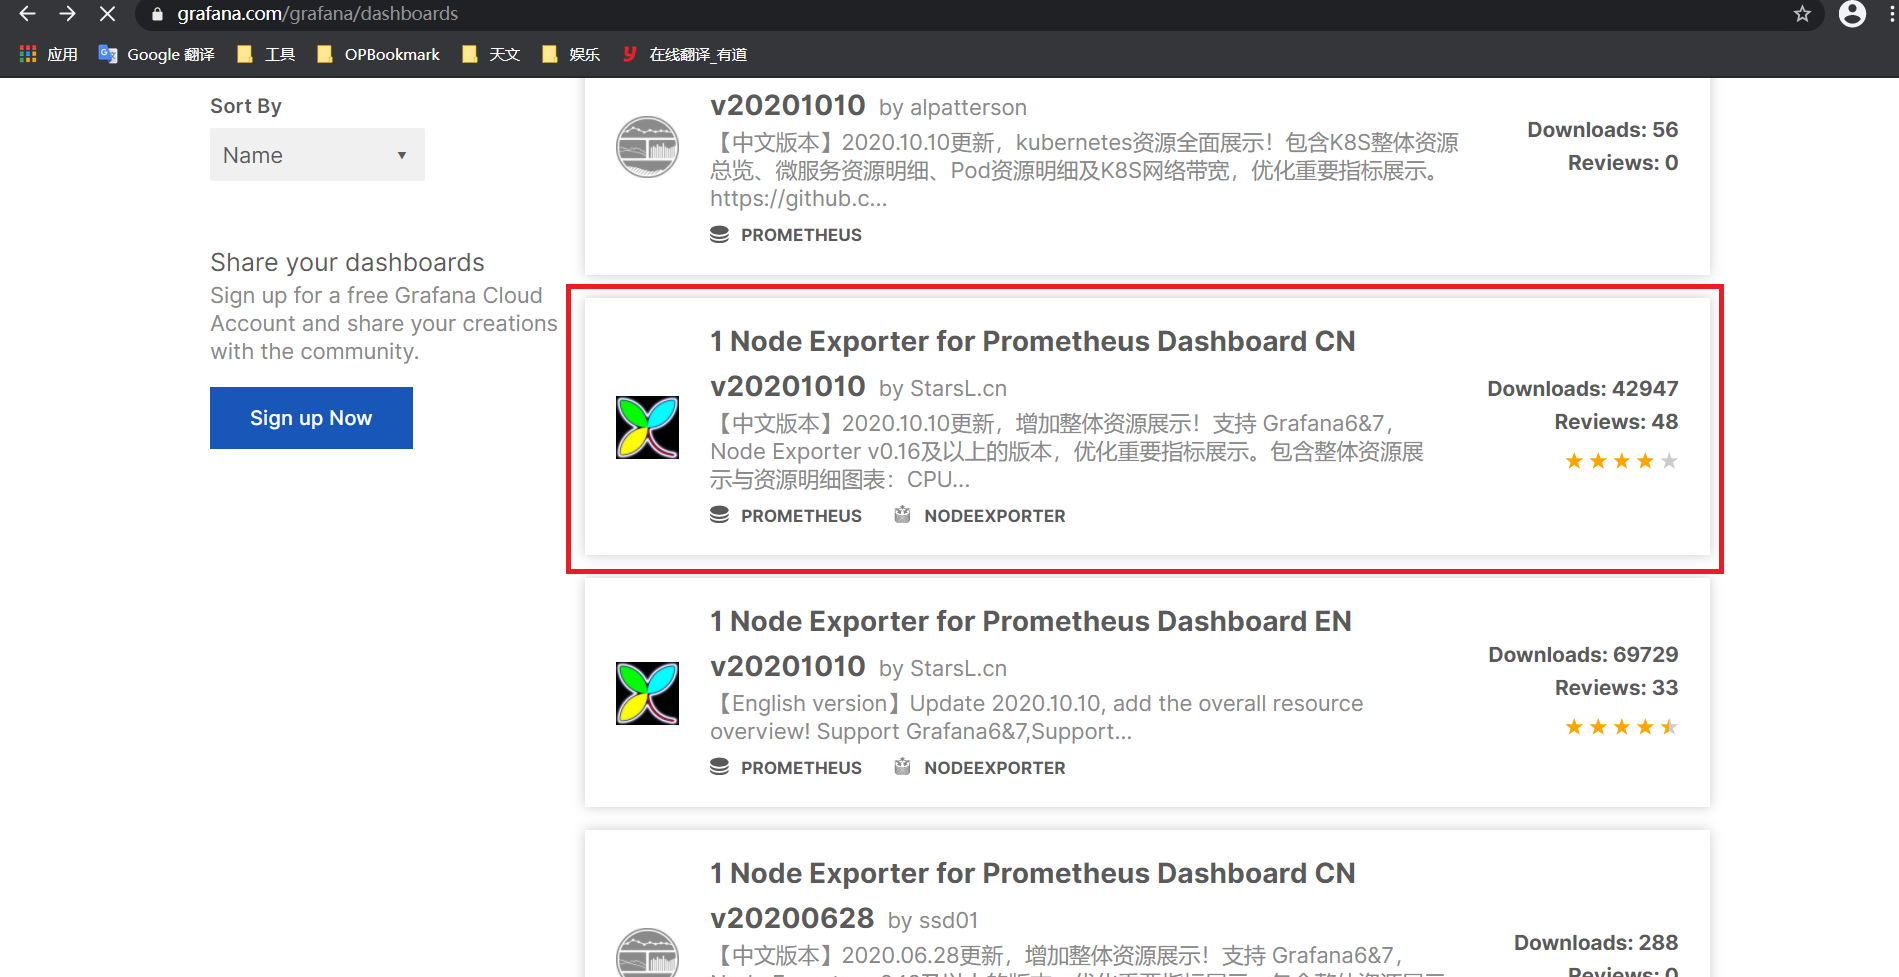
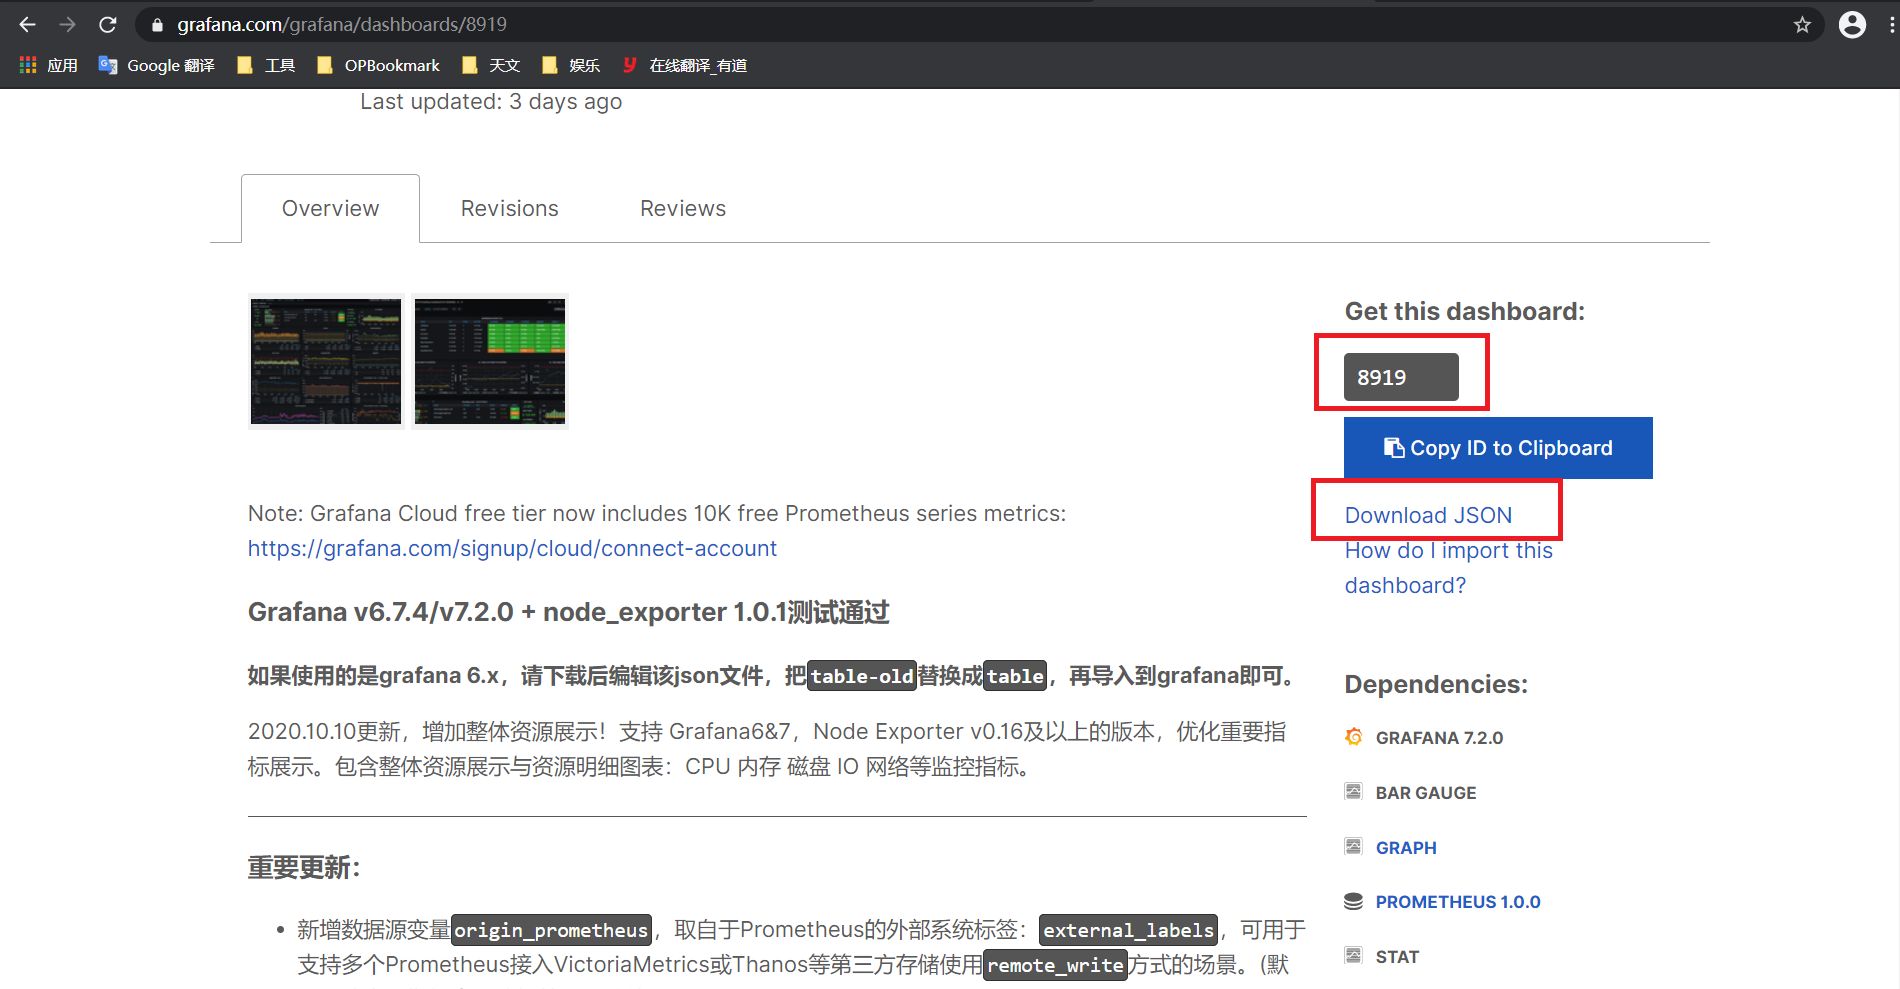
官网也有很多监控页面
https://grafana.com/grafana/dashboards


 浙公网安备 33010602011771号