爬取2020搜狗最新热门游戏榜单并实现可视化
一.主题式网络主题式网络爬虫设计方案
1.爬虫名称:爬取搜狗最新热门游戏榜
2.爬取内容:游戏搜索指度排名及游戏名称;
3.网络爬虫设计方案概述:
思路:
①确定网页爬取内容。
②查看选取内容的网页源代码 ,找到关键内容的索引,提取关键信息。
③导入第三方库,爬取内容。
④对内容进行分析,绘制图形方程,以及可视化处理。
难点:可视化处理如何更具有直观性,如何快速处理爬取内容使内容简要。
二、主题页面的结构特征分析
1.主题页面的结构与特征分析
该页面是由游戏名,游戏介绍及游戏搜索指数整合而成的排行榜,该网站源代码中包含数个总标签,分析并提取总标签,即可爬取所需内容。
2.Htmls页面解析
进入需爬取页面:http://top.sogou.com/game/quanbu_1.html(搜狗热门游戏榜单):
利用浏览器插件进入源代码界面(如下所示):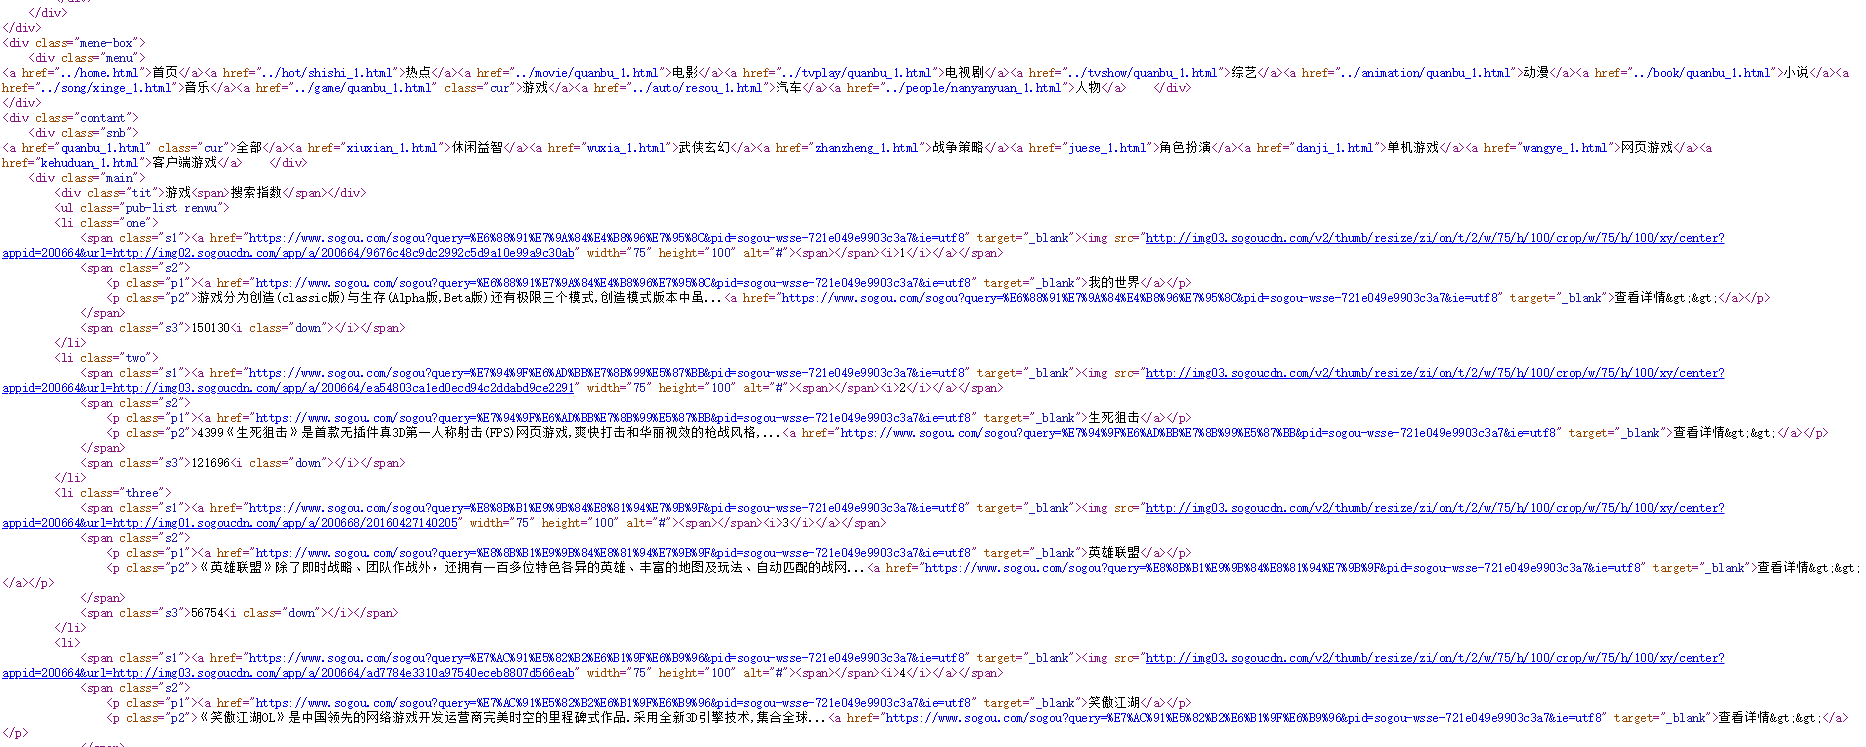
3.节点(标签)查找方法与遍历方法
分析源代码界面,利用ctrl+u查找所需标签,如该源代码所需标签为(class_="p1")和(class_="s3")。
三、网络爬虫程序设计:
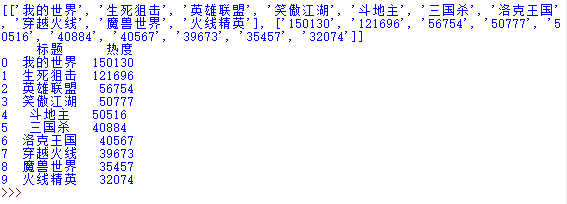
1.数据爬取与采集
import requests
import pandas as pd
import matplotlib.pyplot as plt
import matplotlib
from bs4 import BeautifulSoup
from pandas import DataFrame
from urllib.request import urlopen
url="http://top.sogou.com/game/quanbu_1.html"
headers = {'User-Agent':'Mozilla/5.0 (Windows NT 6.3; Win64; x64) AppleWebKit/537.36 (KHTML, like Gecko)Chrome/69.0.3497.100 Safari/537.36'}
def getHTMLText(url,timeout=30):
    try:
        r=requests.get(url,timeout=30)
        r.raise_for_status()
        r.encoding=r.apparent_encoding
        return r.text
    except:
        return'产生异常'
r=requests.get(url)
r.encoding=r.apparent_encoding
html = r.text
soup = BeautifulSoup(html,'lxml')
title=[]
heat=[]
for n in soup.find_all(class_="rk"):
heat.append(n.get_text().strip())
for m in soup.find_all(class_="p1"):
title.append(m.get_text().strip())
for n in soup.find_all(class_="s3"):
heat.append(n.get_text().strip())
data=[rank,title,heat]
print(data)
a=pd.DataFrame(data,index=["排名","标题","热度"])
print(a.T)
2.对数据进行清洗和处理
import re
import string
def cleanInput(input):
input = re.sub('\n'," ",input)
input = re.sub(' +'," ",input)
input = bytes(input,'UTF-8') #转化为utf-8编码格式以消除转义字符
input = input.decode("ascii", "ignore")
cleanInput = []
input = input.split(' ')
for item in input:
item = item.strip(string.punctuation) #删除标点符号
if len(item)>1 or (item.lower() == 'a' or item.lower()=='i'):
cleanInput.append(item)
return cleanInput
def ngrams(input,n):
input = cleanInput(input)
output = []
for i in range(len(input)-n+1):
output.append(input[i:i+n])
return output
3.数据分析与可视化
# 绘制柱状图
plt.bar(df.排名, df.热度, label="排名热度分析柱状图")
plt.show()
4.根据数据之间的关系,分析两个变量之间的相关系数,画出散点图,并建立变量之间的回归方程(一元或多元)
def main():
    colnames = ["排名", "标题", "热度"]
    df = pd.read_excel('C:\Users\Administrator\Deskto\python作业.xlsx',skiprows=1,names=colnames)
    X = df.排名
    Y = df.热度

    def fit_func(p, x):
        k, b = p
        return k * x + b

    def error_func(p, x, y):
        return fit_func(p,x)-y
    p0=[0,0]

    Para=leastsq(error_func, p0, args = (X, Y))
    k,b=Para[0]
    print("k=",k,"b=",b)

    plt.figure(figsize=(10,5))#图像尺寸
    plt.scatter(X,Y,color="green",label=u"得分分布",linewidth=2)
    x=np.linspace(0,40,20)
    y=k*x+b
    plt.plot(x,y,color="red",label=u"回归方程直线",linewidth=2)

    plt.title("游戏热度与排名关系图")
    plt.xlabel('排名')
    plt.ylabel('热度')
    plt.legend(loc=3,prop=chinese)#绘制图例
    plt.show()

main()
5.数据持久化
import scrapy
class Spider(scrapy.Spider):
name = 'paihangbangi'
allowed_domains = ['http://top.sogou.com/game/quanbu_1.html']
start_urls = ['http://top.sogou.com/game/quanbu_1.html']
def parse(self, response):
#将xpath表达式直接作用于该函数中
odiv = response.xpath('//div[@id="content-left"]/div')
content_list = [] #用于存储解析到的数据
for div in odiv:
author = div.xpath('.//div[@class="p1"]/a/h2/text()')[0].extract()
content=div.xpath('.//div[@class="s3"]/span/text()')[0].extract()
#将解析到的内容封装到字典中
dic={'标题':author,'热度':content}
#将数据存储到content_list这个列表中
content_list.append(dic)
return content_list
6.将以上各部分的代码汇总,附上完整程序代码
import requests
import pandas as pd
import matplotlib.pyplot as plt
import matplotlib
from bs4 import BeautifulSoup
from pandas import DataFrame
from urllib.request import urlopen
url="http://top.sogou.com/game/quanbu_1.html"
headers = {'User-Agent':'Mozilla/5.0 (Windows NT 6.3; Win64; x64) AppleWebKit/537.36 (KHTML, like Gecko)Chrome/69.0.3497.100 Safari/537.36'}
def getHTMLText(url,timeout=30):
    try:
        r=requests.get(url,timeout=30)
        r.raise_for_status()
        r.encoding=r.apparent_encoding
        return r.text
    except:
        return'产生异常'
r=requests.get(url)
r.encoding=r.apparent_encoding
html = r.text
soup = BeautifulSoup(html,'lxml')
title=[]
heat=[]
for n in soup.find_all(class_="rk"):
heat.append(n.get_text().strip())
for m in soup.find_all(class_="p1"):
title.append(m.get_text().strip())
for n in soup.find_all(class_="s3"):
heat.append(n.get_text().strip())
data=[rank,title,heat]
print(data)
a=pd.DataFrame(data,index=["排名","标题","热度"])
print(a.T)
import re
import string
def cleanInput(input):
input = re.sub('\n'," ",input)
input = re.sub(' +'," ",input)
input = bytes(input,'UTF-8') #转化为utf-8编码格式以消除转义字符
input = input.decode("ascii", "ignore")
cleanInput = []
input = input.split(' ')
for item in input:
item = item.strip(string.punctuation) #删除标点符号
if len(item)>1 or (item.lower() == 'a' or item.lower()=='i'):
cleanInput.append(item)
return cleanInput
def ngrams(input,n):
input = cleanInput(input)
output = []
for i in range(len(input)-n+1):
output.append(input[i:i+n])
return output
# 绘制柱状图
plt.bar(df.排名, df.热度, label="排名热度分析柱状图")
plt.show()
def main():
    colnames = ["排名", "标题", "热度"]
    df = pd.read_excel('C:\Users\Administrator\Deskto\python作业.xlsx',skiprows=1,names=colnames)
    X = df.排名
    Y = df.热度

    def fit_func(p, x):
        k, b = p
        return k * x + b

    def error_func(p, x, y):
        return fit_func(p,x)-y
    p0=[0,0]

    Para=leastsq(error_func, p0, args = (X, Y))
    k,b=Para[0]
    print("k=",k,"b=",b)

    plt.figure(figsize=(10,5))#图像尺寸
    plt.scatter(X,Y,color="green",label=u"得分分布",linewidth=2)
    x=np.linspace(0,40,20)
    y=k*x+b
    plt.plot(x,y,color="red",label=u"回归方程直线",linewidth=2)

    plt.title("游戏热度与排名关系图")
    plt.xlabel('排名')
    plt.ylabel('热度')
    plt.legend(loc=3,prop=chinese)#绘制图例
    plt.show()

main()
import scrapy
class Spider(scrapy.Spider):
name = 'paihangbangi'
allowed_domains = ['http://top.sogou.com/game/quanbu_1.html']
start_urls = ['http://top.sogou.com/game/quanbu_1.html']
def parse(self, response):
#将xpath表达式直接作用于该函数中
odiv = response.xpath('//div[@id="content-left"]/div')
content_list = [] #用于存储解析到的数据
for div in odiv:
author = div.xpath('.//div[@class="p1"]/a/h2/text()')[0].extract()
content=div.xpath('.//div[@class="s3"]/span/text()')[0].extract()
#将解析到的内容封装到字典中
dic={'标题':author,'热度':content}
#将数据存储到content_list这个列表中
content_list.append(dic)
return content_list
四、结论
1.经过对主题数据的分析与可视化,可以得到哪些结论?
①经过数据分析和可视化,可以更为直观了解排行榜动向。
②通过对数据的整理,可以使冗杂的数据更加直观明了。
③数据在进行分析整理后,可更方便的投入二次利用。
2.对本次程序设计任务完成的情况做一个简单的小结。
①作业难度较大,但是积累了很多实用经验,也让我了解到python在数据处理方面的实用性。
②要想更好的完成程序任务,还需要更多的练习更多的尝试。

 浙公网安备 33010602011771号