

vue-cli3中使用mxgraph的一些总结
很欣慰,用mxgGaph开发流程图,锻炼了我的英语阅读能力(这里有一个无奈的苦笑);
这里先记录一下卡了我两天的一个,怎么形容呢,一个小水坑。不踩不知道,踩了哈哈笑。PS:此处不记录过程,只记录问题,适用于用过此插件并对插件有一定了解的宝宝们。
1、关于mxgraph的自动布局:
a、使用mxgraph的自动布局,要设置节点可编辑,否则布局无效,小水坑呀小水坑,欢乐的小水坑:

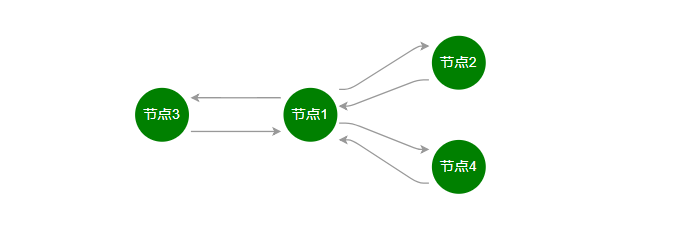
b、很多后台流程是有回调,所以节点之间的连线是双向的,这时候用树形布局,就失效了,因为双向的连线不符合树形布局,这时候可以换成mxHierarchicalLayout布局例如这种:
2、关于使用html代码来渲染节点
第一步,设置开启支持html:

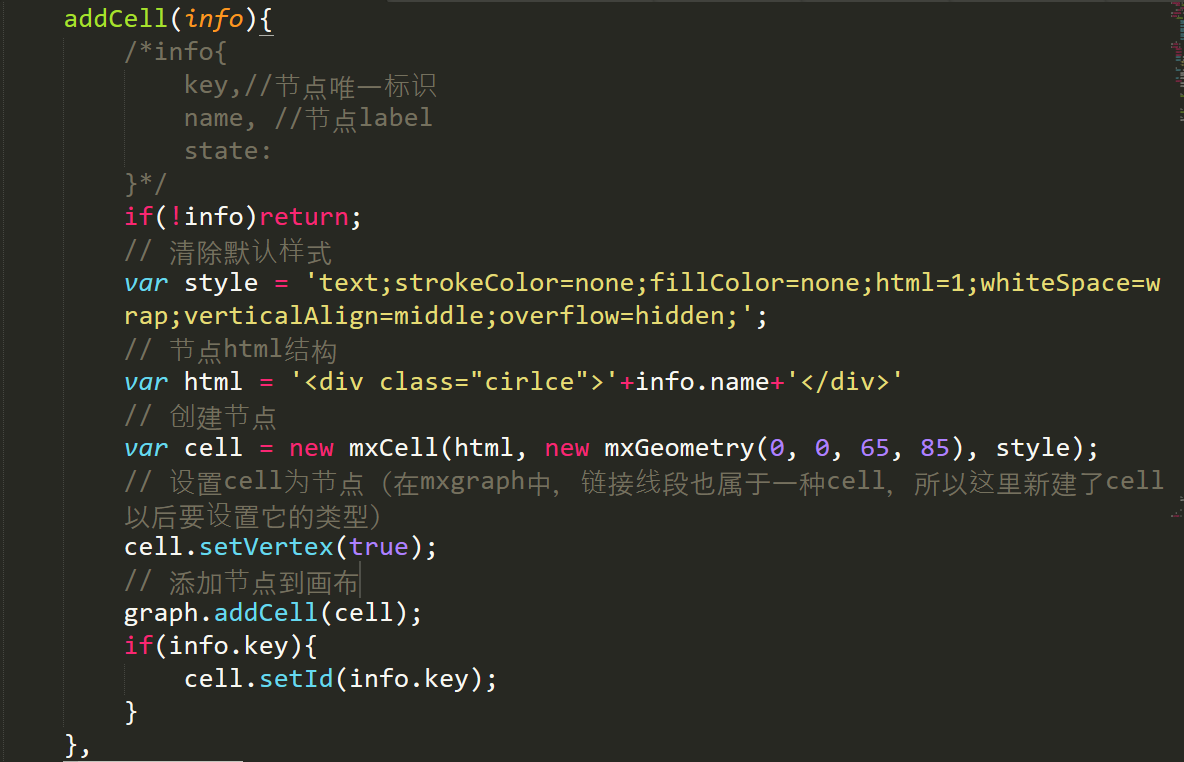
第二步,创建节点并添加到画布:
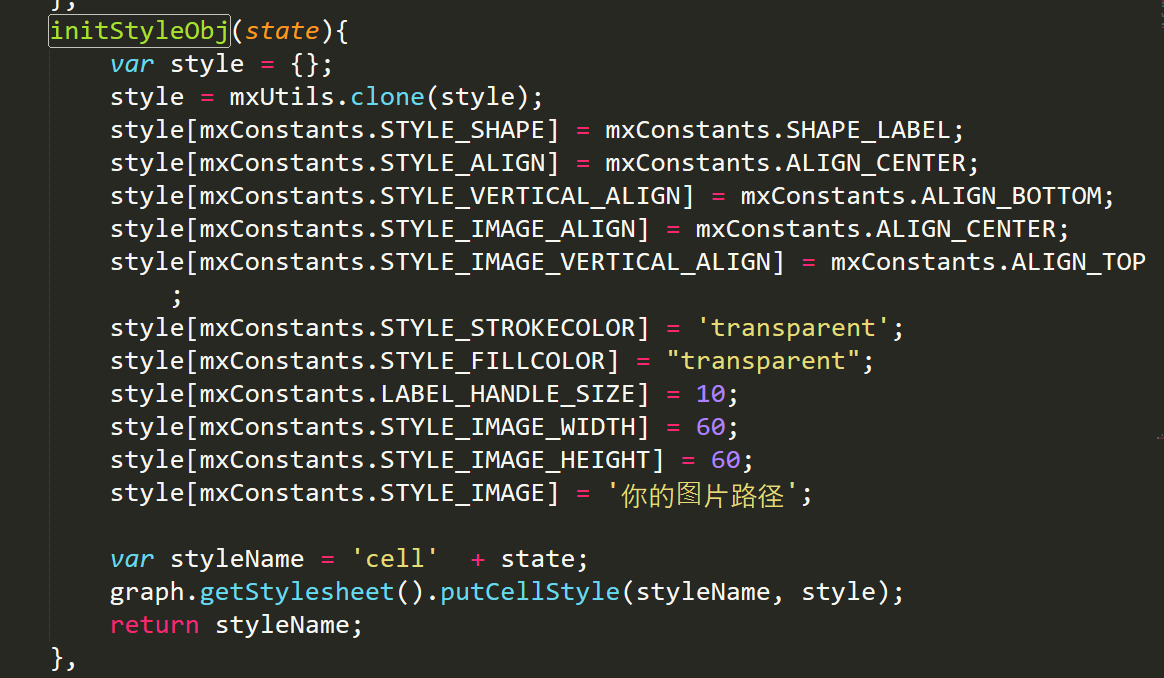
3、节点中使用图片,要设置STYLE_SHAPE 为 SHAPE_LABEL 才可以,以下是一段节点使用图片的样式设置,label在图片下方:
4、在vue-cli3 中, 通过npm安装并使用 mxgraph
项目任务比较紧,这次就偷懒使用了官方脚手架,单页面开发方式,使用vue-router做路由。
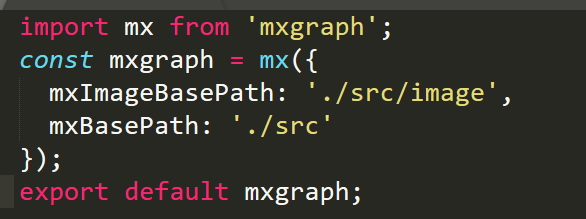
网上其他关于vue-cli3 使用 mxgraph的文章中都提到了报错,但是我并没有遇到,这里就贴一下我的整合方式吧:
mxgraph.js中:
vue页面或者组件中:引入mxgraph 并 定义 需要用到的类 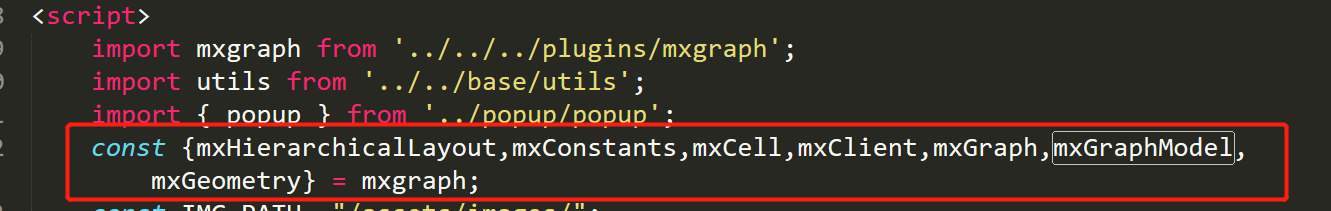
最后,附上mxgraph组件的代码:
<template>
    <div class="container" :class="boxClass">
        <div id="pannel"></div>
    </div>
</template>
<style>
    .cirlce{
        height: 60px;
        width: 60px;
        background-color: green;
        border-radius: 30px;
        font-size: 16px;
        color: #fff;
        line-height: 60px;
        text-align: center;
    }
</style>
<script>
    import mxgraph from '../../../plugins/mxgraph';
    import utils from '../../base/utils';
    import { popup } from '../popup/popup';
    const {mxHierarchicalLayout,mxConstants,mxCell,mxClient,mxGraph,mxGraphModel,mxGeometry} = mxgraph;
    const colorMap = {
        '00': '#999', // 正常
        '11': 'red' // 失败
    }
    var graph;
    export default {
        name: 'workflow',
        props: {
            boxClass: String,
            oriData: Object
        },
        data() {
            return {


            }
        },
        mounted(){
            this.init();
        },
        methods: {
            init(){
                var container = document.getElementById('pannel');
                // Checks if the browser is supported
                if(!mxClient.isBrowserSupported()){
                    // Displays an error message if the browser is not supported.
                    popup.bubble('error','Browser is not supported!');
                    return;
                }
                //init容器
                var model = new mxGraphModel();
                graph = new mxGraph(container, model);
                //设置元素可被连接线连接
                graph.setConnectable(false);
                //设置元素可编辑,不然无法自动布局
                graph.setCellsLocked(false);
                //设置两个节点是否可以建立多个连接
                graph.setMultigraph(true);
                //cell创建支持传入html
                graph.setHtmlLabels(true);
                //是否允许线单独存在
                graph.setAllowDanglingEdges(false);
                //设置cell可选中
                graph.setCellsSelectable(false);
                //设置面板可以扩大
                graph.setPanning(false);
                /*设置连接线样式*/
                var style = graph.getStylesheet().getDefaultEdgeStyle();
                //圆角连线
               style[mxConstants.STYLE_ROUNDED] = true;
                //labelsize
                style[mxConstants.STYLE_FONTSIZE] = 18;
                //label位置
                style[mxConstants.STYLE_SPACING_BOTTOM] = 30;
                this.initProcessData();
            },
            initProcessData(){
                const parent = graph.getDefaultParent();
                const model = utils.copyObject(this.oriData);
                if(model.nodeList.length <= 0)return;
                var lines = model.lineList || [];
                var nodes = model.nodeList || [];
                nodes.map((item)=>{
                    var info = {
                        key: item.key,
                        name: item.name,
                        state: item.state
                    }
                    this.addCell(info, item);
                });
                lines.map((item)=>{
                    var sourceCell = this.getCellById(item.source);
                    var targetCell = this.getCellById(item.target);
                    if(!sourceCell || !targetCell)return;
                    var line = graph.insertEdge(graph.getDefaultParent(), item.key, "", sourceCell, targetCell);
                    this.setCellStyle('strokeColor', colorMap[item.state], [line]);
                });
                // 自动布局
                var layout = new mxHierarchicalLayout(graph,mxConstants.DIRECTION_WEST);
                layout.execute(graph.getDefaultParent());
                this.adjustPos(); // 调整位置,让流程图剧中
            },
            adjustPos(){
                var bounds = graph.getGraphBounds();
                var margin = margin || 10;
                graph.container.style.overflow = "hidden";
                graph.view.setTranslate(
                    -bounds.x -(bounds.width - graph.container.clientWidth)/ 2,
                    -bounds.y - (bounds.height - graph.container.clientHeight) / 2
                );
                while( (bounds.width + margin * 2) > graph.container.clientWidth
                        || (bounds.height + margin * 2) > graph.container.clientHeight ){
                    graph.zoomOut();
                    bounds = graph.getGraphBounds();
                }
                graph.container.style.overflow = "auto";
            },
            getCellById(id){
                var cells = graph.getChildVertices(graph.getDefaultParent());
                var nodes = cells.filter((item)=>{
                    return item.id == id;
                });
                if(nodes.length > 0)return nodes[0];
            },
            addCell(info){
                /*info{
                    key,//节点唯一标识
                    name, //节点label
                    state:
                }*/
                if(!info)return;
                // 清除默认样式
                var style = 'text;strokeColor=none;fillColor=none;html=1;whiteSpace=wrap;verticalAlign=middle;overflow=hidden;';
                // 节点html结构
                var html = '<div class="cirlce">'+info.name+'</div>'
                // 创建节点
                var cell = new mxCell(html, new mxGeometry(0, 0, 65, 85), style);
                // 设置cell为节点(在mxgraph中,链接线段也属于一种cell,所以这里新建了cell以后要设置它的类型)
                cell.setVertex(true);
                // 添加节点到画布
                graph.addCell(cell);
                if(info.key){
                    cell.setId(info.key);
                }
            },

            setCellStyle(key, value, cells){
                if(!cells)return;
                graph.setCellStyles(key, value, cells);
                //graph.refresh(cell);
            }
        },
        watch: {
            oriData(){
                this.initProcessData();
            }
        }
    }
</script>

 浙公网安备 33010602011771号