linux perf工具测试程序cpu cache刷回实验【转】
一、perf安装
进入自己编译的内核,一般目录是:
/usr/src/linux-x.x.x/tools/perf编译安装之后,即可使用
-
make
-
make install
perf的使用可以查看本文参考文献1,下面介绍一下perf工具中与cache相关的内容
sudo perf list cache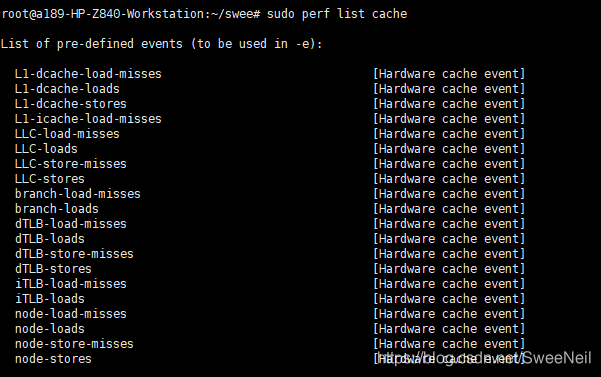
与cache有关的事件都是Hardware cache event,这类的事件依赖于PMU(performance monitoring unit),一般处理器厂商都会在硬件中加入了 PMU 单元, PMU可以让我们对某种硬件事件设置counter,一旦发生这种事件,处理器就会统计该事件发生的次数,一旦发生的次数超过设置的counter,便会产生中断。
可以看到与刷回有关的事件是:LLC-stores
下面结合一个程序,来了解perf对于应用程序cacheline刷回事件的追踪~
二、测试程序
测试程序结合参考文献2、3进行编写,测试程序主要分为四个小部分:
- normal 普通的cpu cache测试程序;
- clflush 使用clflush指令刷回cacheline
- revise 将数组角标 i,j替换后的cache测试程序
- other revise版本使用clflush指令刷回cacheline
完整代码 test.c :
#include <stdio.h>

#include <unistd.h>

#include <string.h>

#include <x86intrin.h>


int main(int argc, char **argv)

{

int a[1000][1000];

if(strcmp(argv[1],"normal") == 0)

{

printf("normal \n");

for(int i = 0; i < 1000; ++i)

{

for(int j = 0; j < 1000; ++j)

{

a[i][j] = i + j;

}

}

}


else if(strcmp(argv[1],"clflush") == 0)

{

printf("clflush \n");

for(int i = 0; i < 1000; ++i)

{

for(int j = 0; j < 1000; ++j)

{

a[i][j] = i + j;

_mm_clflush(&a[j][i]);

}

}

}


else if(strcmp(argv[1],"revise") == 0)

{

printf("revise \n");

for(int i = 0; i < 1000; ++i)

{

for(int j = 0; j < 1000; ++j)

{

a[j][i] = i + j;

}

}

}


else

{

printf("other \n");

for(int i = 0; i < 1000; ++i)

{

for(int j = 0; j < 1000; ++j)

{

a[j][i] = i + j;

_mm_clflush(&a[j][i]);

}

}

}


return 0;

}
编译:
gcc test.c -msse2 -o test运行:
perf stat -e LLC-stores ./test parameter运行结果:
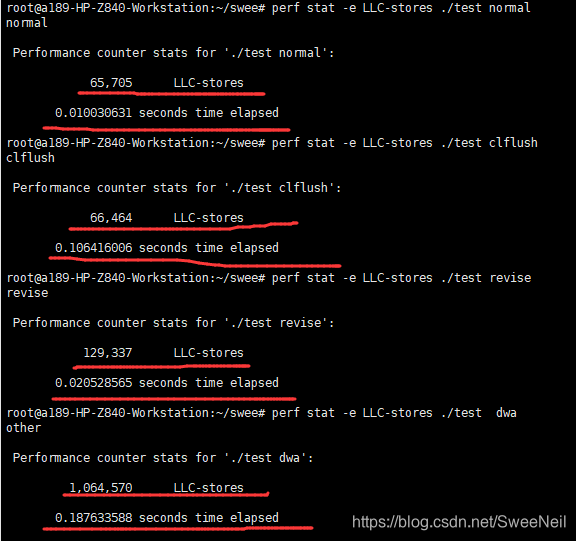
三、结果分析
1、normal版本,是cache友好型程序,它的刷回最少,运行时间最短
2、clflush版本,按照clflush指令来说,每调用一次clflush指令应该都会对cacheline进行刷回,那么刷回的次数应该是 1000 * 1000 = 1,000,000次才对,但是刷回次数却和normal版本一致,这个原因未知~ 在时间消耗上,clflush是normal版本的10倍,说明clflush指令还是有一定的影响。
3、revise版本,对cache不算很友好,LLC-stores是normal的两倍,由于它缓存不友好,多刷回可以理解,时间是normal版本的两倍
4、other版本,对cache版本不友好,且每次都刷回,所以刷回次数和时间最长,这个可以理解
存在疑问的地方就是clflush版本,为什么刷回次数和normal一致了,可能是perf采样算法的原因~
四、参考
[1] 《[非易失内存编程] 通过编译器内置函数 (Intrinsic Functions) 发射 CLFLUSH、CLFLUSHOPT、CLWB、NTSTORE、MFENCE、SFENCE 等指令》https://blog.csdn.net/maokelong95/article/details/81362837
[2] 《系统级性能分析工具perf的介绍与使用》 http://blog.itpub.net/24585765/viewspace-2564885/
[3] 《用linux perf命令来分析程序的cpu cache miss现象》https://blog.csdn.net/stpeace/article/details/80933940
[4] 《Perf 简介》,这个对perf的利用描述还是挺详细的

 浙公网安备 33010602011771号