

一、在nginx主机上安装filebeat组件
[root@zabbix_server nginx]# cd /usr/local/src/
[root@zabbix_server src]# wget https://artifacts.elastic.co/downloads/beats/filebeat/filebeat-6.2.4-x86_64.rpm
[root@zabbix_server src]# yum localinstall filebeat-6.2.4-x86_64.rpm
二、配置filebeat配置文件
[root@zabbix_server src]# vim /etc/filebeat/filebeat.yml
filebeat.prospectors:
  - type: log
    enabled: true
    json.keys_under_root: true    #json格式收集
    json.overwrite_keys: true       #json格式收集
    paths:
      - /var/log/nginx/access.log  #需要收集的日志文件路径
    fields:
      log_topics: nginx-172.28.18.75 #设置日志标题

  output.logstash:
    hosts: ["172.28.18.69:10001"]  #输出到logstash服务地址和端口
三、配置nginx.conf文件,设置json格式日志
[root@zabbix_server src]# vim /etc/nginx/nginx.conf
    log_format access_json_log  '{"@timestamp":"$time_local",'
                                  '"http_host":"$http_host",'
                                  '"clinetip":"$remote_addr",'
                                  '"request":"$request",'
                                  '"status":"$status",'
                                  '"size":"$body_bytes_sent",'
                                  '"upstream_addr":"$upstream_addr",'
                                  '"upstream_status":"$upstream_status",'
                                  '"upstream_response_time":"$upstream_response_time",'
                                  '"request_time":"$request_time",'
                                  '"http_referer":"$http_referer",'
                                  '"http_user_agent":"$http_user_agent",'
                                  '"http_x_forwarded_for":"$http_x_forwarded_for"}';

    access_log  /var/log/nginx/access.log  access_json_log;
四、检查配置文件语法,并重载
[root@zabbix_server src]# nginx -tc /etc/nginx/nginx.conf
nginx: the configuration file /etc/nginx/nginx.conf syntax is ok
nginx: configuration file /etc/nginx/nginx.conf test is successful
[root@zabbix_server src]# nginx -s reload
五、查看access.log日志输出
[root@zabbix_server src]# tail -f /var/log/nginx/access.log
{"@timestamp":"15/Jul/2019:10:33:23 +0800","http_host":"zabbix.9500.cn","clinetip":"219.239.8.14","request":"POST /zabbix.php?sid=311c76f6740bc2f7&action=widget.problems.view HTTP/1.1","status":"200","size":"33684","upstream_addr":"127.0.0.1:9000","upstream_status":"200","upstream_response_time":"1.103","request_time":"1.103","http_referer":"http://zabbix.9500.cn/zabbix.php?action=dashboard.view&ddreset=1","http_user_agent":"Mozilla/5.0 (Windows NT 6.1; WOW64) AppleWebKit/537.36 (KHTML, like Gecko) Chrome/49.0.2623.221 Safari/537.36 SE 2.X MetaSr 1.0","http_x_forwarded_for":"-"}
{"@timestamp":"15/Jul/2019:10:33:23 +0800","http_host":"zabbix.9500.cn","clinetip":"219.239.8.14","request":"POST /zabbix.php?sid=9203532d28b920b3&action=widget.problems.view HTTP/1.1","status":"200","size":"33856","upstream_addr":"127.0.0.1:9000","upstream_status":"200","upstream_response_time":"0.759","request_time":"0.759","http_referer":"http://zabbix.9500.cn/zabbix.php?action=dashboard.view&ddreset=1","http_user_agent":"Mozilla/5.0 (Windows NT 6.1; WOW64) AppleWebKit/537.36 (KHTML, like Gecko) Chrome/63.0.3239.132 Safari/537.36","http_x_forwarded_for":"-"}
已经变成json格式的日志输出了。
六、在logstash服务器上的/etc/logstash/conf.d/目录下,新建一个nginx.conf文件
用于监听10001端口,负责收集filebeat传递过来的日志数据,并向elasticseatch服务发送日志数据
[root@server-1 conf.d]# vim /etc/logstash/conf.d/nginx.conf
input {
  beats {
   port=>10001   #监听filebeat发送日志的端口
  }
}

output {
  if[fields][log_topics]=="nginx-172.28.18.75"{   #判断是否是filebeat配置设置的fields字段,是则发送到elastcisearch
    elasticsearch {
     hosts=>["172.28.18.69:9200"]
     index=>"nginx-172.28.18.75-%{+YYYY.MM.dd}"   #设置索引名字
    }
  }
}
七、重启logstash服务,并查看端口
[root@server-1 conf.d]# systemctl restart logstash
[root@server-1 conf.d]# netstat -tunlp|grep 10001
tcp6       0      0 :::10001                :::*                    LISTEN      26599/java
启动成功
八、重启nginx主机上的filebeat服务
[root@zabbix_server src]# systemctl restart filebeat
九、查看elasticsearch服务器上是否有新建的索引
[root@zabbix_server etc]# curl 172.28.18.69:9200/_cat/indices?v
health status index                         uuid                   pri rep docs.count docs.deleted store.size pri.store.size
green  open   .kibana                       nQhtAX5YSSKzT1p0G-1XtA   1   0          4            0     25.2kb         25.2kb
yellow open   nginx-172.28.5.214-2019.07.15 tH8oVfZhQy-TdnIPHyFgvQ   5   1    2106272            0    668.8mb        668.8mb
yellow open   system-syslog-2019.07         REp7fM_gSaquo9PX2_sREQ   5   1   10772928            0      2.6gb          2.6gb
可以看到日志已经成功收集到elasticsearch服务器上了
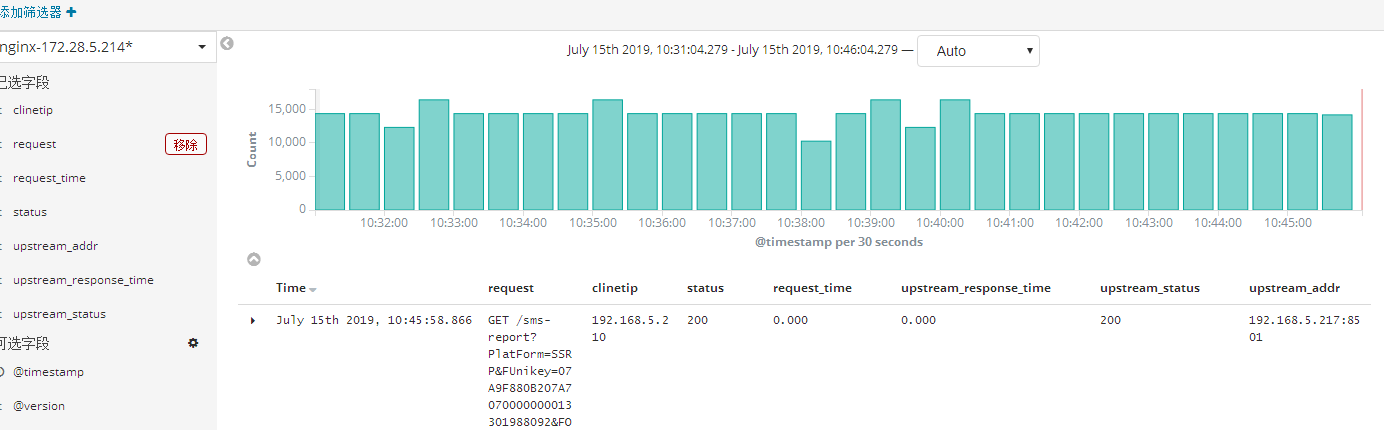
十、配置kibana,展示日志数据
系统管理---索引模式--创建索引模式

发现菜单里已经可以看到数据了

 浙公网安备 33010602011771号