echarts雷达图点击事件 包含(2.x,3.85,4.02)测试
最近看见别人问的问题,点击雷达图的拐点,获取点击数据的问题,直接上代码。
echarts 2x 的点击事件
echarts配置问题:https://www.douban.com/note/509404582/

<!doctype html>
<html lang="us">
<head>
	<meta charset="utf-8">
	<title></title>
	<script src="http://echarts.baidu.com/build/dist/echarts.js"></script>
</head>
<body>
	<div id="main" style="width: 600px;height:400px;"></div>
</body>
</html>
<script>

	//配置图表路径
	require.config({
		paths:{
			echarts:'http://echarts.baidu.com/build/dist'
		}
	});
	//加载图表js文件
	require(
	   [
		   'echarts',
		   'echarts/chart/radar',  //要什么图表类型配置什么类型
	   ],
	function (ec){
		//基于准备好的dom,初始化echarts图表
		var myChart= ec.init(document.getElementById('main'));
		var option = {
				polar: [{
					indicator: [
						{ text: '销售', max: 6500},
						{ text: '管理', max: 16000},
						{ text: '信息技术', max: 30000},
						{ text: '客服', max: 38000},
						{ text: '研发', max: 52000},
						{ text: '市场', max: 25000}
					]
				}],
				series: [{
					name: "",
					type: "radar",
					data: [{
						value: [4300, 10000, 28000, 35000, 50000, 19000],
						name: "预算分配"
					}],
					itemStyle: {
						normal: {
							color: "#1DBB37"
						}
					}
					},{
					name: "",
					type: "radar",
					data: [{
						value: [5000, 14000, 28000, 31000, 42000, 21000],
						name: "实际开销"
					}],
					itemStyle: {
						normal: {
							color: "rgb(51, 153, 254)"
						}
					}
					}
				],
		};

		var ecConfig = require('echarts/config');
		myChart.on(ecConfig.EVENT.CLICK,function(param){
			//点击后执行操作
			alert(param.name)
		});
		myChart.setOption(option);
	});
</script>
echarts 3.x && 4.x 的点击事件
测试版本 3.85和4.02版本
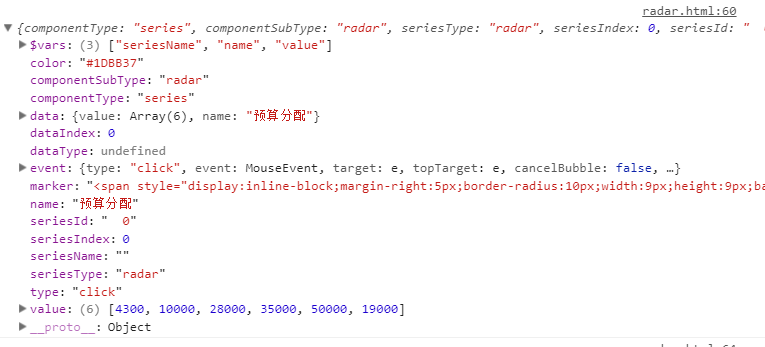
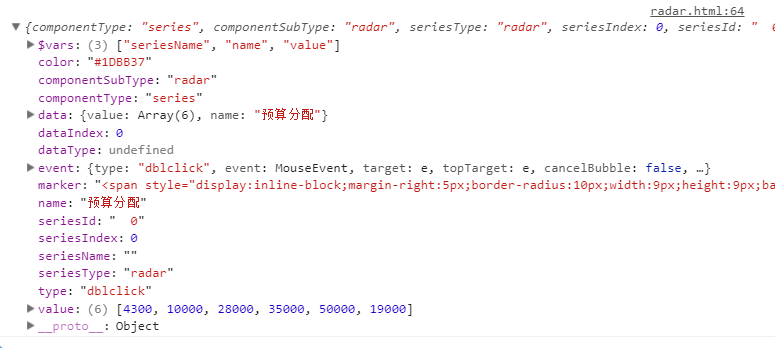
var dom = document.getElementById("container");
    var myChart = echarts.init(dom);

    var option = {
            polar: [{
                indicator: [
                    { text: '销售', max: 6500},
                    { text: '管理', max: 16000},
                    { text: '信息技术', max: 30000},
                    { text: '客服', max: 38000},
                    { text: '研发', max: 52000},
                    { text: '市场', max: 25000}
                ]
            }],
            series: [{
                name: "",
                type: "radar",
                data: [{
                    value: [4300, 10000, 28000, 35000, 50000, 19000],
                    name: "预算分配"
                }],
                itemStyle: {
                    normal: {
                        color: "#1DBB37"
                    }
                }
                },{
                name: "",
                type: "radar",
                data: [{
                    value: [5000, 14000, 28000, 31000, 42000, 21000],
                    name: "实际开销"
                }],
                itemStyle: {
                    normal: {
                        color: "rgb(51, 153, 254)"
                    }
                }
                }
            ],
    };

    //单击后执行操作
    myChart.on('click',(param) => {
        console.log(param)
    });
    // 双击事件
    myChart.on('dblclick', (param) => {
        console.log(param)
    })

    myChart.setOption(option);
单击事件参数返回
双击事件参数返回
echarts鼠标事件说明(4.02版本)
{
    // 当前点击的图形元素所属的组件名称,
    // 其值如 'series'、'markLine'、'markPoint'、'timeLine' 等。
    componentType: string,
    // 系列类型。值可能为:'line'、'bar'、'pie' 等。当 componentType 为 'series' 时有意义。
    seriesType: string,
    // 系列在传入的 option.series 中的 index。当 componentType 为 'series' 时有意义。
    seriesIndex: number,
    // 系列名称。当 componentType 为 'series' 时有意义。
    seriesName: string,
    // 数据名,类目名
    name: string,
    // 数据在传入的 data 数组中的 index
    dataIndex: number,
    // 传入的原始数据项
    data: Object,
    // sankey、graph 等图表同时含有 nodeData 和 edgeData 两种 data,
    // dataType 的值会是 'node' 或者 'edge',表示当前点击在 node 还是 edge 上。
    // 其他大部分图表中只有一种 data,dataType 无意义。
    dataType: string,
    // 传入的数据值
    value: number|Array
    // 数据图形的颜色。当 componentType 为 'series' 时有意义。
    color: string
}
还有一个就是给雷达图的文字绑定点击事件,上代码。api地址:http://echarts.baidu.com/tutorial.html#ECharts%20%E4%B8%AD%E7%9A%84%E4%BA%8B%E4%BB%B6%E5%92%8C%E8%A1%8C%E4%B8%BA
注意triggerEvent属性的设置。

<!doctype html>
<html lang="us">
<head>
	<meta charset="utf-8">
	<title></title>
	<script src="echarts.min.js"></script>
</head>
<body>
	<div id="main" style="width: 600px;height:400px;"></div>
</body>
</html>
<script>
	//绑定元素
	var myChart = echarts.init(document.getElementById('main'));

	option = {
		title: {
			text: '基础雷达图'
		},
		radar: {
			indicator: [
			   { name: '销售', max: 6500},
			   { name: '管理', max: 16000},
			   { name: '信息技术', max: 30000},
			   { name: '客服', max: 38000},
			   { name: '研发', max: 52000},
			   { name: '市场', max: 25000}
			],
			name:{
				formatter:function(v){
					console.log(v);
					return v;
				}
			},
			triggerEvent:true
		},
		series: [{
			name: '预算vs开销',
			type: 'radar',
			data : [
				{
					value : [4300, 10000, 28000, 35000, 50000, 19000],
					name : '预算分配'
				},
				 {
					value : [5000, 14000, 28000, 31000, 42000, 21000],
					name : '实际开销'
				}
			]
		}]
	};
	//绘制图表
	myChart.setOption(option);
	//添加点击事件
	myChart.on('click', function (params) {
		console.log(params)
		alert(params.name)
		if(params.name=="研发"){ //判断点击文字
			alert("aaa")
		}
	 })
</script>
params的返回值

个人觉得echarts的文档和功能还不太丰富,highcherts也是一个不错的选择。
highcharts雷达图(highcharts叫蜘蛛图),案例链接:https://www.hcharts.cn/demo/highcharts/polar-spider
<!doctype html>
<html lang="us">
<head>
    <meta charset="utf-8">
    <title></title>
</head>
<body>
    <div id="main" style="height:400px;"></div>
</body>
</html>
<script src="jquery.js"></script>
<script src="highcharts.min.js"></script>
<script src="highcharts-more.js"></script>
<script>
     $(function () {
        Highcharts.chart('main', {
            chart: {
                polar: true   //图表类型
            },
            xAxis: {
                categories: ['Jan', 'Feb', 'Mar', 'Apr', 'May', 'Jun', 'Jul', 'Aug', 'Sep', 'Oct', 'Nov', 'Dec']
            },
            plotOptions: {   //数据配置项
                series: {
                    cursor: 'pointer',
                    point: {
                        events: {
                            click: function () {
                                alert(this.category);
                            }
                        }
                    }
                }
            },
            series: [{
                data: [29.9, 71.5, 106.4, 129.2, 144.0, 176.0, 135.6, 148.5, 216.4, 194.1, 95.6, 54.4]
            }]
        });
    });
</script>
highcharts有一个问题,文件体积比较大,如果图表使用的地方比较少,功能要求不高时,建议不使用,性能差点。
github查看更多好文:[https://github.com/xccjk/x-blog](https://github.com/xccjk/x-blog)

 浙公网安备 33010602011771号