Two kinds of item classification model architecture
Posted on 2017-10-10 16:23 MaHaLo 阅读(292) 评论(0) 收藏 举报Introduction:
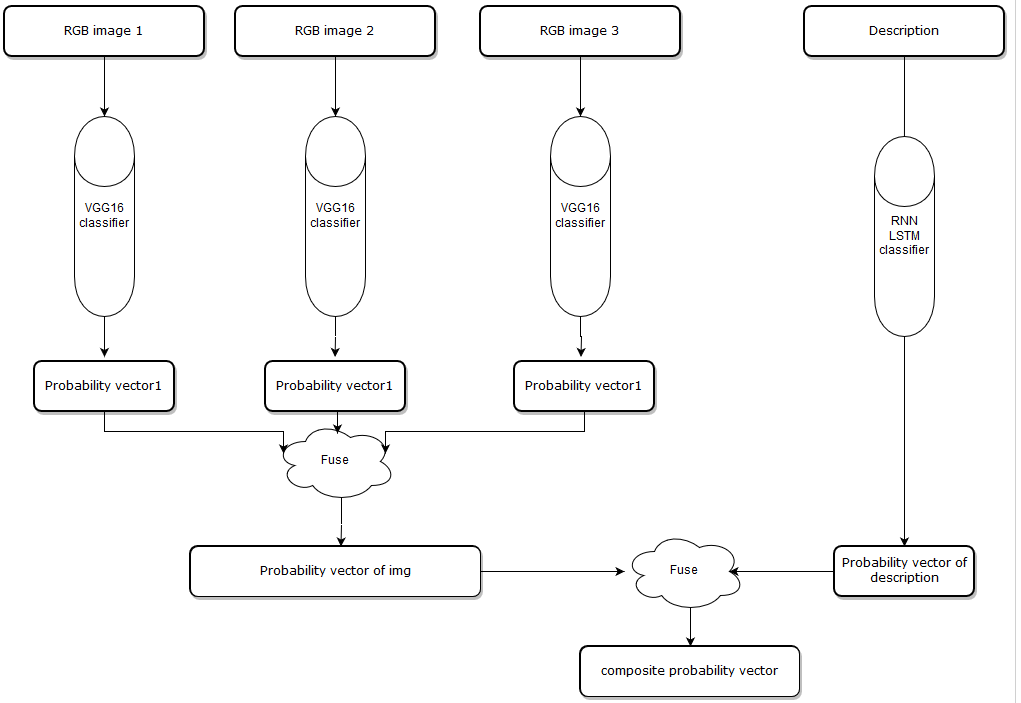
Introduction to Fusing-Probability model:
Cause the input has two parts, one is item images, the number of images can be 1 to N, one is item description contains several words. The main idea of Fusing-Probability is predicting on these features individually, and we have two classifiers, on the image side, we use VGG16 deep learning architecture which is a convolutional neural network to produce a probability for each image, and in the description side, we use an LSTM network to train a model to classify the text features. Then I use an algorithm to put all probability vectors together, finally, we get a composite probability vector, more about the algorithm can be found here https://github.com/solitaire2015/Machine-Learning-kernels/blob/master/composite-score/Composite_Score_Solution.ipynb.
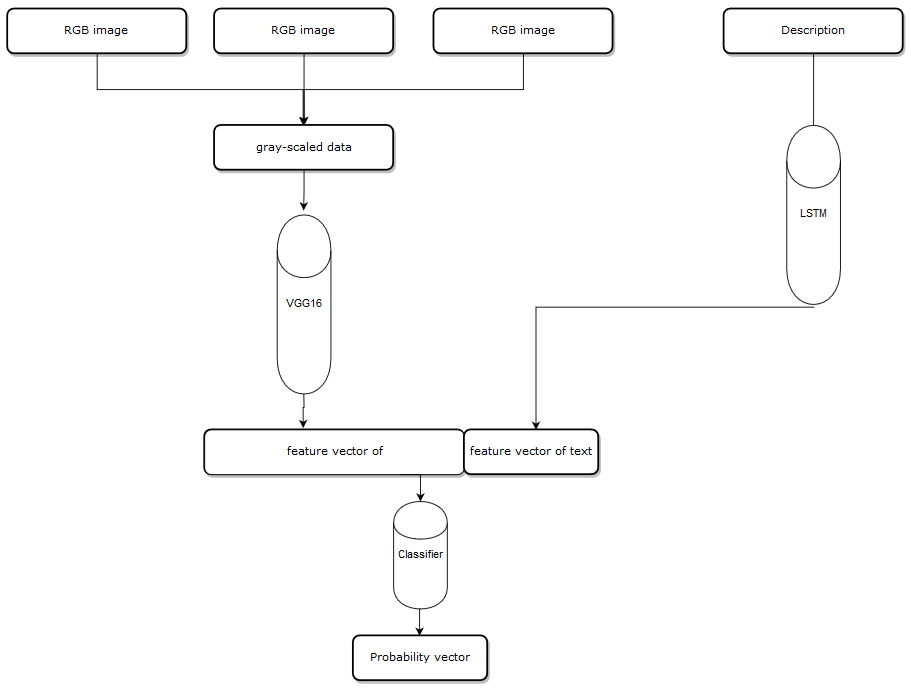
Introduction to Multi-Task model:
The main difference between these two models is we combine all features first, and put it into a single classifier, first, I choose first 3 images and convert them into gray-scale image, the shape of an RGB image is (width,height,3) because there are three channels in an RGB image, and the shape of gray-scaled image is (width,height) there is only one channel, and I combine three gray-scaled images into one data block which has shape(width,height,3). Then, we put it in the VGG16 model, instead of getting a probability vector, we get the feature vector after the last pooling layer, now we get a feature vector from the images, on the description side, same as before ,we put the description into the LSTM model, we get text feature before the model produce a probability vector, and we combine two feature vectors. then put the vector to a classifier and get the final probability vector.
Multi-Task model architecture:
Fusing-Probability model architecture:
Validation:
I test two architectures on the same data set. the data set has 10 classes:
'Desktop_CPU',
'Server_CPU',
'Desktop_Memory',
'Server_Memory',
'AllInOneComputer',
'CellPhone',
'USBFlashDrive',
‘Keyboard',
‘Mouse',
‘NoteBooks',
And the data set contains 5487 items, the Fusing-Probability model gets 93.87% accuracy, the Multi-Task model gets 93.38% accuracy, I have several figures to show the difference between two architectures.
1. Items that model predict successfully and the probability distribution.
Fusing-Probability Multi-Task
2. Items that model doesn't predict success and the probability distribution.
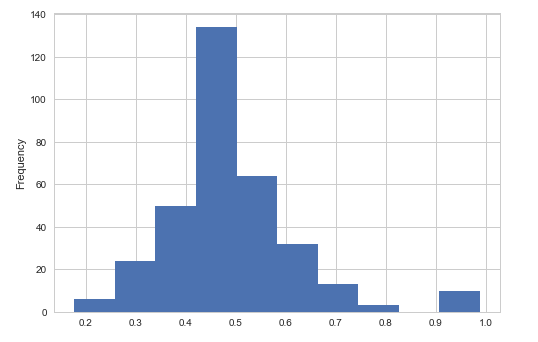
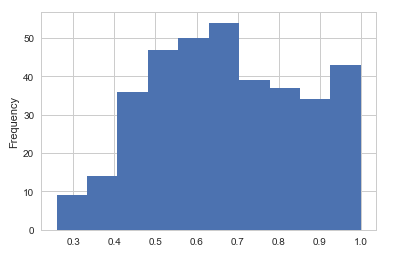
Fusing-Probability Multi-Task
3. Fraction map of the accuracy on each class.
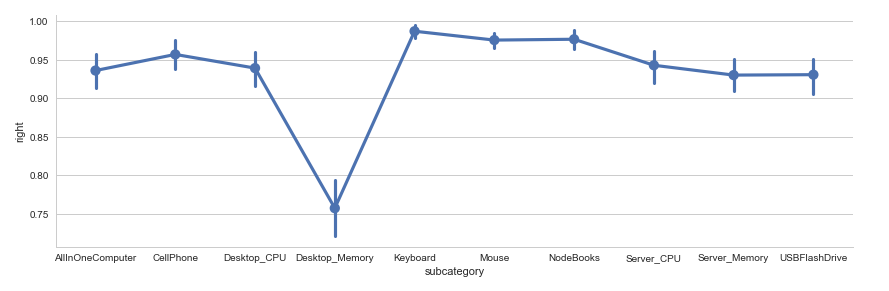

Fusing-Probability Multi-Task
4.Curve figure.
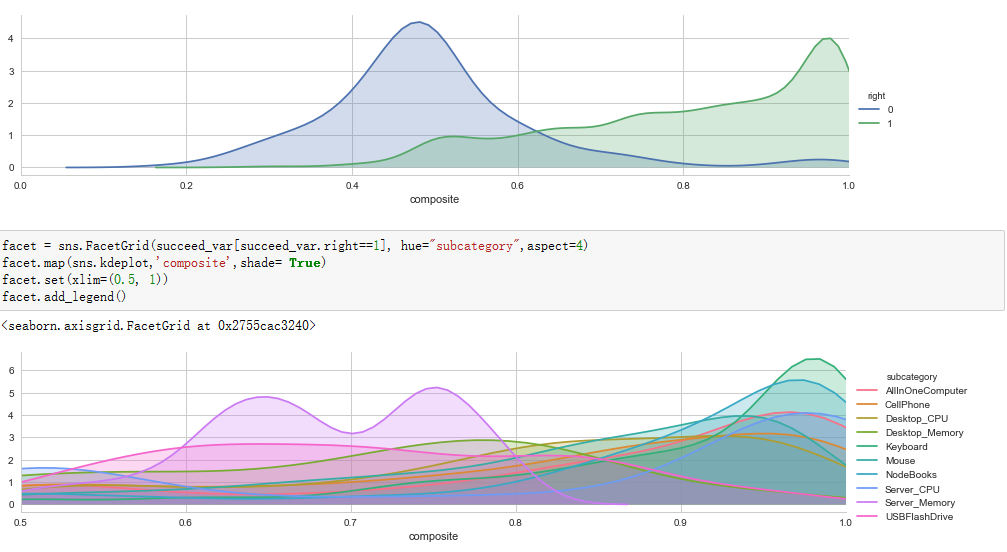
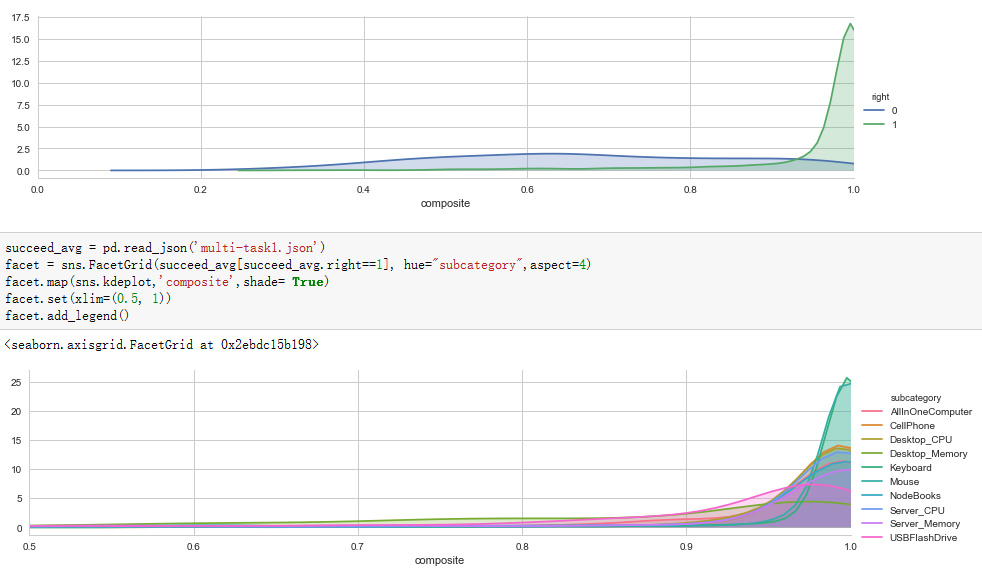
Fusing-Probability Multi-Task
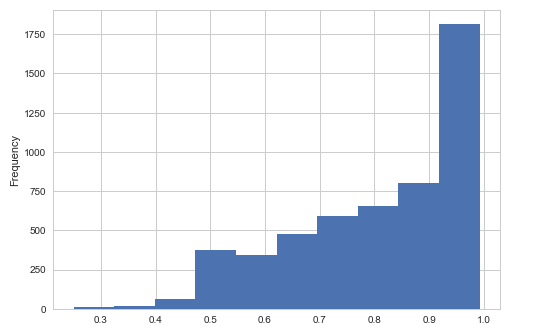
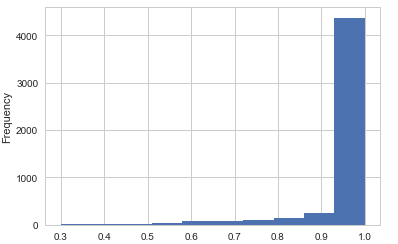
5. Histogram.
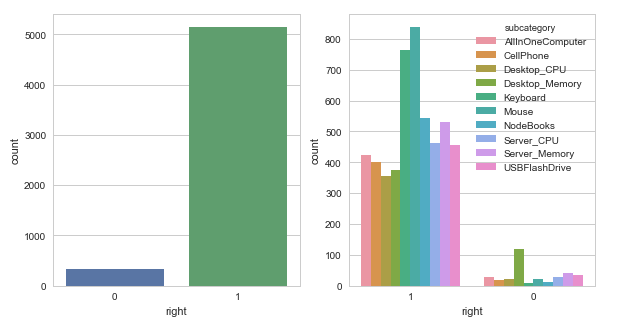
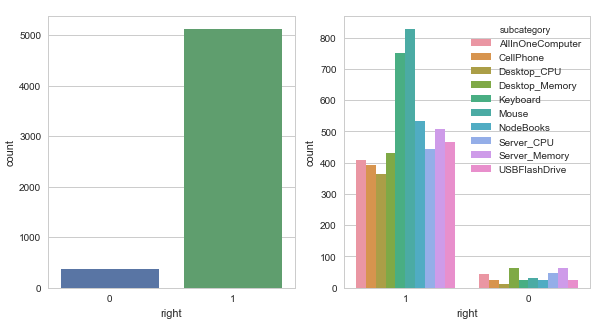
Fusing-Probability Multi-Task
Analysis of the figures:
First, let's look at the first couple of figures, the figure in left panel is the histogram of the probability the Fusing-Probability model successfully predicted, the right panel figure comes from the Multi-Task model, most right answers have a probability greater than 0.9 in the Multi-Task model, but in Fusing-Probability model there are some right answers have a lower probability. From this view Multi-Task model is better.
Second, we can get some information from a second couple of figures, it shows the histogram of the probability that models predict a wrong result. The probability centralizes on about 0.5 from the Fusing-Probability model, I need to mention that some results get a high probability greater than 0.9, they are really wrong, the data is not so clean and has some misclassified items. Look at the right panel, we can't find any relationship. So, Fusing-Probability model is better.
3th, a fraction map shows model accuracy on each class, we can find that the desktop-memory has the lowest accuracy in both models, there are some items really hard to say if it's a desktop memory or server memory even for a real person. But on other classes, the Fusing-Probability model has higher accuracy than another model, Fusing-Probability is better.
4th, it's a couple of curve figures of right and wrong predictions, we can easily find a reasonable threshold from the left panel, because most wrong predictions has about 0.5 probability, we can use a threshold as 0.63 when we use the model to divide all predictions in to certain and not sure group, but in Multi-Task model we can't get a very meaningful threshold. So, Fusing-Probability model is better.
5th, a couple of histograms, the Fusing-Probability model gets higher accuracy, except desktop-memory class, the model works fine, the reason why the Mouse and Keyboard class have most right predictions are we have more samples on these two sets.
Finally, we can find the Fusing-Probability model works better than Multi-Task model.
Pros & cons:
Multi-Task model:
Easily to train, get higher probability when it predicts right, but when we have a very limit data set we can't do data augmentation on the data set, because there is not a good way to produce more data on text, if we only do data augmentation on images, the text will be more important, the image will be useless. The model easily gets overfitting. the image input part is a set of images, the order would not influence the result, but this model treats the first image more important, and we can have at most 3 images, we will lose some information if there are more than 3 images. we convert the RGB image into gray-scaled image we may miss some important features.
Fusing-Probability model:
We can do data augmentation separately because we train different models on image input and text input, we can find a more reasonable threshold for each class, base on the probability fusing algorithm, we can have any number of images, and the model won't consider the order of images.The model has more flexibility.

 浙公网安备 33010602011771号