
关系图的操作,官网 https://www.relation-graph.com/#/docs/start-vue3
1.安装relation-graph-vue3
参照官网
2.图形显示
<template>
  <div>
    <div style="border: #efefef solid 1px; height: calc(100vh - 100px);width: 100%;">
      <relation-graph ref="graphRef$" :options="options" />
    </div>
  </div>
</template>

<script setup lang="ts">
import { onMounted, ref } from 'vue'
import RelationGraph from 'relation-graph-vue3'
const graphRef$ = ref<RelationGraph>()
const options = {
  defaultExpandHolderPosition: 'right'
}
onMounted(() => {
  const jsonData = {
    rootId: 'a',
    nodes: [
      { id: 'a', text: 'a', },
      { id: 'b', text: 'b', },
      { id: 'c', text: 'c', },
      { id: 'd', text: 'd', },
      { id: 'e', text: 'e', },
      { id: 'f', text: 'f', },
    ],
    lines: [
      { from: 'a', to: 'b', },
      { from: 'a', to: 'c', },
      { from: 'a', to: 'd', },
      { from: 'a', to: 'e', },
      { from: 'a', to: 'f', },
    ],
  }
  // The node and line in the above data can refer to the options in "Node" and "Link & Line" for configuration.
  // Node: https://www.relation-graph.com/#/docs/node
  // Link & Line: https://www.relation-graph.com/#/docs/link
  graphRef$.value.setJsonData(jsonData)
  // The graphRef$.value.setJsonData(jsonData, callback) method is a convenient method that is equivalent to the following code:
  //  const graphInstance = graphRef$.value.getInstance(); //获取实例
  //  graphInstance.addNodes(jsonData.nodes); //添加节点
  //  graphInstance.addLines(jsonData.lines); // 添加关系
  //  graphInstance.rootNode = graphInstance.getNodeById(jsonData.rootId); 获取跟节点
  //  await graphInstance.doLayout(); // Layout using the layouter set in graphOptions  重绘
  //  await graphInstance.moveToCenter(); // Find the center based on node distribution and center the view 视角居中
  //  await graphInstance.zoomToFit(); // Zoom to fit, so that all nodes can be displayed in the visible area 缩放到合适大小
})
</script>
3.添加节点
 const graphInstance = graphRef.value?.getInstance();
                graphInstance.addNodes([
                    {
                        id: id,
                        text: `${name}${nodes.length + 1}`,
                        color: "#09819C", // dragObj.value == "fx" ? "#09819C" : "#7FAE1B",
                        x: canvasCoordinate.x,
                        y: canvasCoordinate.y,
                        data: {
                            type: dragObj.value,
                            name1: i18n.global.t('mechanism_model.export') + `${nodes1.length + 1}`,
                            dataType: 'float'
                        },
                    },
                    // {
                    //     id: id1,
                    //     text: '输出',
                    //     color: "#EE914D", // dragObj.value == "fx" ? "#09819C" : "#7FAE1B",
                    //     data: {
                    //         type: '输出'
                    //     },
                    // },
                ]);
4.添加关系
const graphInstance = graphRef.value?.getInstance();
graphInstance.addLines([
                        {
                            from: id, //起点
                            to: id1 //终点
                        }
                    ])
5.移出节点
const graphInstance = graphRef.value.getInstance();
graphInstance.removeNodeById(currentObject.value.id); //移除
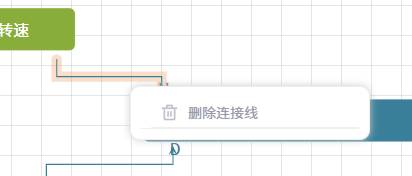
6.解除关系
const graphInstance = graphRef.value?.getInstance();
graphInstance.removeLinkById(currentObject.value.seeks_id);
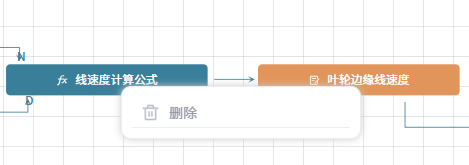
7.鼠标右键弹窗
  <RelationGraph ref="graphRef" :options="graphOptions" :on-node-click="onNodeClick"
                        @contextmenu="onContextmenu">
                        <template #graph-plug>
                            <div v-if="isShowNodeTipsPanel && route.query.type !== 'view'" :style="{
                                left: nodeMenuPanelPosition.x + 'px',
                                top: nodeMenuPanelPosition.y + 'px',
                            }" class="c-right-menu-panel" style="min-width: 240px">
                               删除

                            </div>
                            <!-- <RGEditingConnectController /> -->
                        </template>

                    </RelationGraph>
const onContextmenu = ($event, objectType, object) => {
// node 右键菜单
const graphInstance = graphRef.value?.getInstance();
currentObjectType.value = objectType;
currentObject.value = object;
const _base_position = graphInstance?.getBoundingClientRect();
isShowNodeTipsPanel.value = true;
nodeMenuPanelPosition.value.x = $event.clientX - _base_position.x + 10;
nodeMenuPanelPosition.value.y = $event.clientY - _base_position.y + 10;
const hideContentMenu = () => {
isShowNodeTipsPanel.value = false;
document.body.removeEventListener("click", hideContentMenu);
};
document.body.addEventListener("click", hideContentMenu);
};
8.碰撞检测 node1和node2 重叠
import {
    RGNodesAnalyticUtils,
} from "relation-graph-vue3";
const { RGNodesAnalytic } = RGNodesAnalyticUtils;
const nodeBox = {
       el: node1.el,
       x: newX,
       y: newY,
};
const shapeA =node1.nodeShape || graphInstance?.options.defaultNodeShape || 0;
const shapeB = node2.nodeShape || graphInstance?.options.defaultNodeShape || 0;
const overlap = RGNodesAnalytic.shapesOverlap(nodeBox, node2, shapeA, shapeB);
            if (overlap) {
                //重叠
            }
9.拖拽添加
9.1.拖拽部分就使用正常的拖拽
div :title="name" draggable="true" @dragstart="(e) => onDragStart(e, dataRef)"
                                            @drag="(e) => onDraging(e, dataRef)" :style="{ width: '200px' }" style="
                                    white-space: nowrap;
                                    overflow: hidden;
                                    text-overflow: ellipsis;
                                ">
                                            {{ name }}
                                        </div>
const onDragStart = (e, node) => {
// 拖拽
dragObj.value = '';
// 判断是否在虚拟测点list里面
if (vPonitList.value.findIndex(point => point.key == node.key) == -1) {
node.shadowId = selectAsset.value.id;
dragObj.value = node;
} else {
message.error(i18n.global.t('mechanism_model.config_input_error'))
}
}
const onDraging = (e, node) => {
// 拖拽ing
// 验证是否重叠
if (vPonitList.value.findIndex(point => point.key == node.key) == -1) {
emits('checkOverlap', e)
}
}
9.2.拖拽完成
 <div class="editor" @drop="onDrop" @dragover.prevent>
<RelationGraph ref="graphRef" :options="graphOptions" :on-node-click="onNodeClick"
                        @contextmenu="onContextmenu">
                        <template #graph-plug>
                            <div v-if="isShowNodeTipsPanel && route.query.type !== 'view'" :style="{
                                left: nodeMenuPanelPosition.x + 'px',
                                top: nodeMenuPanelPosition.y + 'px',
                            }" class="c-right-menu-panel" style="min-width: 240px">


                            </div>
                            <!-- <RGEditingConnectController /> -->
                        </template>

                    </RelationGraph>
</div>

const onDrop = (event) => {
        //获取详情
        newNodePos.value.x = event.x;
        newNodePos.value.y = event.y;
        // 开始添加节点
        _startAddNode();
    }


    const _startAddNode = async () => {
        // name 根据类型产生
        let name = 1111// 拖拽添加节点
        const graphInstance = graphRef.value?.getInstance();
        // 唯一id
        let id = uuidv4();
        // 获取有多少个公式
        let nodes = graphInstance.getNodes().filter(node => node.data?.type == dragObj.value)
        if (graphInstance) {
      //坐标转换
            const canvasCoordinate = graphInstance.getCanvasCoordinateByClientCoordinate({
                x: newNodePos.value.x,
                y: newNodePos.value.y,
            });
            // 输入框和公式不一样  拖动公式默认会带出来一个输出框
                let arr = [
                    {
                        id: id,
                        text: `${name}${nodes.length + 1}`,
                        color: "#7FAE1B",
                        x: canvasCoordinate.x,
                        y: canvasCoordinate.y,
                        data: {
                            type: dragObj.value,
                        },
                    },
                ]
                graphInstance.addNodes(arr);
            // 聚焦到这个id
            // await graphInstance.focusNodeById(id); // 聚焦第一个
        }
        dragObj.value = "";
    };
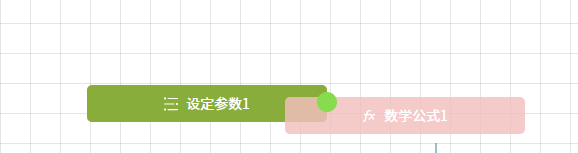
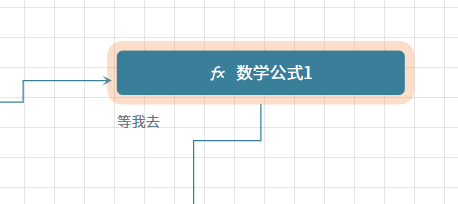
10.节点插槽 显示自己定义的内容
 <RelationGraph ref="graphRef" :options="graphOptions" :on-node-click="onNodeClick"
                        @contextmenu="onContextmenu" @canvas-click="onCanvasClick" :on-node-dragging="onNodeDragging"
                        :on-node-drag-start="onNodeDragStart" :on-node-drag-end="onNodeDragEnd">
                        <template #node="{ node }">
                            <div class="my-node p-2">
                                <div class="flex items-start mt-1">
                                    <img class="me-2" draggable="false" :src="FxWSvg" v-if="node.data?.type == 'fx'">
                                    <img class="me-2" draggable="false" :src="setParamterWSvg"
                                        v-else-if="node.data?.type == 'paramter'">
                                    <img class="me-2" draggable="false" :src="physicsPointWSvg"
                                        v-else-if="node.data?.type == 'point'">
                                    <img class="me-2" draggable="false" :src="exportSvg"
                                        v-else-if="node.data?.type == '输出'">
                                </div>
                                <div style="word-break: break-all;">
                                {{ node["text"] }}
                                </div>

                                <div class="line-create" @click.stop="createLineFromNode"
                                    v-if="node.data?.type !== 'fx' && route.query.type != 'view'" :style="{
                                        display: 'none',
                                        backgroundColor: '#65DF2A',
                                        height: '20px',
                                        width: '20px',
                                        borderRadius: '50%',
                                        position: 'absolute',
                                        right: '-10px',
                                        bottom: '10px',
                                        zIndex: 999,
                                        padding: '2px',
                                    }"></div>
                                <!-- 描述信息 -->
                                <div class="node-description">
                                    {{ node.data?.description }}
                                </div>
                            </div>
                        </template>
</RelationGraph >
11.配置信息 详细参考官网
    const graphOptions = {
        debug: false,
        allowSwitchLineShape: true,
        // allowSwitchJunctionPoint: true,
        allowShowDownloadButton: false,
        defaultJunctionPoint: "border",
        defaultNodeBorderWidth: 0,
        defaultLineColor: "#09819C",
        defaultLineShape: 4, // 备选 1 2 4 5 6
        defaultNodeShape: 1,
        defaultLineTextOffset_x: 2,
        defaultLineTextOffset_y: -3,
        layout: {
            layoutName: "tree",
            from: "left",
            "min_per_width": "80",
            "max_per_width": "300",
            "min_per_height": "160",
            "max_per_height": "180"
        },
    };
12.页面优化
12.1内容太多显示不完 缩放
const graphInstance = graphRef.value?.getInstance();
// 聚焦中心点
await graphInstance.moveToCenter();
// 调整视角 显示所有内容
await graphInstance.zoomToFit();
12.2 聚焦某个节点 比如搜索后定位到
const graphInstance = graphRef.value?.getInstance();
await graphInstance.focusNodeById(id)
12.3 刷新
const graphInstance = graphRef.value?.getInstance();
await graphInstance.refresh()
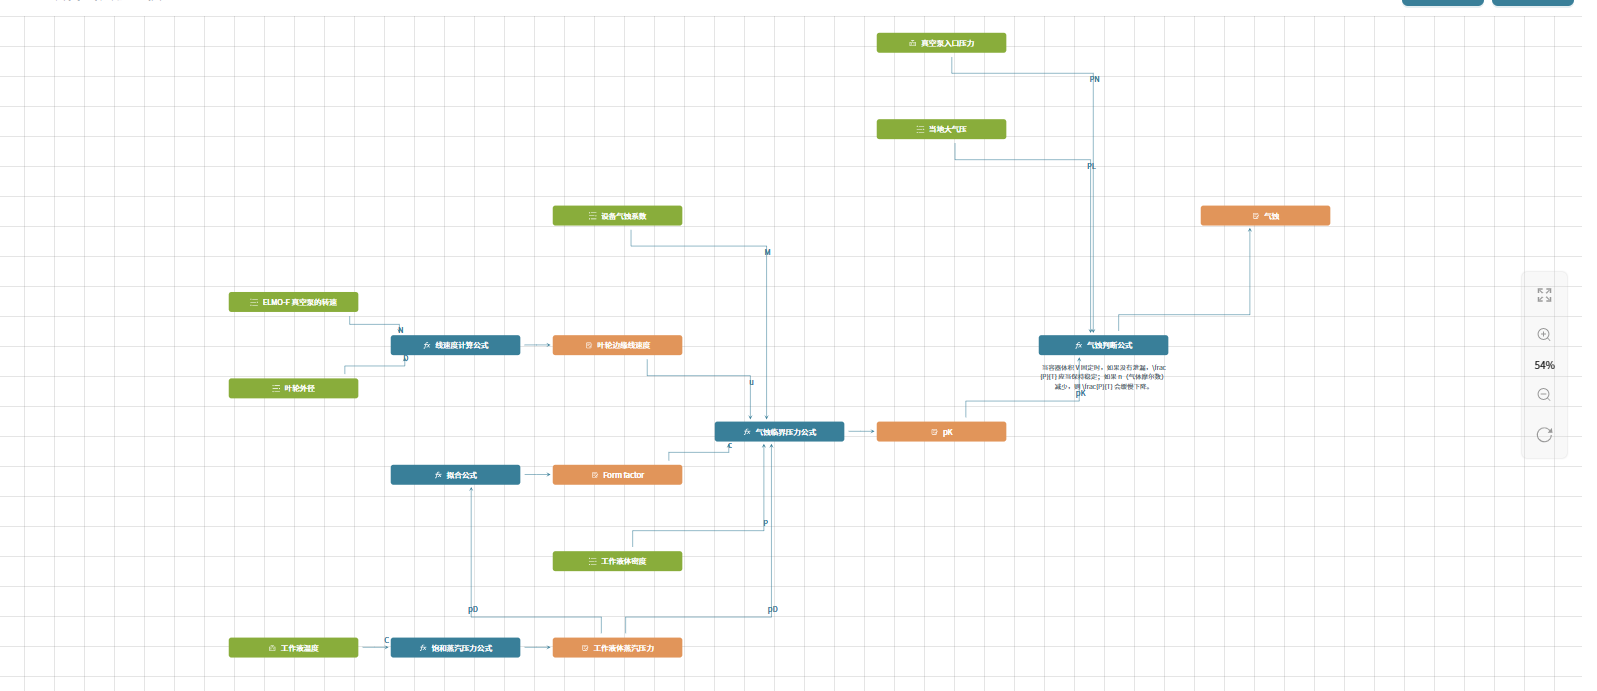
显示效果还算不错 可以去试试 部分高级内容需要会员哦
今ならできます。

 浙公网安备 33010602011771号