
K近邻算法-1.原理及简单实现
K近邻算法
K近邻算法,又称KNN算法,是机器学习入门的第一个算法,其解决的是分类问题,具有以下特点:
- 思想简单
- 应用数学知识少
- 效果好(后续会讨论其缺点)
- 机器学习的入门算法
原理及简单实现
例:图为肿瘤时间与大小对于肿瘤的分类,红色代表良性肿瘤,蓝色代表了恶性肿瘤,当新来一个数据点(绿色数据点)如何判断它的类别?

编程实现预测
import numpy as np
import matplotlib.pyplot as plt
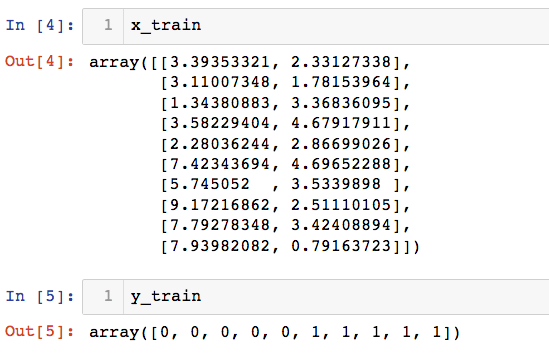
# 定义十个样本和它的结果集,每个样本有两个特征值
data_x = [
[3.393533211, 2.331273381],
[3.110073483, 1.781539638],
[1.343808831, 3.368360954],
[3.582294042, 4.679179110],
[2.280362439, 2.866990263],
[7.423436942, 4.696522875],
[5.745051997, 3.533989803],
[9.172168622, 2.511101045],
[7.792783481, 3.424088941],
[7.939820817, 0.791637231]
]
data_y = [0,0,0,0,0,1,1,1,1,1]
把样本和结果 转化为numpy矩阵
x_train = np.array(data_x)
y_train = np.array(data_y)
输出结果:
基于样本的两个属性(x和y坐标),绘制样本散点图,不同颜色代表不同结果
plt.scatter(x_train[y_train==0,0], x_train[y_train==0,1], color='g')
plt.scatter(x_train[y_train==1,0], x_train[y_train==1,1], color='r')
plt.show()
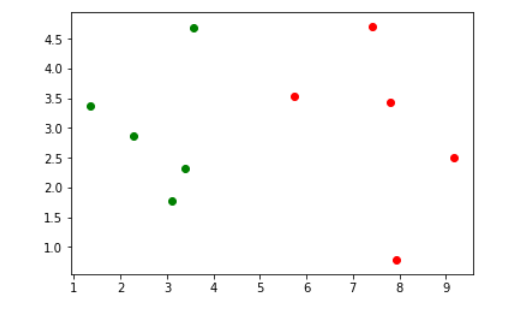
来了一个新的样本 ,在样本集中表现出来
x = np.array([8.093607318, 3.365731514])
plt.scatter(x_train[y_train==0,0], x_train[y_train==0,1], color='g')
plt.scatter(x_train[y_train==1,0], x_train[y_train==1,1], color='r')
plt.scatter(x[0], x[1], color='b')
plt.show()

K近邻算法核心:分别求出新样本与已有样本的距离
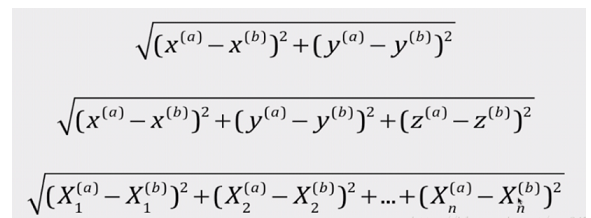
# 导入math包中求平方根
from math import sqrt
distances = []
for x_tep in x_train:
    d = sqrt(np.sum((x_tep - x)**2))
    distances.append(d)
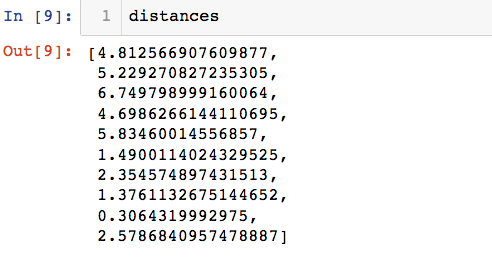
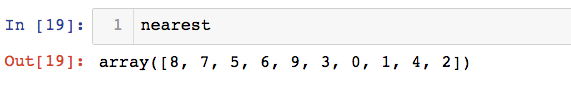
根据索引排序,返回的数据为和新样本的距离从小到大排列的原有样本的索引
nearest = np.argsort(distances)
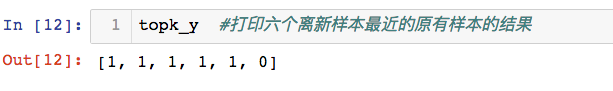
找出距离此新样本最近的k个原始样本的结果
k = 6
topk_y = [y_train[i] for i in nearest[:k]]
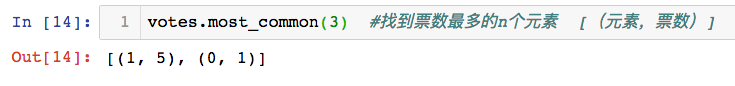
统计数组中的元素,及它出现的次数,找到票数最多的n个元素
from collections import Counter
votes = Counter(topk_y)
votes.most_common(3)   #[(元素,票数)]
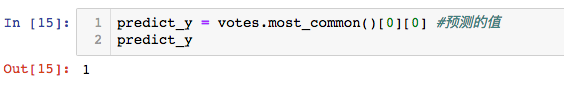
得到预测的值
predict_y = votes.most_common()[0][0] #预测的值

 浙公网安备 33010602011771号