1 %底层代码创建GUI
2
3 hf = figure(...
4 'Units','Normalized',...
5 'Color','w',...
6 'Position',[0.1 0.1 0.8 0.8]);
7
8 ha=axes(...
9 'Parent',hf,...
10 'Units','Normalized',...
11 'Position',[0.1 0.1 0.6 0.8],...
12 'NextPlot','Add');
13
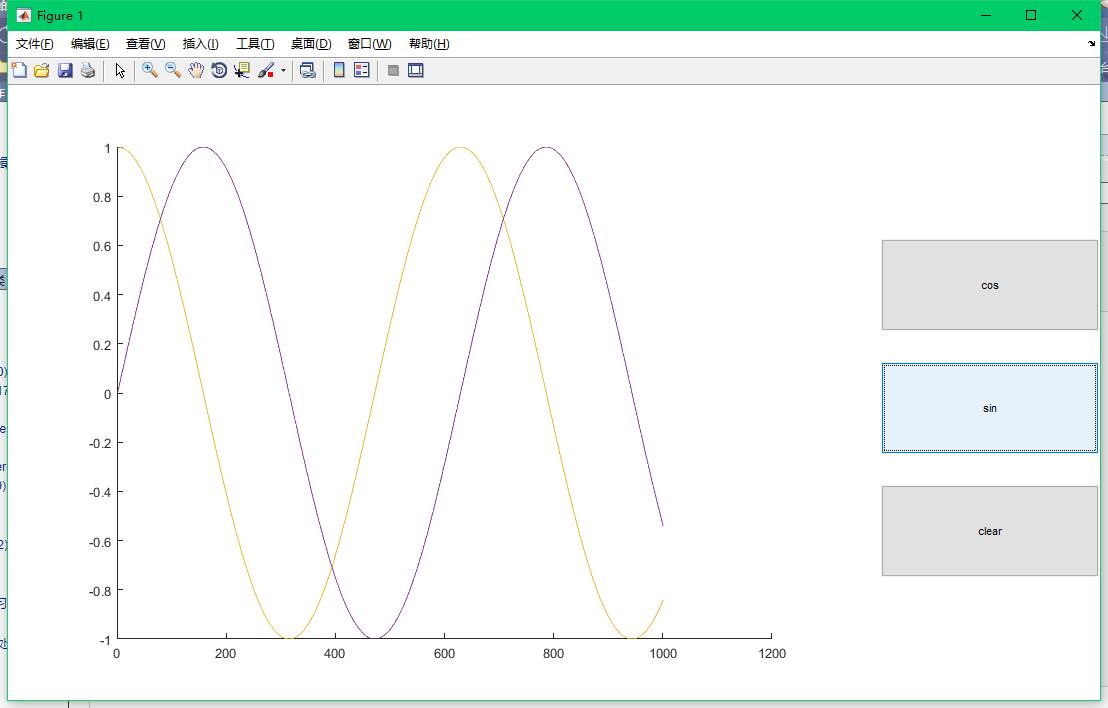
14 hb1=uicontrol(...
15 'Style','pushbutton',...
16 'Callback','str,delete(cllchild(ha));end',...
17 'String','clear',...
18 'Units','Normalized',...
19 'Position',[0.8 0.2 0.2 0.15]);
20
21 hb2=uicontrol(...
22 'Style','pushbutton',...
23 'Callback','plot(sin([0:0.01:10]))',...
24 'String','sin',...
25 'Units','Normalized',...
26 'Position',[0.8 0.4 0.2 0.15]);
27
28 hb3=uicontrol(...
29 'Style','pushbutton',...
30 'Callback','plot(cos([0:0.01:10]))',...
31 'String','cos',...
32 'Units','Normalized',...
33 'Position',[0.8 0.6 0.2 0.15]);


 浙公网安备 33010602011771号