


python 按excel的经纬度提取对应栅格tif文件的数值

栅格文件

批量处理代码:
# -*- coding:utf-8 -*-
"""
@author: suyue
@file: extract_stations_from_excel.py
@time: 2025/09/09
@desc: 从Excel读取站点信息并提取所有站点的CTT值
"""
import rasterio
import numpy as np
import pandas as pd
import os
import glob
from tqdm import tqdm


def read_stations_from_excel(excel_path):
    """
    从Excel文件中读取站点信息

    参数:
    excel_path: Excel文件路径

    返回:
    站点列表,格式为 [(lon1, lat1, '站名1'), (lon2, lat2, '站名2'), ...]
    """
    try:
        # 读取Excel文件
        df = pd.read_excel(excel_path)
        print(f"成功读取站点文件: {excel_path}")
        print(f"共找到 {len(df)} 个站点")

        # 检查必要的列是否存在
        required_columns = ['站名', '经度', '纬度']
        for col in required_columns:
            if col not in df.columns:
                raise ValueError(f"Excel文件中缺少必要的列: {col}")

        # 提取站点信息
        stations = []
        for _, row in df.iterrows():
            stations.append((row['经度'], row['纬度'], row['站名']))

        # 显示前几个站点信息
        print("前5个站点信息:")
        for i, (lon, lat, name) in enumerate(stations[:5], 1):
            print(f"  站点{i}: {name} - 经度: {lon}, 纬度: {lat}")
        if len(stations) > 5:
            print(f"  ... 共 {len(stations)} 个站点")

        return stations

    except Exception as e:
        print(f"读取站点文件时出错: {e}")
        return None


def extract_station_value(raster_path, stations):
    """
    提取指定站点的栅格值

    参数:
    raster_path: 栅格文件路径
    stations: 站点列表,格式为 [(lon1, lat1, '站名1'), (lon2, lat2, '站名2'), ...]

    返回:
    包含所有站点值的列表,每个元素为 (站名, 时间, 值)
    """
    try:
        with rasterio.open(raster_path) as src:
            # 从文件名中提取时间信息
            file_name = os.path.splitext(os.path.basename(raster_path))[0]
            time_str = file_name.replace('CER_', '')  # 去掉CER_前缀

            results = []

            for lon, lat, station_name in stations:
                try:
                    # 将经纬度转换为行列号
                    row, col = src.index(lon, lat)

                    # 读取该位置的值
                    value = src.read(1, window=((row, row + 1), (col, col + 1)))

                    if value.size > 0:
                        pixel_value = float(value[0, 0])
                        # 检查是否为有效值(非NaN和无数据值)
                        if not np.isnan(pixel_value) and pixel_value != src.nodata:
                            results.append({
                                '站名': station_name,
                                '时间': time_str,
                                'CTT值': pixel_value
                            })
                        else:
                            results.append({
                                '站名': station_name,
                                '时间': time_str,
                                'CTT值': np.nan
                            })
                    else:
                        results.append({
                            '站名': station_name,
                            '时间': time_str,
                            'CTT值': np.nan
                        })
                except Exception as e:
                    # 单个站点提取失败时继续处理其他站点
                    print(f"  提取站点 {station_name} 时出错: {e}")
                    results.append({
                        '站名': station_name,
                        '时间': time_str,
                        'CTT值': np.nan
                    })

            return results

    except Exception as e:
        print(f"处理文件 {raster_path} 时出错: {e}")
        return None


def batch_extract_stations(input_folder, stations_excel_path, output_excel_path):
    """
    批量处理文件夹中的所有TIF文件,提取所有站点的值

    参数:
    input_folder: 输入文件夹路径(包含TIF文件)
    stations_excel_path: 站点信息Excel文件路径
    output_excel_path: 输出Excel文件路径
    """

    # 读取站点信息
    stations = read_stations_from_excel(stations_excel_path)
    if not stations:
        return None

    # 查找所有的TIF文件
    tif_files = glob.glob(os.path.join(input_folder, "*.tif"))
    tif_files.sort()  # 按文件名排序

    print(f"找到 {len(tif_files)} 个TIF文件")

    # 存储所有结果
    all_results = []

    # 处理每个文件
    for tif_file in tqdm(tif_files, desc="处理TIF文件"):
        file_results = extract_station_value(tif_file, stations)

        if file_results:
            all_results.extend(file_results)

    # 转换为DataFrame
    if all_results:
        df = pd.DataFrame(all_results)

        # 按站名和时间排序
        df = df.sort_values(['站名', '时间'])

        # 重置索引
        df = df.reset_index(drop=True)

        # 保存到Excel
        df.to_excel(output_excel_path, index=False, engine='openpyxl')
        print(f"成功保存到: {output_excel_path}")
        print(f"共提取了 {len(df)} 条记录")

        # 显示各站点的数据统计
        print("\n各站点数据统计:")
        station_stats = df.groupby('站名')['CTT值'].agg([
            ('有效数据量', lambda x: x.notna().sum()),
            ('数据总量', 'count'),
            ('有效率', lambda x: f"{x.notna().sum() / len(x) * 100:.1f}%")
        ]).reset_index()

        print(station_stats.to_string(index=False))

        # 总体统计
        total_valid = df['CTT值'].notna().sum()
        total_records = len(df)
        print(f"\n总体统计: {total_valid}/{total_records} 条有效数据 ({total_valid / total_records * 100:.1f}%)")

        return df, station_stats
    else:
        print("没有成功提取到任何数据")
        return None, None


def create_pivot_table(df, output_pivot_path):
    """
    创建数据透视表,便于查看
    """
    if df is not None:
        # 创建透视表:行是时间,列是站名,值是CTT值
        pivot_df = df.pivot_table(
            index='时间',
            columns='站名',
            values='CTT值',
            aggfunc='first'  # 取第一个值
        )

        # 重置索引,让时间成为一列
        pivot_df.reset_index(inplace=True)

        # 保存透视表
        pivot_df.to_excel(output_pivot_path, index=False, engine='openpyxl')
        print(f"透视表已保存到: {output_pivot_path}")

        return pivot_df


# 使用示例
if __name__ == "__main__":
    # 设置文件路径
    input_folder = "D:/20240809example/CTT/"  # TIF文件所在文件夹
    stations_excel_path = "D:/20240809example/锡林郭勒示范区站点.xlsx"  # 站点信息Excel文件
    output_excel_path = "D:/20240809example/CTT/锡林郭勒示范区站点CTT数据汇总.xlsx"  # 输出Excel文件
    output_pivot_path = "D:/20240809example/CTT/锡林郭勒示范区站点CTT数据透视表.xlsx"  # 透视表文件

    # 确保输出文件夹存在
    output_dir = os.path.dirname(output_excel_path)
    if not os.path.exists(output_dir):
        os.makedirs(output_dir)
        print(f"创建输出文件夹: {output_dir}")

    print("开始提取所有站点的CTT值...")

    # 执行批量提取
    result_df, station_stats = batch_extract_stations(
        input_folder=input_folder,
        stations_excel_path=stations_excel_path,
        output_excel_path=output_excel_path
    )

    if result_df is not None:
        print("\n提取完成!结果预览:")
        print(result_df.head(10))

        # 创建透视表
        pivot_df = create_pivot_table(result_df, output_pivot_path)

        if pivot_df is not None:
            print("\n透视表预览:")
            print(pivot_df.head())

        # 保存统计信息
        if station_stats is not None:
            stats_path = output_excel_path.replace('.xlsx', '_统计信息.xlsx')
            station_stats.to_excel(stats_path, index=False, engine='openpyxl')
            print(f"统计信息已保存到: {stats_path}")

    print("\n程序执行完毕!")
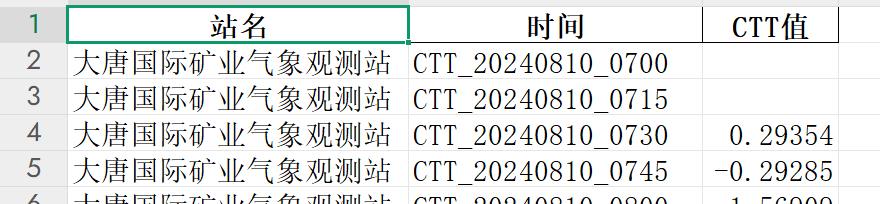
结果:


 浙公网安备 33010602011771号