使用JMAT分析JVM堆内存
-
给eclipse 安装mat插件:
点击help ---install new software------add 然后添加新地址,路径为:http://download.eclipse.org/mat/1.3/update-site/
-
导出对应进程的堆内存文件
jmap:Prints shared object memory maps or heap memory details for a process
如果什么参数都没有 :jamp 3161,则: the jmap command prints shared object mappings.
如果-dump:[live,] format=b, file=filename则:Dumps the Java heap in hprof binary format to filename. The live suboption is optional, but when specified, only the active objects in the heap are dumped(会触发full gc )
如果 -heap 则:Prints a heap summary of the garbage collection used, the head configuration, and generation-wise heap usage
-histo[:live] 则:Prints a histogram of the heap. For each Java class, the number of objects, memory size in bytes, and the fully qualified class names are printed. 统计堆中对象
-clstats:Prints class loader wise statistics of Java heap. For each class loader, its name, how active it is, address, parent class loader, and the number and size of classes it has loaded are printed.
可以通过命令先看下一下内存映射 : jmap -histo:live 3514 | head -5
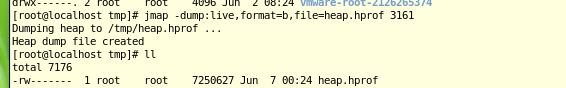
导出命令: jmap -dump:live,format=b,file=heap.hprof 3161
-
将文件导入map中:
-
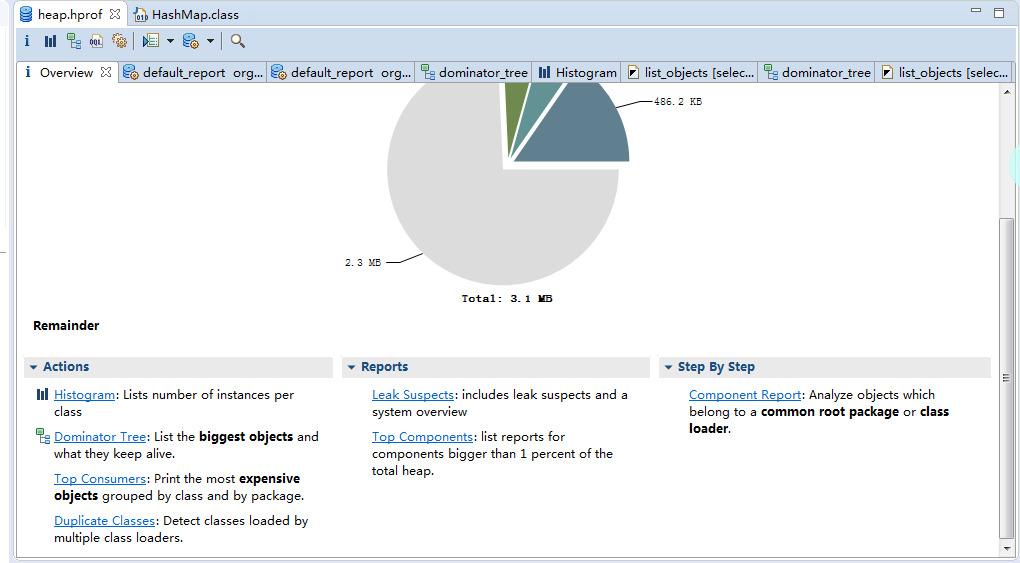
文件分析
使用第一种histogram 模式:
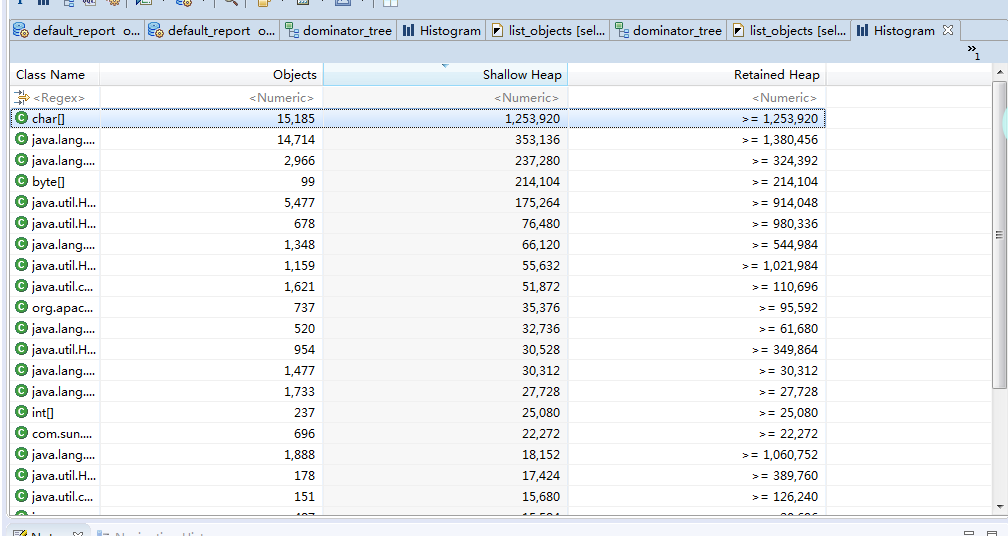
-
选择对象,右键 list Object -- with incoming reference
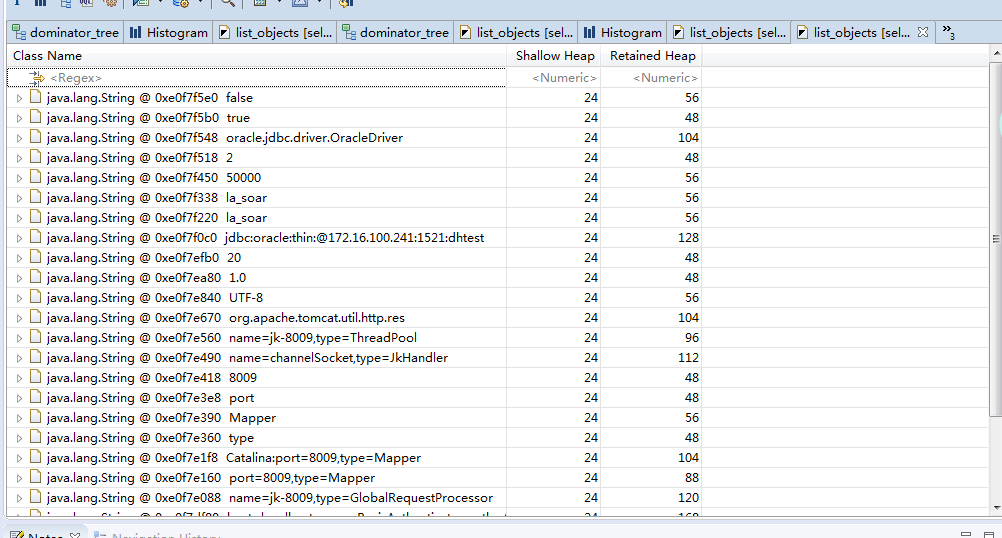
-
选中对应的类,右键 open resource file 即可打开对应的类文件
- 分析同样一个dump快照,MAT需要的额外内存比jhat要小的多的多,所以建议使用MAT来进行分析,当然也看个人偏好

 浙公网安备 33010602011771号