

Redhat7.3环境下单机版TIDB安装(附图)
软硬件环境需求及前置检查
在中控机上安装 TiUP 组件
使用普通用户登录中控机,以 tidb 用户为例,后续安装 TiUP 及集群管理操作均通过该用户完成:
1、执行如下命令安装 TiUP 工具:
curl --proto '=https' --tlsv1.2 -sSf https://tiup-mirrors.pingcap.com/install.sh | sh
2、按如下步骤设置 TiUP 环境变量:
重新声明全局环境变量:
source .bash_profile
3、确认 TiUP 工具是否安装:
which tiup
4、安装 TiUP cluster 组件
tiup cluster
5、如果已经安装,则更新 TiUP cluster 组件至最新版本:
tiup update --self && tiup update cluster
预期输出 “Update successfully!” 字样。
6、验证当前 TiUP cluster 版本信息。执行如下命令查看 TiUP cluster 组件版本:
tiup --binary cluster
编辑初始化配置文件
新建topology.yaml文件,文件内容如下:因为是单机版部署且所有服务都是单节点部署。所以所有server都只有一个host且IP一样。
# # Global variables are applied to all deployments and used as the default value of
# # the deployments if a specific deployment value is missing.
global:
  user: "tidb"
  ssh_port: 22
  deploy_dir: "/tidb-deploy"
  data_dir: "/tidb-data"

pd_servers:
  - host: 172.16.43.106

tidb_servers:
  - host: 172.16.43.106

tikv_servers:
  - host: 172.16.43.106

monitoring_servers:
  - host: 172.16.43.106

grafana_servers:
  - host: 172.16.43.106

alertmanager_servers:
  - host: 172.16.43.106
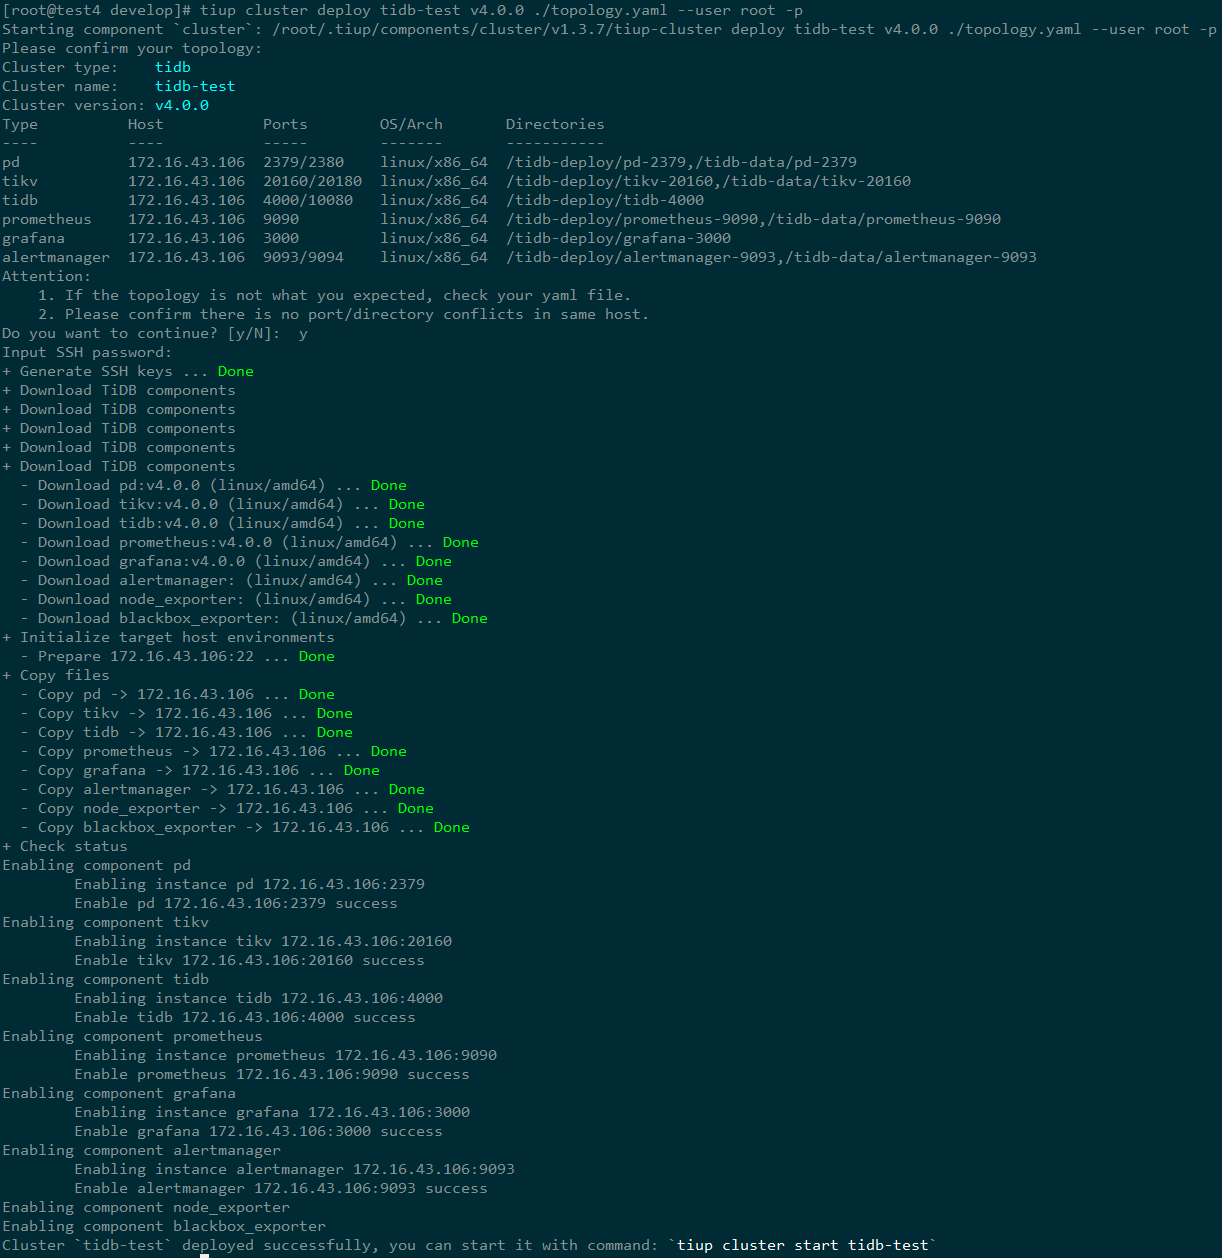
执行部署命令
[root@test4 develop]# tiup cluster deploy tidb-test v4.0.0 ./topology.yaml --user root -p
查看 TiUP 管理的集群情况
[root@test4 develop]# tiup cluster list

检查部署的 TiDB 集群情况
[root@test4 develop]# tiup cluster display tidb-test

输出包括tidb-test集群中实例 ID、角色(Role)、主机(Host)、监听端口(Ports)、系统(OS/Arch)、状态(Status)、数据存储目录(Data Dir)、部署目录(Deploy Dir)。由于tidb-test集群还未启动,所以状态为 Down/inactive。
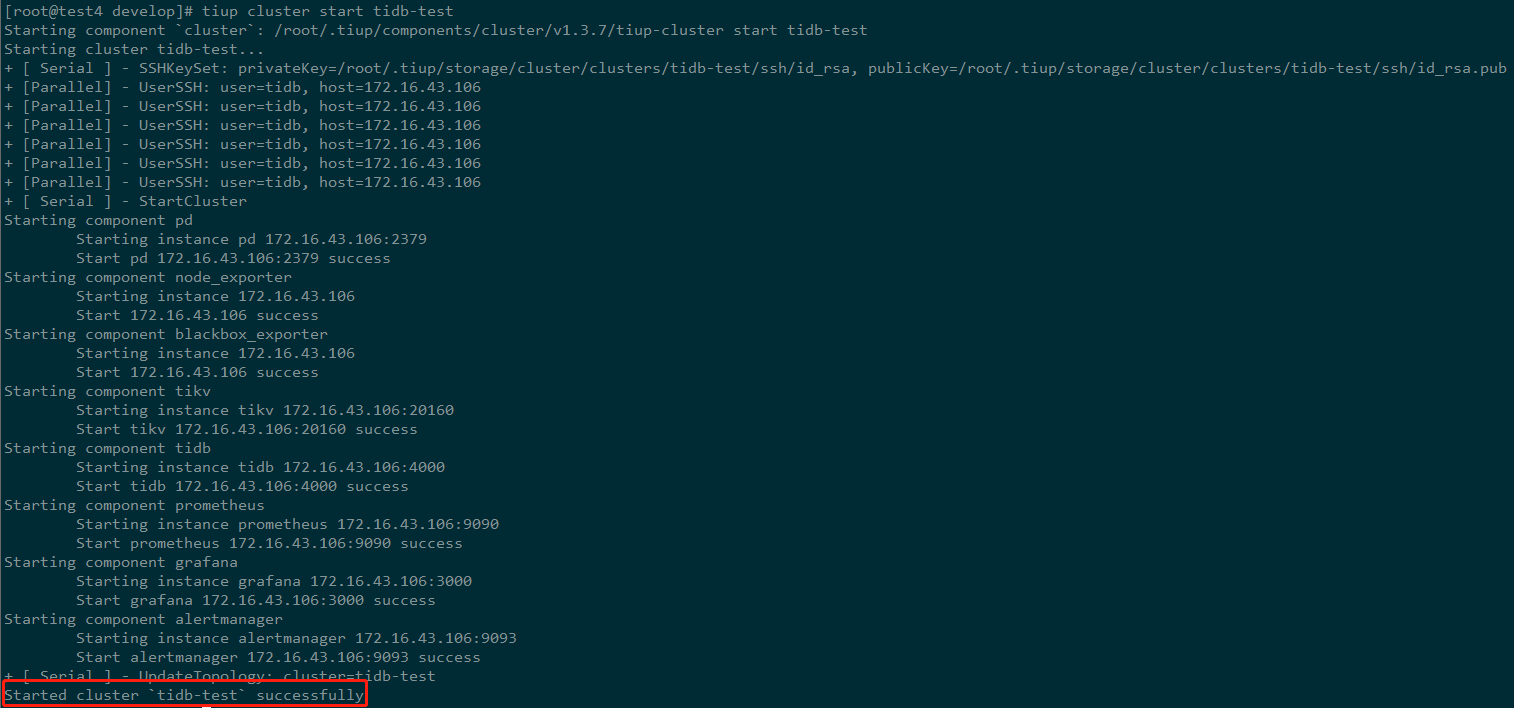
启动集群
启动成功最后一行会提示:Started cluster `tidb-test` successfully
[root@test4 develop]# tiup cluster start tidb-test
验证集群运行状态
再次执行集群状态检查命令:
[root@test4 develop]# tiup cluster display tidb-test
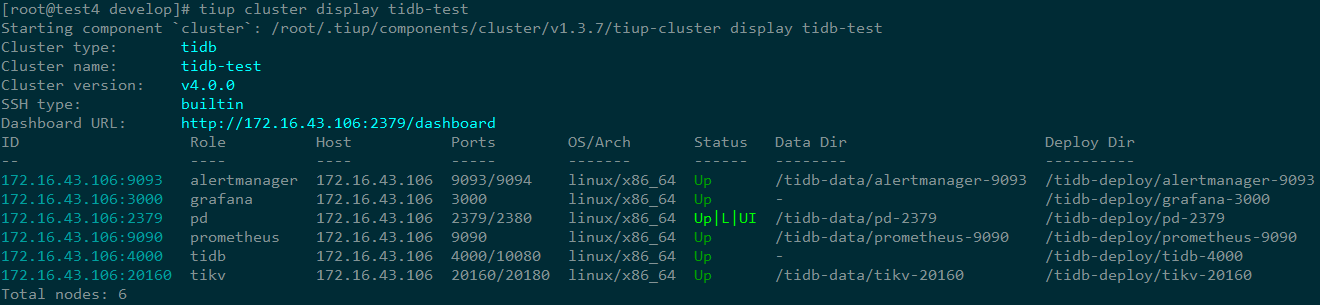
可以看到之前状态为Down/inactive的服务现在状态都变成UP了。说明集群状态正常。
检查Mysql安装状态
执行命令:mysql -u root -h 10.0.1.4 -P 4000,因为我是本地通过DataGrip访问Mysql。千万要关闭TIDB服务器的防火墙
Redhat7和Redhat6防火墙操作命令不太一样,在Redhat7中通过下面命令操作防火墙:
查看防火墙状态。
systemctl status firewalld

临时关闭防火墙命令。重启电脑后,防火墙自动起来。
systemctl stop firewalld

永久关闭防火墙命令。重启后,防火墙不会自动启动。
systemctl disable firewalld

打开防火墙命令。
systemctl enable firewalld
DataGrip配置,配置后,
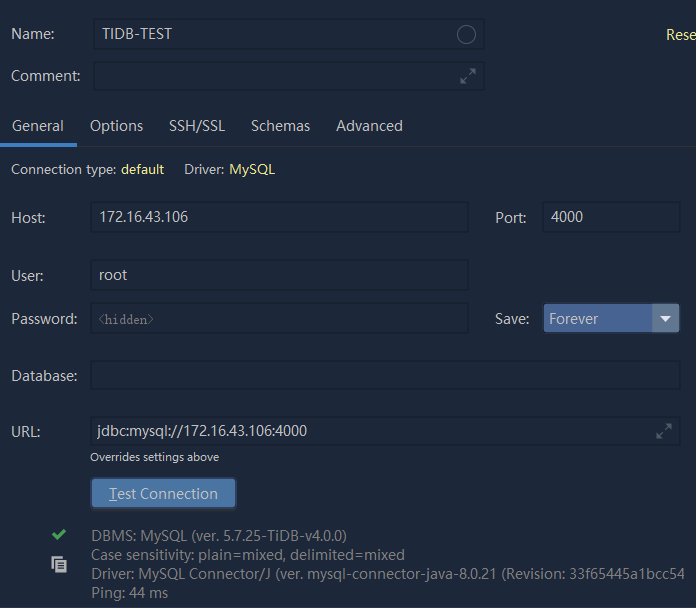
登录后执行查询TIDB版本SQL:select tidb_version(),返回如下内容说明正常。

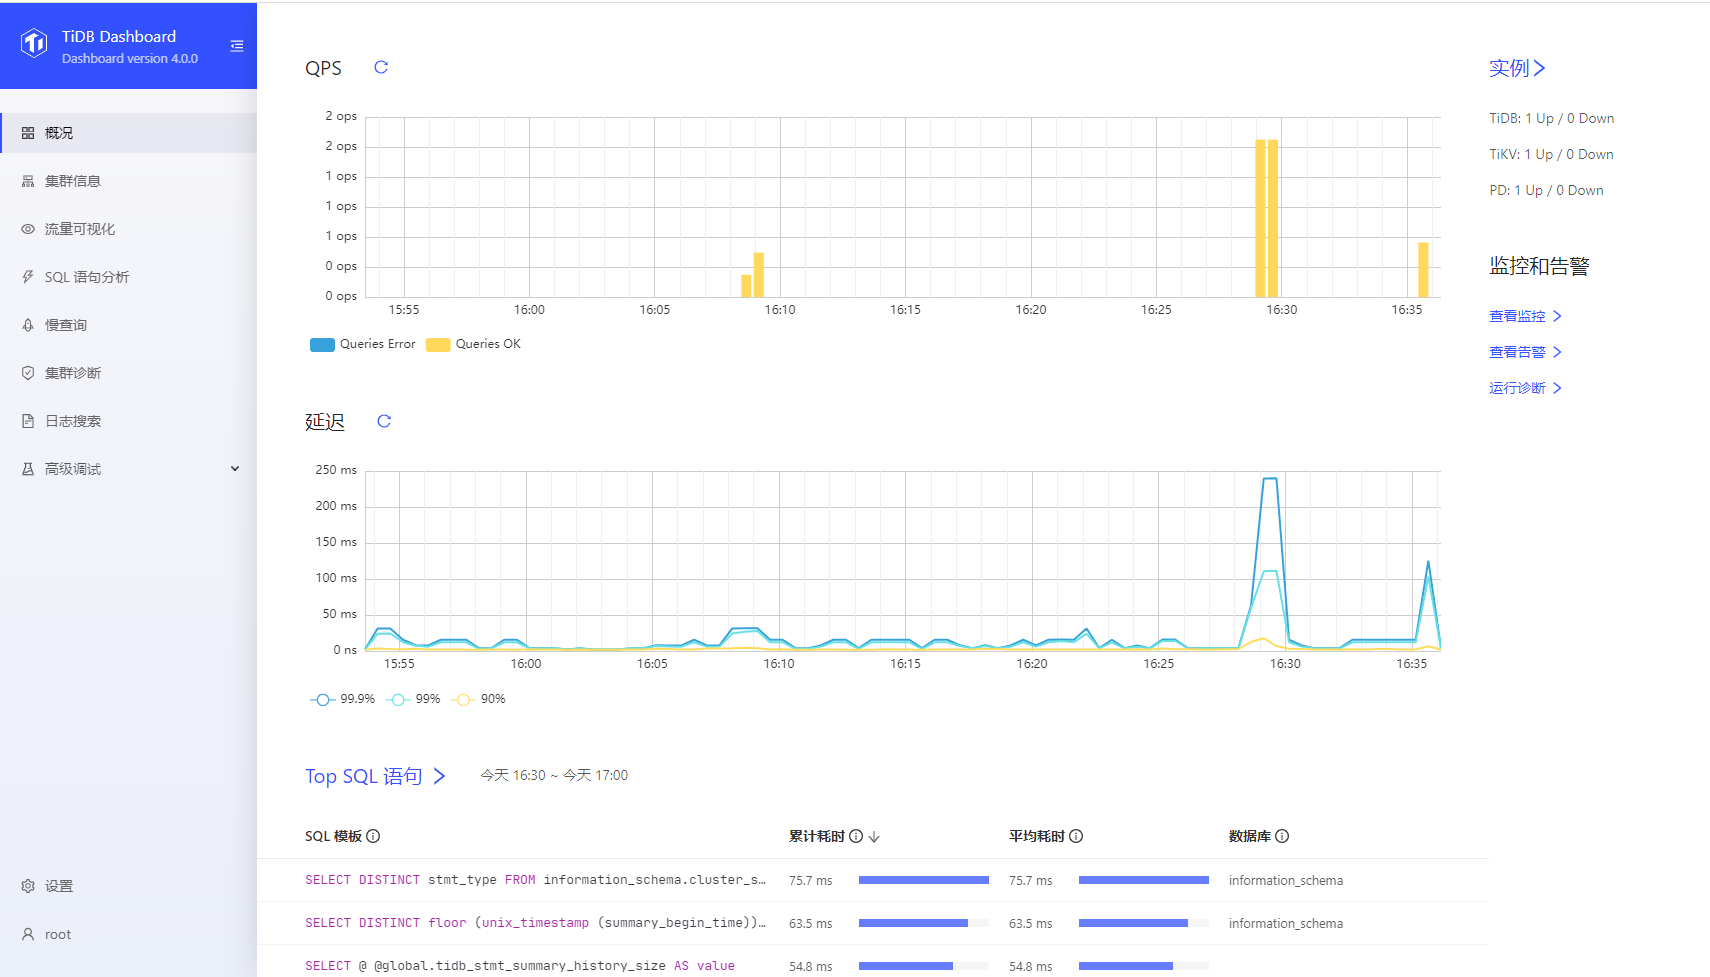
查看 TiDB Dashboard
浏览器输入:http://172.16.43.106:2379/dashboard,用户名为数据库root用户,密码默认为空。如果忘记端口可以通过集群状态检查命令查看。
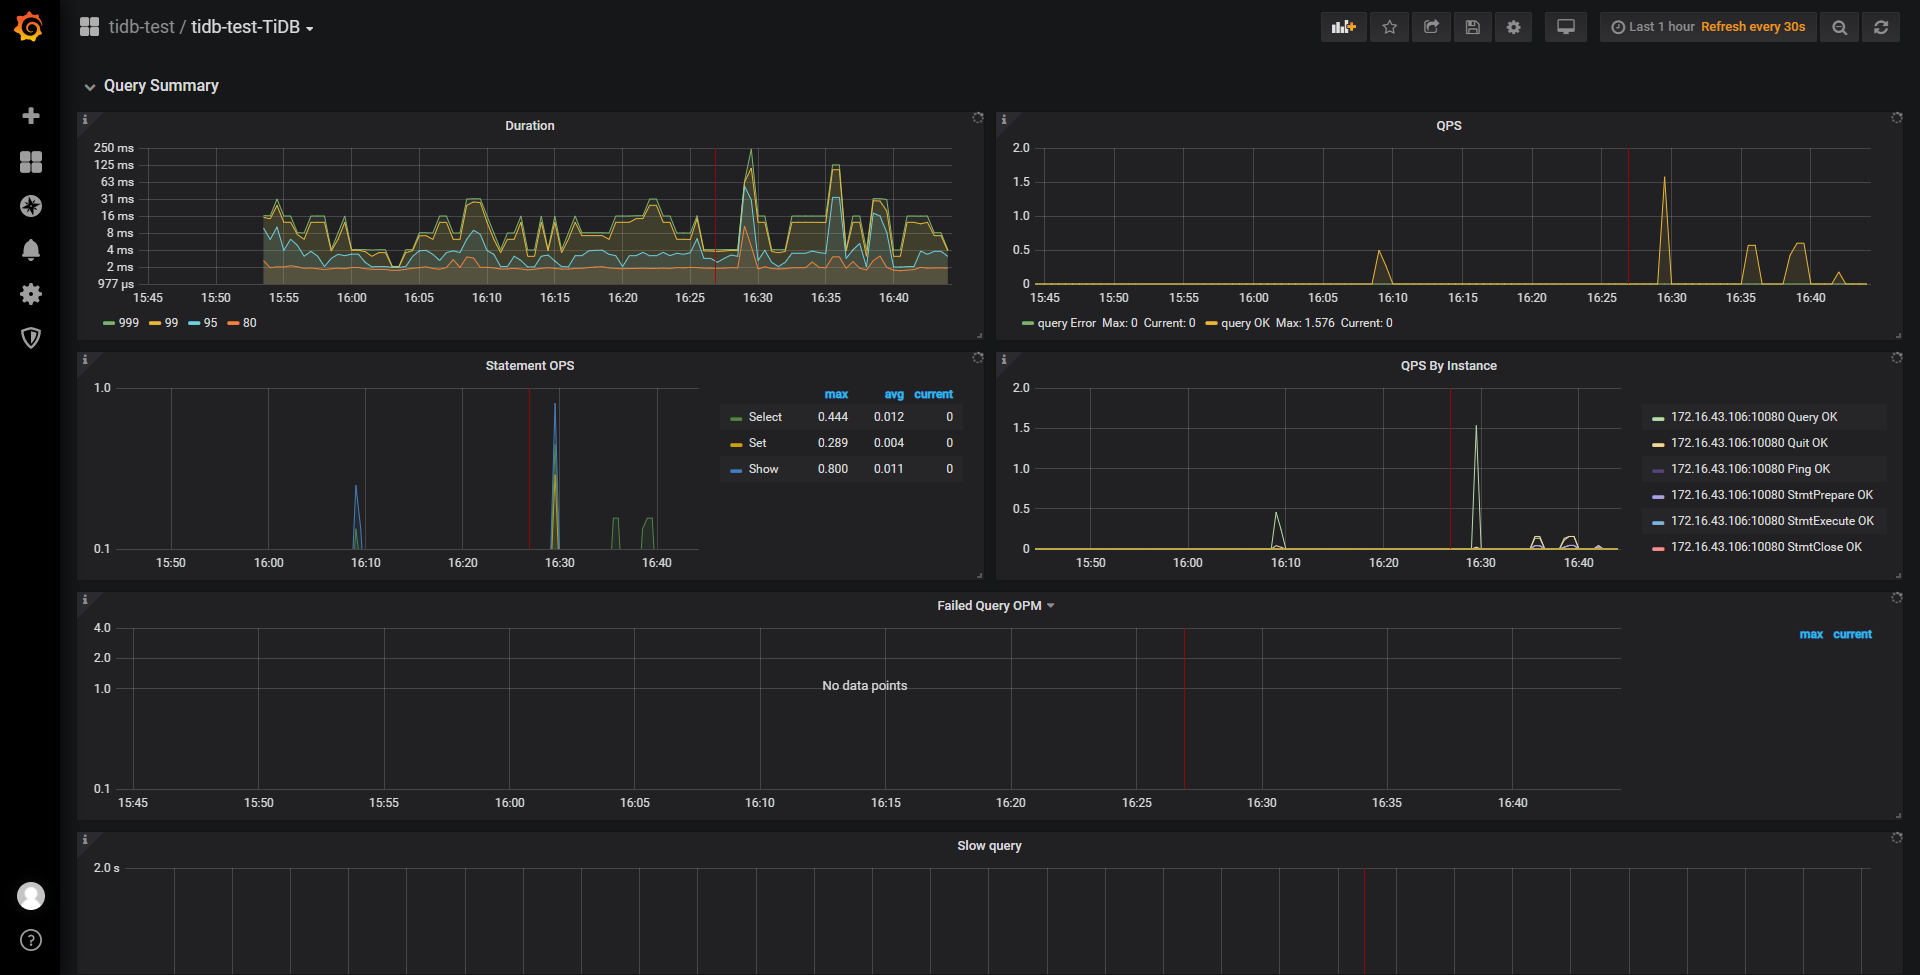
Grafana 检查集群状态
浏览器输入:http://172.16.43.106:3000/,用户名密码默认都是admin。
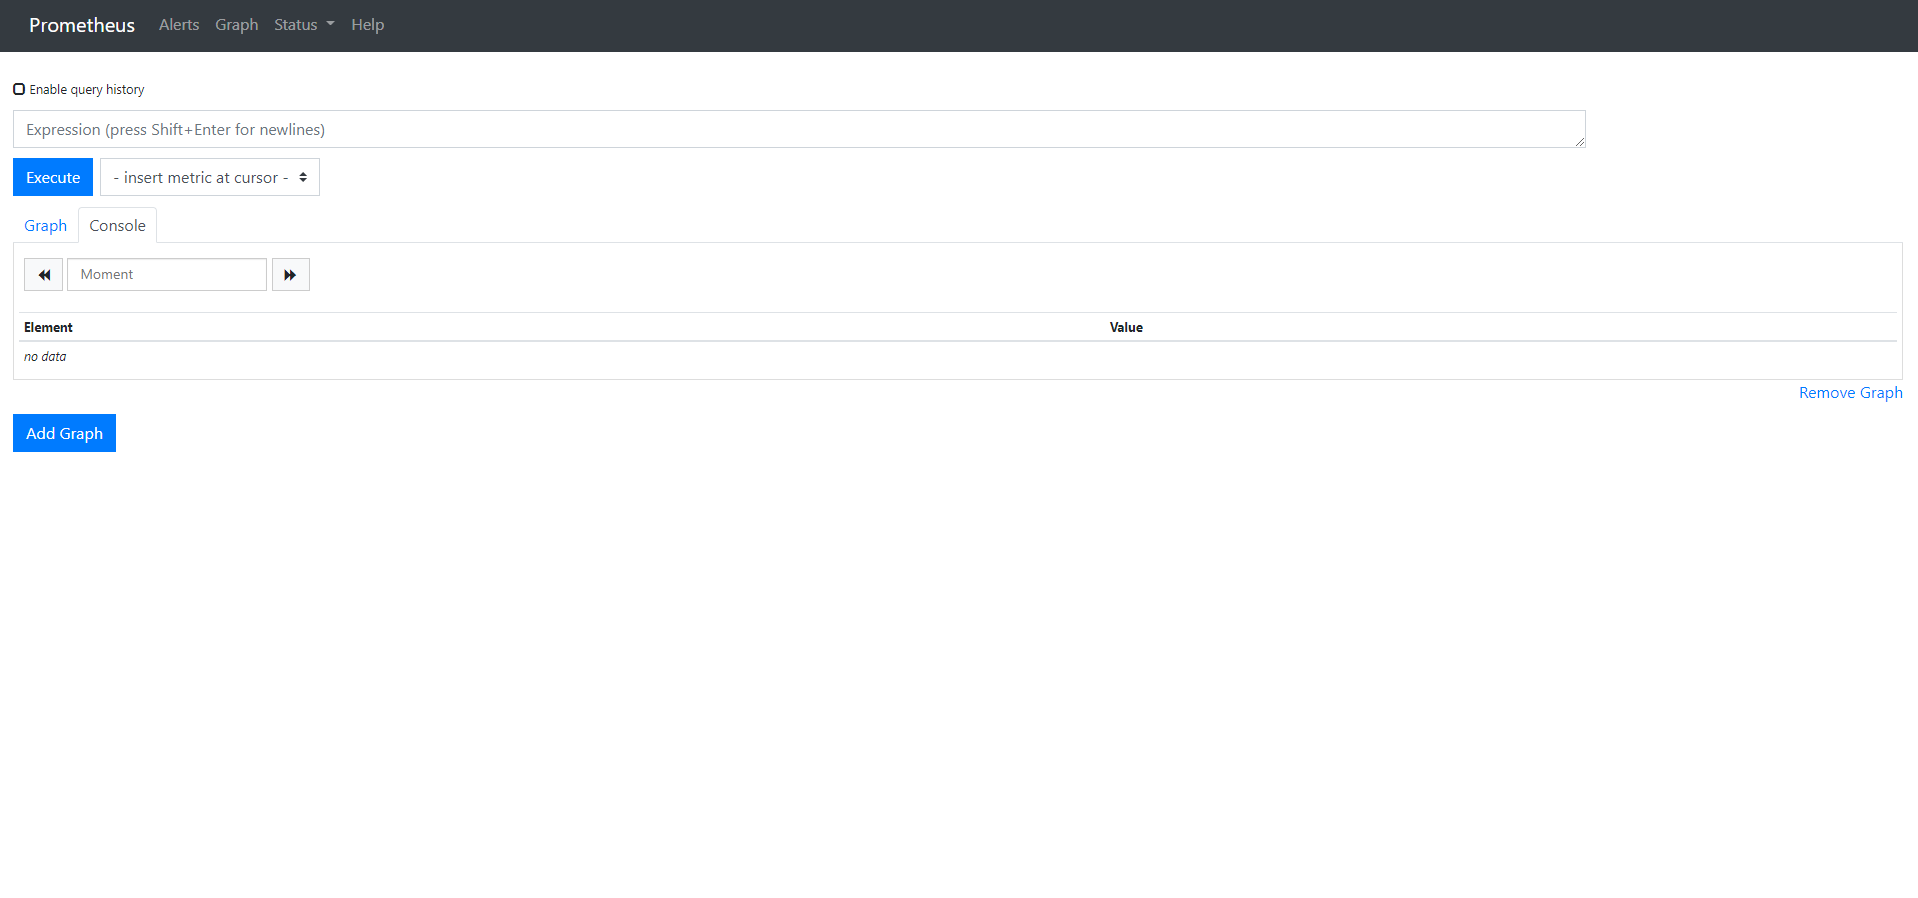
查看prometheus
访问地址:http://172.16.43.106:9090/
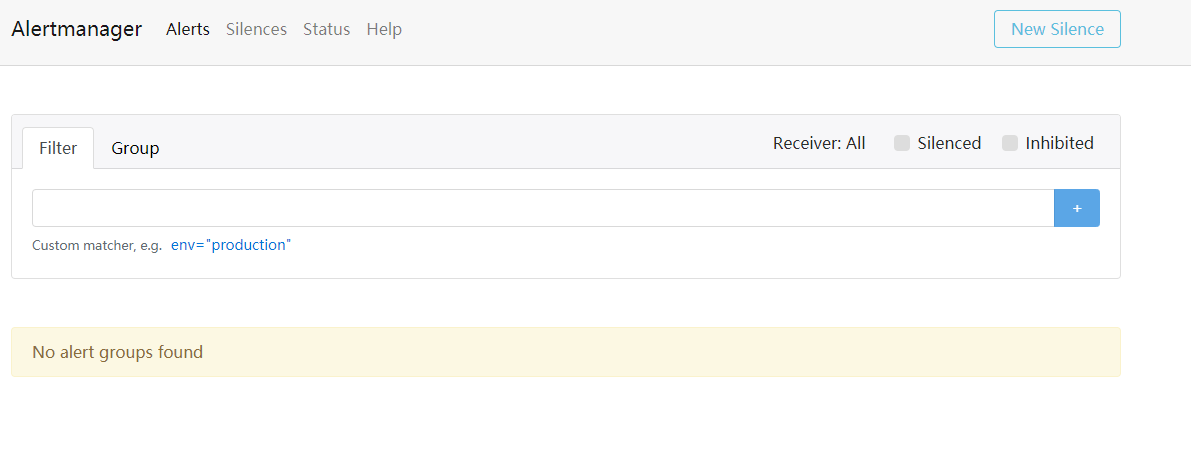
查看alertmanager
访问地址:http://172.16.43.106:9093/
prometheus和alertmanager使用可参考我的另一篇文章:Spring Cloud 之 Prometheus集成Alertmanager实现微服务预警(二十三)
到此,单机版TIDB安装完成。

 浙公网安备 33010602011771号