
echarts渲染一个风向图
今天给大家说一个用echarts渲染一个风向图,这里图上其实有三个要素,风向,风级和能见度,主要还是讲讲代码里面的坑
1.风向图标方向修改以及设置
var ownData = echarts.util.map(windGrade, function (item, index) {
return {
value: windGrade[index],
symbolRotate:360-windDir[index]};
});
这里的ownData 包括了一个value和symbolRotate,第一个是风级的数值,第二个则是角度,官方说symbolRotate:windDir[index],但是会发现图标的方向不对,于是自己根据实际展示需要做了调整,前面用360来减去对应的角度值
echarts官方是再series中的markPoint设置
symbol:'image://wind.png',
symbolSize:'26',,但是发现并不起作用,而是直接再series下进行symbol和symbolSize的设置
2.自定义tooltip显示内容
tooltip: {
formatter: function(params) {
这里的params,可以alert一下,看看具体值
//alert(JSON.stringify(params));
return '<p>时间:'+params[0].name+'</p><p><p>能见度:'+params[2].value+'</p><p>风级:'+params[1].value+'</p><p>风向:'+params[0].value+'</p>';
},
trigger: 'axis',
axisPointer: {
animation: false
}
},
3.禁止图标拖拽操作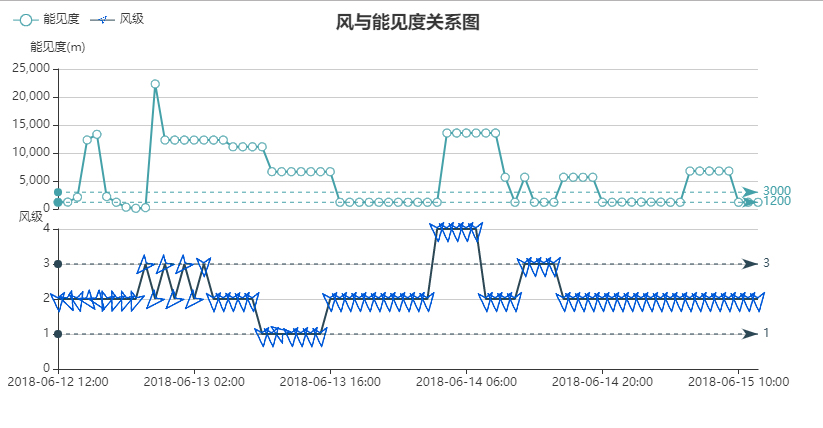
将dataZoom设置取消,因为会发现设置之后,对应值会报错,说value未找到,并且上下的数据横轴对应不齐
4.所有节点数据都显示出来
echarts默认会根据div的宽度来展示数据节点名称,如果向全部显示,再series设置showAllSymbol: true,即可
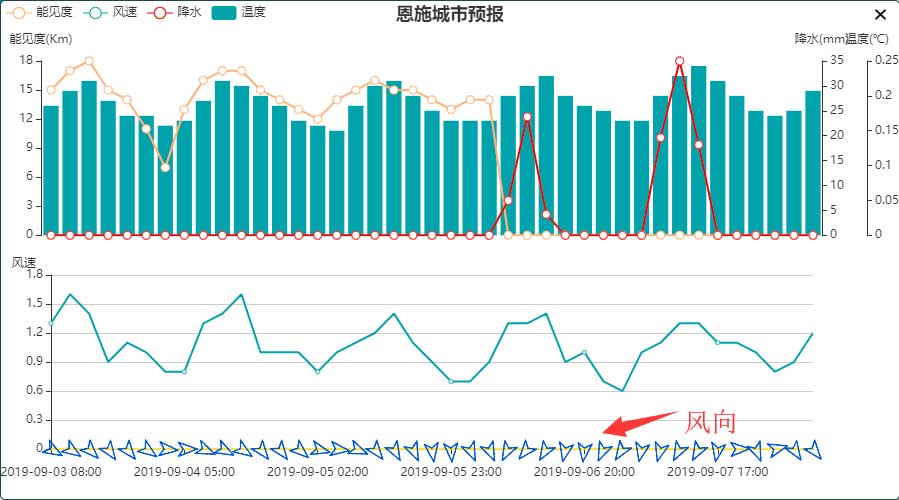
最近再一次遇到了做风向图的需求,不过还添加了更多要显示的元素,比如温度,降水,能见度,不过我发现我之前的方法有个问题,就是tooltip显示有问题,鼠标划到风级tooltip显示正常,但是划到能见度那块儿,tooltip显示的不对,元素和数据会错位,于是自己在此基础上,做了一个完美的改善方案,并且还可以设置dataZoom来拖拽,代码如下,这里我只写渲染代码,数据的话,自己处理后传入即可!
其中daytu就是要传入的数据,包含了温度,降水,能见度,风向,风速5个元素的值,可能大家的数据返回和我的不一样,这个自己针对自己的数据处理即可,重点在如何渲染Echarts图上
function drawEcharts(daytu) {
var myEcharts = echarts.init(document.getElementById('box'));
var timeData = [],windSpeed = [],opacity = [],windDir = [],rainArr = [],temp = [];
for(var i=0; i<daytu.length; i++) {
//横轴数据处理
timeData.push(daytu[i][0].vla.substring(0,daytu[i][0].vla.length-3));
//风向数据处理
windDir.push(daytu[i][3].vla);
//风速数据处理
windSpeed.push(daytu[i][2].vla);
//能见度数据处理
opacity.push(parseInt(daytu[i][6].vla/1000));
//降雨数据处理
rainArr.push(daytu[i][5].vla);
//温度数据处理
temp.push(parseInt(daytu[i][1].vla));
};
var tempArr = new Array(windSpeed.length).fill('0');
var ownData = echarts.util.map(tempArr, function (item, index) {
在这里不需要显示风向的tooltip,所以全部给它赋值为0
return {
value: tempArr[index],
symbolRotate:405-windDir[index]};
});
var option = {
color: ['#44A1A9','#FEDC29','#FFB67C','#D72A26'],
title: {
text: val.c2 + '城市预报',
x: 'center'
},
tooltip: {
trigger: 'axis',
axisPointer: {
animation: false
}
},
legend: {
data: ['能见度','风速','降水','温度'],
x: 'left'
},
toolbox: {
show: false,
feature: {
dataZoom: {
yAxisIndex: 'none'
},
restore: {},
saveAsImage: {}
}
},
axisPointer: {
link: {
xAxisIndex: 'all'
}
},
dataZoom:{
type: 'inside',
realtime: true,
start: 0,
end: 50,
xAxisIndex: [0, 1]
},
grid: [ {
left: 50,
right: 86,
height: '35%'
},
{
left: 50,
right: 86,
height: '35%',
top: '55%'
}],
xAxis: [
{
gridIndex: 1,
type: 'category',
boundaryGap: false,
axisLine: {
onZero: true
},
offset: 10,
data: timeData
},
{
show:false,
type: 'category',
boundaryGap: false,
axisLine: {
onZero: true
},
data: timeData,
position: 'bottom'
}
],
yAxis: [
{
nameLocation: 'end',
gridIndex: 1,
name: '风速',
type: 'value',
nameTextStyle: {
padding: [0, 60, -10, 6]
}
},
{
nameLocation: 'end',
name: '能见度(Km)',
type: 'value',
position: 'left',
offset: 10,
splitLine: {
show: false
}
//是否是反向坐标轴
//inverse: true
},
{
nameLocation: 'end',
name: '降水(mm)',
type: 'value',
position:'right',
offset: 9,
splitLine: {
show: false
}
},
{
nameLocation: 'end',
name: '温度(℃)',
type: 'value',
position:'right',
offset: 54,
splitLine: {
show: false
}
}
],
series: [
{
name: '风速',
type: 'line',
hoverAnimation: false,
data: windSpeed,
xAxisIndex: 0
},
{
// name: '风向',
type: 'line',
symbol:'image://plug-in/util/assets/image/wind.png',
symbolSize:'26',
hoverAnimation: false,
xAxisIndex: 0,
data: ownData,
showAllSymbol: true,
// 设置tooltip不显示
tooltip: {
trigger: 'item'
}
/* markLine: {
silent: true,
data: [{
yAxis: 1
}, {
yAxis: 3
}]
} */
},
{
name: '能见度',
type: 'line',
xAxisIndex: 1,
yAxisIndex: 1,
symbolSize: 8,
hoverAnimation: false,
//全部显示所有数据点
showAllSymbol: true,
data: opacity
/* markLine: {
silent: true,
data: [{
yAxis: 1200
}, {
yAxis: 3000
}]
} */
},
{
name: '降水',
type: 'line',
xAxisIndex: 1,
yAxisIndex: 3,
symbolSize: 8,
hoverAnimation: false,
//全部显示所有数据点
showAllSymbol: true,
data: rainArr
},
{
name: '温度',
type: 'bar',
xAxisIndex: 1,
yAxisIndex: 2,
symbolSize: 8,
hoverAnimation: false,
//全部显示所有数据点
showAllSymbol: true,
data: temp
}
]
};
myEcharts.setOption(option);
};
效果图如下:
大家如果有不清楚的随时留言讨论!

 浙公网安备 33010602011771号