

Andrew Ng机器学习课程,第一周作业,python版本
Liner Regression
1.梯度下降算法
Cost Function
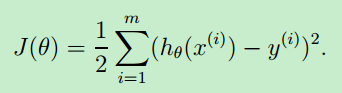
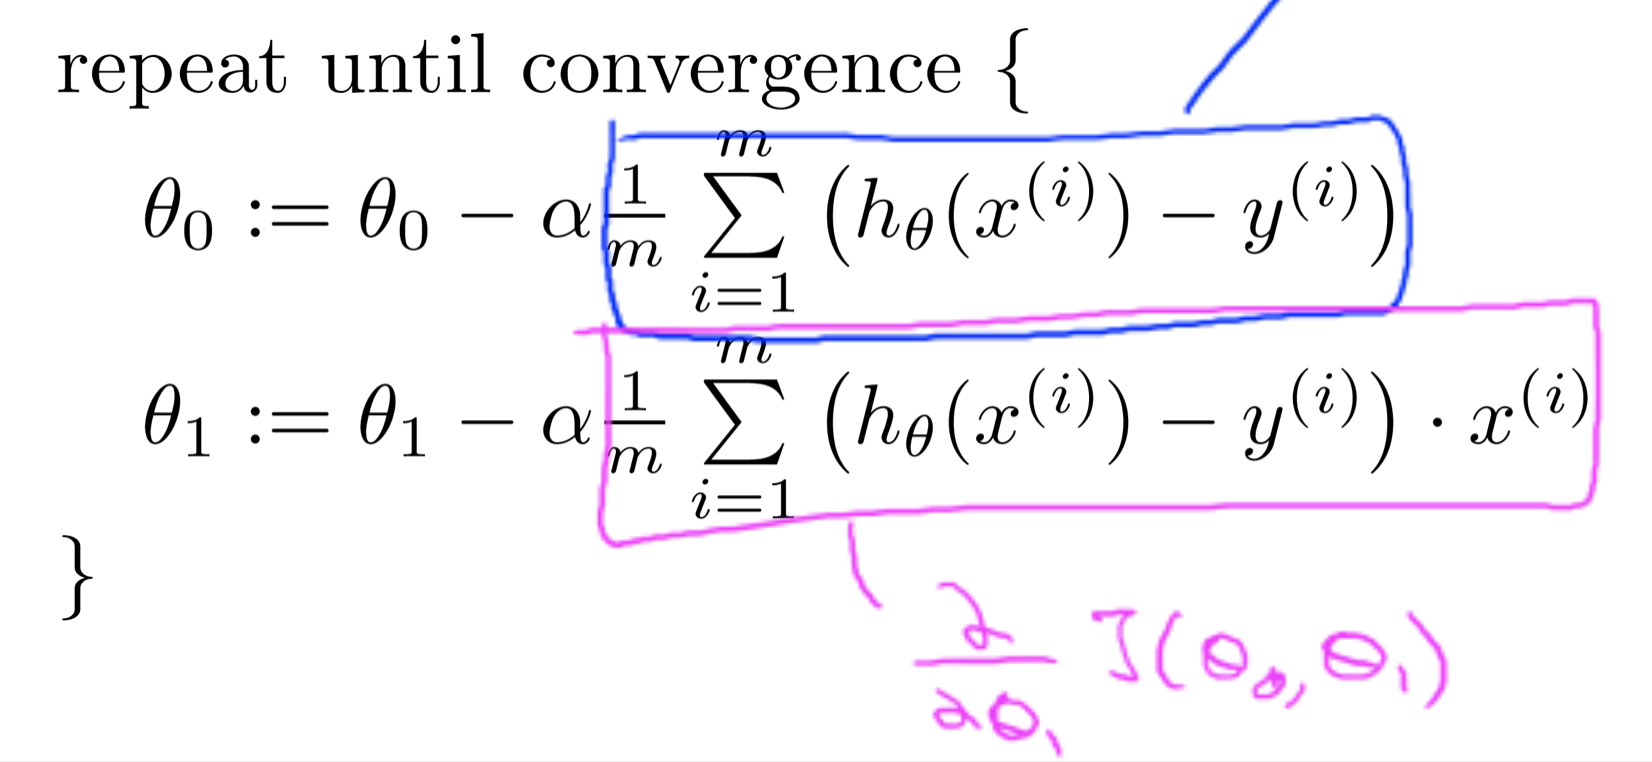
对其求导:

theta更新函数:
代码如下:
from numpy import *
import numpy as np
import matplotlib.pyplot as plt

def loadDataSet(filename):
    data = []
    label = []
    fr = open(filename)
    for line in fr.readlines():
        curLine = line.strip().split(',')
        a = [1.0]
        a.append(float(curLine[0]))
        data.append(a)
        label.append([float(curLine[1])])
    return data, label

def computeCost(X, Y, theta):
    theta = mat(theta)
    m = shape(X)[0]
    J = 1 / (2 * m) * sum(array((X * theta - Y))**2)
    return J

#矩阵形式的梯度下降算法
def gradientDescentMatrix(X, y, theta, alpha, iterations):
    m = shape(y)[0]
    theta_s = theta.copy()
    for i in range(iterations):
        theta = theta - alpha/m * (X.T *(X * theta - y))
    return theta

#梯度下降算法
def gradientDescent(X, y, theta, alpha, iterations):
    m = len(y)
    # theta_s = theta :此表达式中共享内存空间
    theta_s = theta.copy()
    for i in range(iterations):
        theta[0] = theta[0] - (alpha/m) * np.sum(np.mat(X)*np.mat(theta_s) - np.mat(y))
        p1 = np.mat(X)*np.mat(theta_s) - np.mat(y)
        p2 = X[:, 1]*p1
        # print(p2)
        theta[1] = theta[1] - (alpha / m) * p2
        # print(theta[1])
        theta_s = theta.copy()
    return theta

def Plotting(x, y, theta):
    f2 = plt.figure(2)
    p1 = plt.scatter(x, y, marker='x', color='r', label='Training Data', s=30)

    x1 = np.linspace(0, 25, 30)
    y1 = theta[0] + theta[1] * x1

    plt.plot(x1, y1, label="Test Data", color='b')

    plt.legend(loc='upper right')
    plt.show()

dataSet, label = loadDataSet("ex1data1.txt")
theta = zeros((2, 1))
iterations = 1500
alpha = 0.01

#数组格式X, Y
X = array(dataSet)
Y = array(label)

#矩阵格式 XMat, YMat
XMat = mat(X)
YMat = mat(Y)

if 1:  #梯度下降算法
    theta = gradientDescent(X, Y, theta, alpha, iterations)
else:  #矩阵形式的梯度下降算法
    theta = gradientDescentMatrix(XMat, YMat, mat(theta), alpha, iterations)
print(theta)

x = []
for k in dataSet:
    x.append([k[1]])
Plotting(array(x), Y, theta)
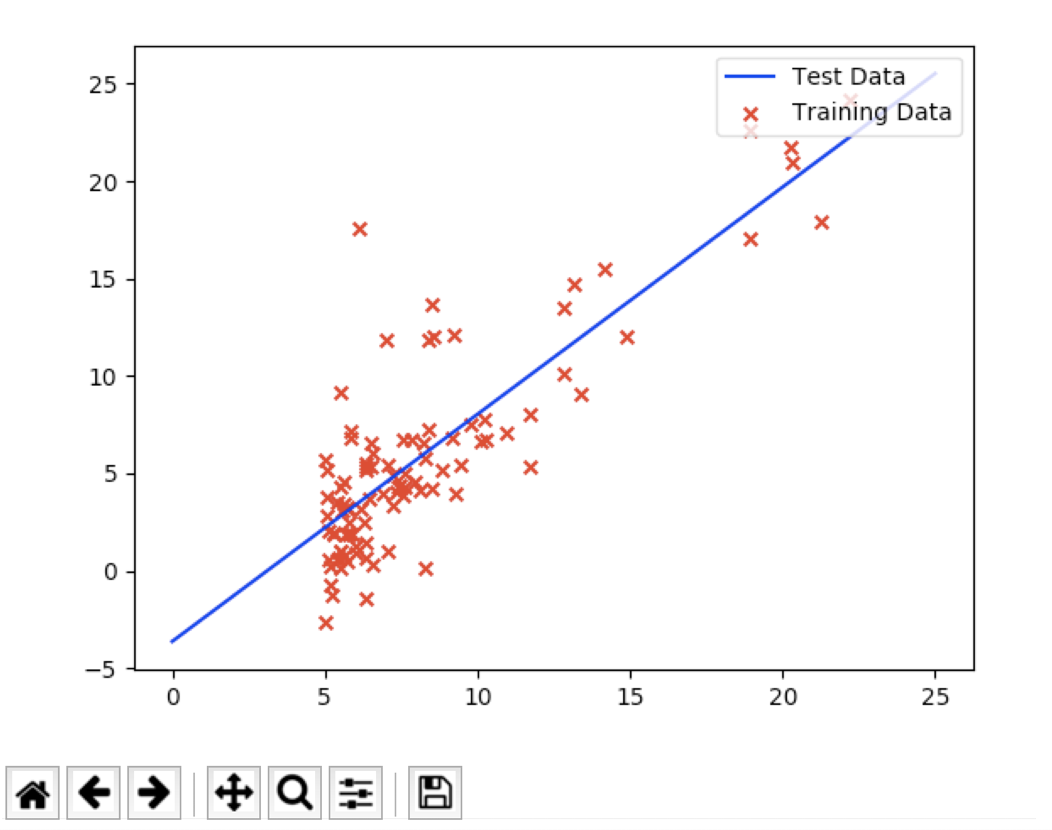
代码中对于梯度下降算法有两种形式,一种就是一般形式 gradientDescent(),另一种就是矩阵形式gradientDescentMatrix()
运行效果:

 浙公网安备 33010602011771号