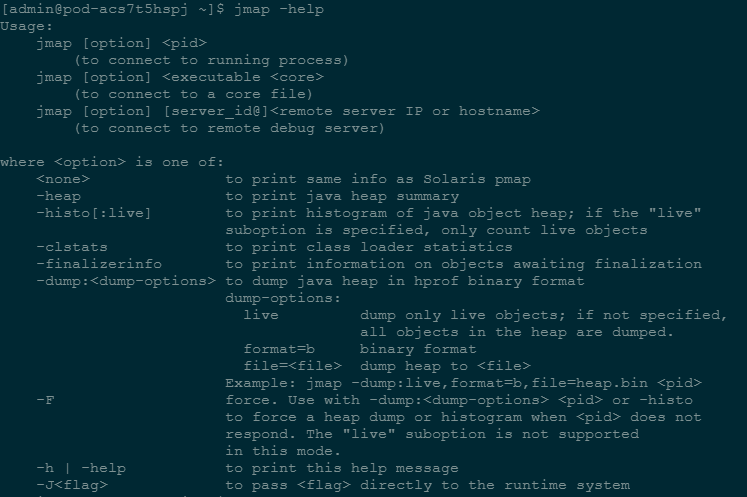
学习笔记——JVM性能调优之 jmap
jstat [ option ] pid
jstat [ option ] executable core
jstat [ option ] [pid] [ server-id@ ] remote-hostname-or-IP
option :命令参数。
pid : 要为其打印内存映射的进程ID。该进程必须是java进程,可通过jps命 令查看。
     (process id for which the memory map is to be printed. The process must be a Java process. To get a list of Java processes running on a machine, jps may be used.)
executable:生成核心dump的Java可执行文件。
     (Java executable from which the core dump was produced.)
core:需要打印配置信息的核心文件。
     (core file for which the memory map is to be printed.)
server-id:可选的唯一id,如果相同的远程主机上运行了多台调试服务器,用此选项参数标识服务器。
     (optional unique id, if multiple debug servers are running on the same remote host.)
remote-hostname-or-IP:远程调试服务器的IP地址或主机名。
     (remote debug server's (see jsadebugd) hostname or IP address.)
option参数:
-
< no option > 如果不使用任何选项,则将打印共享对象映射。
对于目标VM中加载的每个共享库,将会打印起始地址,映射的大小以及共享库文件的完整路径。这类似于Solaris pmap实用程序。(When no option is used **jmap** prints shared object mappings. For each shared object loaded in the target VM, start address, the size of the mapping, and the full path of the shared object file are printed. This is similar to the Solaris **pmap** utility.)

从前到后依次为:共享库起始地址 映射大小 共享库文件的完整路径
-
-heap 打印堆摘要信息,打印使用的GC算法,堆配置信息和堆内存使用信息。(Prints a heap summary. GC algorithm used, heap configuration and generation wise heap usage are printed.)


[admin@pod-in5kpa01k5 ~]$ jmap -heap 13074
Attaching to process ID 13074, please wait...
Debugger attached successfully.
Server compiler detected.
JVM version is 25.51-b03

using thread-local object allocation.
Parallel GC with 4 thread(s) #有两种组合 其中新生代采用并行处理方式--Parallel Scavenge 收集器
                             # 老年代可选 -XX:+UseParallelGC -- PSMarkSweep(Serial Old) 串行
                             #           -XX:+UserParallelOldGC  --  Parallel Old     并行

Heap Configuration:   # 堆配置信息(项目启动前配置的JVM参数)
   MinHeapFreeRatio         = 0        # -XX:MinHeapFreeRatio 最小空闲比例(default 40)
   MaxHeapFreeRatio         = 100    # -XX:MaxHeapFreeRatio 最大空闲比例(default 70)
   MaxHeapSize              = 2147483648 (2048.0MB) # -XX:MaxHeapSize 堆空间最大大小
   NewSize                  = 715653120 (682.5MB)   # -XX:NewSize    新生代默认大小
   MaxNewSize               = 715653120 (682.5MB)   # -XX:MaxNewSize 新生代最大大小
   OldSize                  = 1431830528 (1365.5MB) # -XX:OldSize    老年代默认大小
   NewRatio                 = 2  # -XX:NewRatio  新生代:老年代(不包括永久代),2表示 1:2
   SurvivorRatio            = 8  # -XX:SurvivorRatio Survivor和Eden的比值,8标识 1:1:8
   MetaspaceSize            = 268435456 (256.0MB) # 元空间默认大小
   CompressedClassSpaceSize = 1073741824 (1024.0MB) # 压缩类 空间 默认大小
   MaxMetaspaceSize         = 17592186044415 MB   # -XX:MaxMetaspaceSize 元空间最大大小
   G1HeapRegionSize         = 0 (0.0MB)
   # 在使用G1垃圾收集器时,JVM会将堆空间分隔为若干个Region,该参数用来指定每个Region空间的大小

Heap Usage:            #  堆内存实际使用情况
PS Young Generation # --- 新生代
Eden Space:            # Eden空间
   capacity = 537395200 (512.5MB)                # Eden区总容量
   used     = 133469040 (127.28599548339844MB)    # Eden区已使用
   free     = 403926160 (385.21400451660156MB)    # Eden区剩余容量
   24.83629180163872% used        # 使用 百分比
From Space:            # From空间
   capacity = 89128960 (85.0MB)                    # From区总容量
   used     = 40510936 (38.634239196777344MB)    # From区已使用
   free     = 48618024 (46.365760803222656MB)    # From区剩余容量
   45.4520461138557% used        # 使用 百分比
To Space:            # To空间
   capacity = 89128960 (85.0MB)        # To区总容量
   used     = 0 (0.0MB)                # To区已使用
   free     = 89128960 (85.0MB)        # To区剩余容量
   0.0% used                    # 使用百分比
PS Old Generation    # --- 老年代
   capacity = 1431830528 (1365.5MB)    # 老年代总空间
   used     = 180256 (0.171905517578125MB)        # 老年代已使用
   free     = 1431650272 (1365.3280944824219MB)    # 老年代剩余容量
   0.01258919938323874% used    # 使用 百分比

29573 interned Strings occupying 3039224 bytes.
-
-histo[:live] 显示堆的统计信息,包括对象数量,实例,内存占用,类名。
打印虚拟机内部的类名称将会带有一个 * 前缀。(Prints a histogram of the heap. For each Java class, number of objects, memory size in bytes, and fully qualified class names are printed. VM internal class names are printed with '*' prefix.)
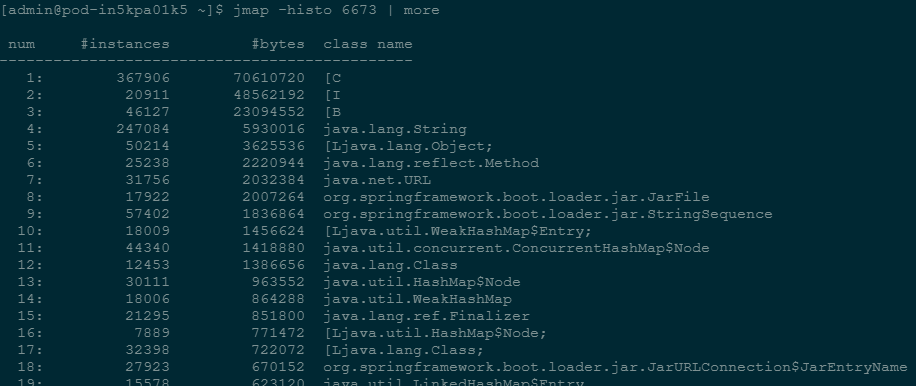
B - byte、C - char、D - double、F - float、I - int、J - long、Z - boolean
[ - 表示数组(如[C 表示 char[])、[L + 类名 表示 其他对象
-
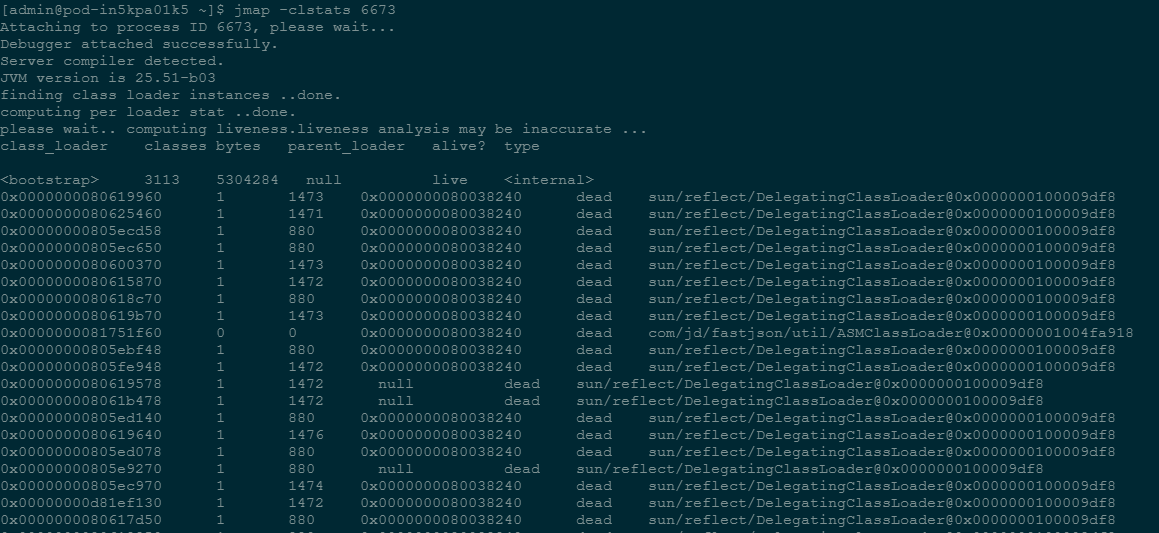
-clstats 打印堆内存永久代类加载器信息。
对于每个类加载器,打印其名称、活跃度、地址、父类加载器 以及它所加载的类的数量和大小(Prints class loader wise statistics of Java heap. For each class loader, its name, how active it is, address, parent class loader, and the number and size of classes it has loaded are printed.)
-
-finalizerinfo 打印等待回收的对象信息。(Prints information about objects that are awaiting finalization.)
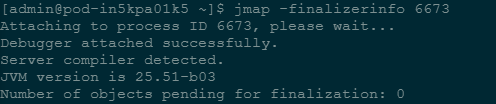
Number of objects pending for finalization: 0 (等待回收的对象为0个)
-
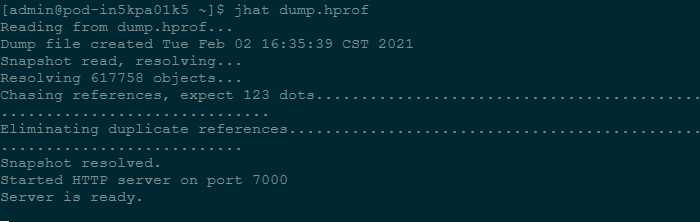
-dump[:live,] format=b,file=filename 使用 hprof 二进制形式,输出 jvm 的 heap 内容到文件。
live子选项是可选的。如果指定了live子选项,堆中只有活动的对象会被转储。可以通过jhat打开该文件,通过http去访问。(Dumps the Java heap in hprof binary format to filename. The live suboption is optional, but when specified, only the active objects in the heap are dumped. To browse the heap dump, you can use the jhat(1) command to read the generated file.)

这个命令执行,JVM会将整个heap的信息dump写入到一个文件,heap如果比较大的话,就会导致这个过程比较耗时,
并且执行的过程中为了保证dump的信息是可靠的,所以会暂停应用, 线上系统慎用。
-
-F

可强制执行,但指定不正确的端口号时会报错。只有明确端口号但未响应时才可使用。
-------------------------------------------
如果有错误或者更优化的解决方案,欢迎大家在评论区留言探讨。
也可以给我的个人公众号私信留言。
如果觉得这篇文章对你有小小的帮助的话,记得在右下角点个“推荐”哦,博主在此感谢!


 浙公网安备 33010602011771号