python 用 matplotlib 的 patch 模块绘制椭圆详解
0、import
import numpy as np
import matplotlib.pyplot as plt
from matplotlib.patches import Ellipse
1、绘制形状
# 创建画布
fig = plt.figure(figsize=(12, 8),
                 facecolor='beige',    # 米黄色
                )
# 划分子区
axes = fig.subplots(nrows=2,
                    ncols=3,
                    subplot_kw={'aspect': 'equal'}
                  )

# ---------------------------------  subplot(221) ---------------------------------
ax = axes[0, 0]

angles = np.linspace(0, 135, 4)    # 线型序列
ellipses = [Ellipse(xy=(2,2),    # 中心
                    width=4,    # 长半轴
                    height=2,    # 短半轴
                    angle=a,    # 旋转角度(逆时针)
                   ) for a in angles
           ]

for ellipse in ellipses:
    ax.add_patch(p=ellipse)    # 向子区添加形状
    ellipse.set(alpha=0.4,
                color='lightskyblue'
               )

ax.axis([-1, 5, -1, 5])    # 坐标轴刻度范围 [xmin, xmax, ymin, ymax]

# ---------------------------------  subplot(222) ---------------------------------
ax = axes[0, 1]

angles = np.linspace(0, 180, 4, endpoint=False)    # 线型序列
ellipses = [Ellipse(xy=(2,2),    # 中心
                    width=4,    # 长半轴
                    height=2,    # 短半轴
                    angle=a,    # 旋转角度(逆时针)
                   ) for a in angles
           ]

for ellipse in ellipses:
    ax.add_patch(p=ellipse)    # 向子区添加形状
    ellipse.set(alpha=0.4,
                fc='r',    # facecolor, red
                ec='g',    # edgecolor, green
                lw=3,    # line width
               )

ax.axis([-1, 5, -1, 5])    # 坐标轴刻度范围 [xmin, xmax, ymin, ymax]

# --------------------------------- subplot(223) ---------------------------------
ax = axes[0, 2]

angles = np.linspace(0, 180, 4, endpoint=False)    # 线型序列
ellipses = [Ellipse(xy=(2,2),    # 中心
                    width=6,    # 长半轴
                    height=2,    # 短半轴
                    angle=a,    # 旋转角度(逆时针)
                   ) for a in angles
           ]

for ellipse in ellipses:
    ax.add_patch(p=ellipse)    # 向子区添加形状
    ellipse.set(alpha=0.5,
                fc='y',    # facecolor, red
                ec='r',    # edgecolor, green
                lw=3,    # line width
                ls=':',    # line style
               )

ax.set(xlim=(-1, 5),     # 坐标轴刻度范围 (xmin, xmax)
       ylim=(-1, 5),    #  ymin, ymax
       fc='green',
      )
# ---------------------------------  subplot(224) ---------------------------------
ax = axes[1, 0]

ellipses = [Ellipse(xy=np.random.rand(2)*10,    # 中心,在 0~1 上均匀分布的 1 个 1*2 的数组
                    width=np.random.rand(1),    # 长半轴, 在 0~1 上均匀分布的 1 个 float
                    height=np.random.rand(1),    # 短半轴
                    angle=np.random.rand(1)*360,    # 旋转角度(逆时针)
                   ) for a in range(100)
           ]

for ellipse in ellipses:
    ax.add_patch(p=ellipse)    # 向子区添加形状
    ellipse.set(alpha=np.random.rand(1)[0],    # alpha 需是 float
                color=np.random.rand(3)    # 3 元 RGB 序列,在 0~1 上均匀分布的 1 个 1*3 的数组
               )

ax.axis([-1, 11, -1, 11])    # 坐标轴刻度范围 [xmin, xmax, ymin, ymax]

# ---------------------------------  subplot(225) ---------------------------------
ax = axes[1, 1]

ellipses = [Ellipse(xy=np.random.rand(2)*10,    # 中心,在 0~1 上均匀分布的 1 个 1*2 的数组
                    width=np.random.rand(1),    # 长半轴, 在 0~1 上均匀分布的 1 个 float
                    height=np.random.rand(1),    # 短半轴
                    angle=np.random.rand(1)*360,    # 旋转角度(逆时针)
                   ) for a in range(200)
           ]

for ellipse in ellipses:
    ax.add_patch(p=ellipse)    # 向子区添加形状
    ellipse.set(alpha=np.random.rand(1)[0],    # alpha 需是 float
                fc=np.random.rand(3),    # 3 元 RGB 序列,在 0~1 上均匀分布的 1 个 1*3 的数组
                ec=np.random.rand(3),
                lw=2
               )

ax.axis([-1, 11, -1, 11])    # 坐标轴刻度范围 [xmin, xmax, ymin, ymax]

# ---------------------------------  subplot(226) ---------------------------------
ax = axes[1, 2]

ellipses = [Ellipse(xy=np.random.rand(2)*10,    # 中心,在 0~1 上均匀分布的 1 个 1*2 的数组
                    width=np.random.rand(1),    # 长半轴, 在 0~1 上均匀分布的 1 个 float
                    height=np.random.rand(1),    # 短半轴
                    angle=np.random.rand(1)*360,    # 旋转角度(逆时针)
                   ) for a in range(200)
           ]

for ellipse in ellipses:
    ax.add_patch(p=ellipse)    # 向子区添加形状
    ellipse.set(alpha=np.random.rand(1)[0],    # alpha 需是 float
                fc=np.random.rand(3),    # 3 元 RGB 序列,在 0~1 上均匀分布的 1 个 1*3 的数组
                ec=np.random.rand(3),
                lw=np.random.normal(loc=1,
                                    scale=1,
                                    size=1),    # 服从期望为 1, 标准差为 1 的正态分布 1 个 float
               )

ax.set(xlim=(-1, 11),    # 坐标轴刻度范围 (xmin, xmax)
       ylim=(-1, 11),    # (ymin, ymax)
       fc='cornsilk',
      )

# 显示图形
plt.show()
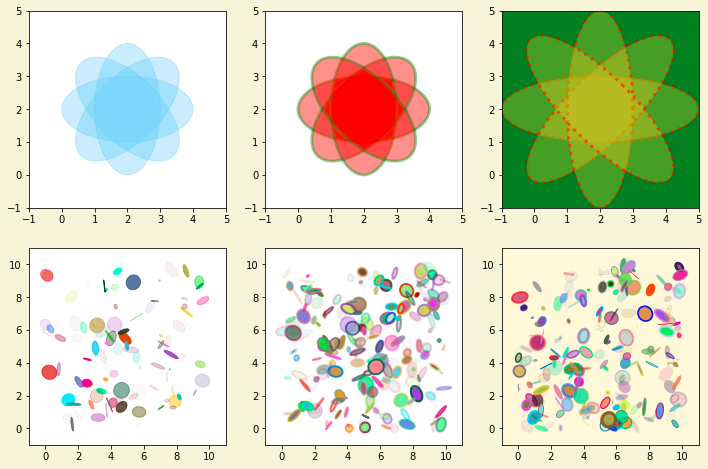
图形:

软件版本信息:

非学无以广才,非志无以成学。

 浙公网安备 33010602011771号