python 用 matplotlib 绘制圆环形嵌套饼图步骤详解
1、加载库
import matplotlib as mpl
import matplotlib.pyplot as plt
2、单层圆环饼图
# 配置字体,显示中文
mpl.rcParams['font.sans-serif'] = ['SimHei']
# 配置坐标轴刻度值模式,显示负号
mpl.rcParams['axes.unicode_minus'] = False
# 定义数据
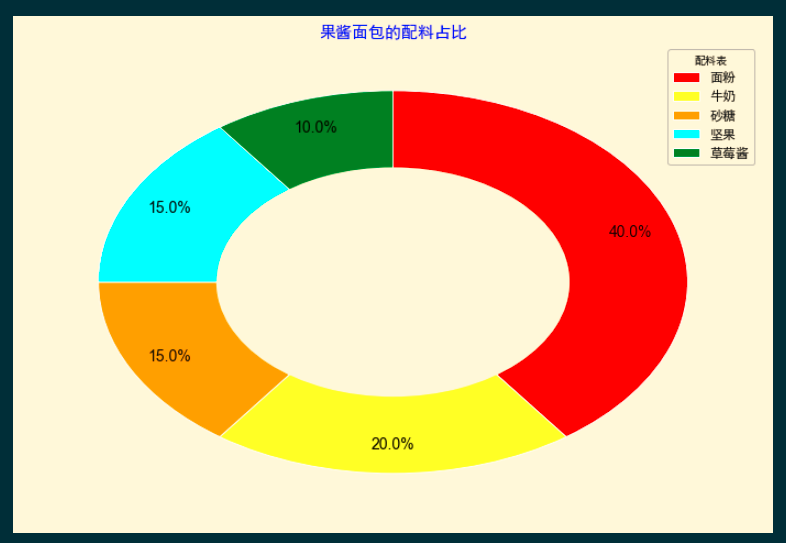
elements = ['面粉', '砂糖', '牛奶', '草莓酱', '坚果']
weight1 = [40, 15, 20, 10, 15]
cs = ['red', 'orange', 'yellow', 'green', 'cyan']
# 对数据进行排序
x = list(zip(elements, weight1, cs))
x.sort(key=lambda e: e[1], reverse=True)
[elements, weight1, cs] = list(zip(*x))
outer_cs = cs
inner_cs = cs
# 初始化图表区
fig = plt.figure(figsize=(12, 8),
facecolor='cornsilk'
)
# 绘制外层圆环
wedges1, texts1, autotexts1 = plt.pie(x=weight1,
autopct='%3.1f%%',
radius=1,
pctdistance=0.85,
startangle=90,
counterclock=False,
colors=outer_cs,
# 锲形块边界属性字典
wedgeprops={'edgecolor': 'white',
'linewidth': 1,
'linestyle': '-'
},
# 锲形块标签文本和数据标注文本的字体属性
textprops=dict(color='k', # 字体颜色
fontsize=14,
family='Arial'
)
)
# 绘制中心空白区域
plt.pie(x=[1],
radius=0.6,
colors=[fig.get_facecolor()]
)
# 设置图例
plt.legend(handles=wedges1,
loc='best',
labels=elements,
title='配料表',
facecolor = fig.get_facecolor(), # 图例框的填充颜色
edgecolor='darkgray',
fontsize=12
)
plt.title(s='果酱面包的配料表占比',
color='blue',
size=15,
weight='bold'
);
图形:
3、内嵌圆环形饼图
# 配置字体,显示中文
mpl.rcParams['font.sans-serif'] = ['SimHei']
# 配置坐标轴刻度值模式,显示负号
mpl.rcParams['axes.unicode_minus'] = False

# 定义数据
elements = ['面粉', '砂糖', '牛奶', '草莓酱', '坚果']
weight1 = [40, 15, 20, 10, 15]
weight2 = [30, 25, 15, 20, 10]
cs = ['red', 'orange', 'yellow', 'green', 'cyan']

# 对数据进行排序
x = list(zip(elements, weight1, weight2, cs))
x.sort(key=lambda e: e[1], reverse=True)
[elements, weight1, weight2, cs] = list(zip(*x))

# 初始化图表区
fig = plt.figure(figsize=(12, 8),
                 facecolor='cornsilk'
                )

# 绘制外层圆环
wedges1, texts1, autotexts1 = plt.pie(x=weight1,
                                      autopct='%3.1f%%',
                                      radius=1,
                                      pctdistance=0.85,
                                      startangle=90,
                                      counterclock=False,
                                      colors=cs,
                                      # 锲形块边界属性字典
                                      wedgeprops={'edgecolor': 'white',
                                                  'linewidth': 1,
                                                  'linestyle': '-'
                                                  },
                                      # 锲形块标签文本和数据标注文本的字体属性
                                      textprops=dict(color='k',  #  字体颜色
                                                     fontsize=14,
                                                     family='Arial'
                                                     )
                                     )

# 绘制内层圆环
wedges2, texts2, autotexts2 = plt.pie(x=weight2,
                                      autopct='%3.1f%%',
                                      radius=0.7,
                                      pctdistance=0.75,
                                      startangle=90,
                                      counterclock=False,
                                      colors=inner_cs,
                                      # 锲形块边界属性字典
                                      wedgeprops={'edgecolor': 'white',
                                                  'linewidth': 1,
                                                  'linestyle': '-'
                                                  },
                                      # 锲形块标签文本和数据标注文本的字体属性
                                      textprops=dict(color='k',  #  字体颜色
                                                     fontsize=14,
                                                     family='Arial'
                                                     )
                                     )

# 绘制中心空白区域
plt.pie(x=[1],
        radius=0.4,
        colors=[fig.get_facecolor()]
       )

# 设置图例
plt.legend(handles=wedges1,
           loc='best',
           labels=elements,
           title='配料表',
           facecolor = fig.get_facecolor(),    # 图例框的填充颜色
           edgecolor='darkgray',
           fontsize=12
          )

plt.title(s='不同果酱面包的配料表比较',
          color='blue',
          size=15,
          weight='bold'
         );
图形:

非学无以广才,非志无以成学。

 浙公网安备 33010602011771号