
php的调试工具xdebug
zend_extension = "D:/developsoftware/wamp/bin/php/php5.5.12/zend_ext/php_xdebug-2.2.5-5.5-vc11-x86_64.dll"
;
[xdebug]
xdebug.remote_enable = off
xdebug.profiler_enable = off
xdebug.profiler_enable_trigger = off
xdebug.profiler_output_name = cachegrind.out.%t.%p
xdebug.profiler_output_dir = "D:/developsoftware/wamp/tmp"
xdebug.show_local_vars=0
上面是配置文件自带的
;zend extension="D:/developsoftware/wamp/bin/php/php5.5.12/zend_ext/php_xdebug-2.2.5-5.5-vc11-x86_64.dll"
;[xdebug]
;xdebug.remote_enable=On
;xdebug.profiler_enable=On
;xdebug.profiler_enable_trigger=On
;xdebug.profiler_output_name=cachegrind.out.%t.%p
;xdebug.profiler_output_dir="D:/developsoftware/wamp/tmp"
;xdebug.show_local_vars=0
下面是在网上找的,感谢:http://jingyan.baidu.com/album/cbcede0729988102f40b4d9c.html?picindex=2
下面是最终配置:
zend_extension = "D:/developsoftware/wamp/bin/php/php5.5.12/zend_ext/php_xdebug-2.2.5-5.5-vc11-x86_64.dll"
;
[xdebug]
;xdebug.remote_enable = off
;xdebug.profiler_enable = off
;xdebug.profiler_enable_trigger = off
;xdebug.profiler_output_name = cachegrind.out.%t.%p
;xdebug.profiler_output_dir = "D:/developsoftware/wamp/tmp"
;xdebug.show_local_vars=0
;上面是软件自带的配置已经基本全部注释
;zend extension="D:/developsoftware/wamp/bin/php/php5.5.12/zend_ext/php_xdebug-2.2.5-5.5-vc11-x86_64.dll"
;[xdebug]
;xdebug.remote_enable=On
;xdebug.profiler_enable=On
;xdebug.profiler_enable_trigger=On
;xdebug.profiler_output_name=cachegrind.out.%t.%p
;xdebug.profiler_output_dir="D:/developsoftware/wamp/tmp"
;xdebug.show_local_vars=0
;下面是Xdebug在php100中复制的配置感谢php100
;是否开启自动跟踪
xdebug.auto_trace = On
;是否开启异常跟踪
xdebug.show_exception_trace = On
;是否开启远程调试自动启动
xdebug.remote_autostart = On
;是否开启远程调试
xdebug.remote_enable = On
;允许调试的客户端IP
xdebug.remote_host=192.168.1.107
;远程调试的端口(默认9000)
xdebug.remote_port=9000
;调试插件dbgp
xdebug.remote_handler=dbgp
;是否收集变量
xdebug.collect_vars = On
;是否收集返回值
xdebug.collect_return = On
;是否收集参数
xdebug.collect_params = On
;跟踪输出路径
xdebug.trace_output_dir="d:\xdebug"
;是否开启调试内容
xdebug.profiler_enable=On
;调试输出路径
xdebug.profiler_output_dir="d:\xdebug"
;下面是开启Xdebug的内置函数的配置:
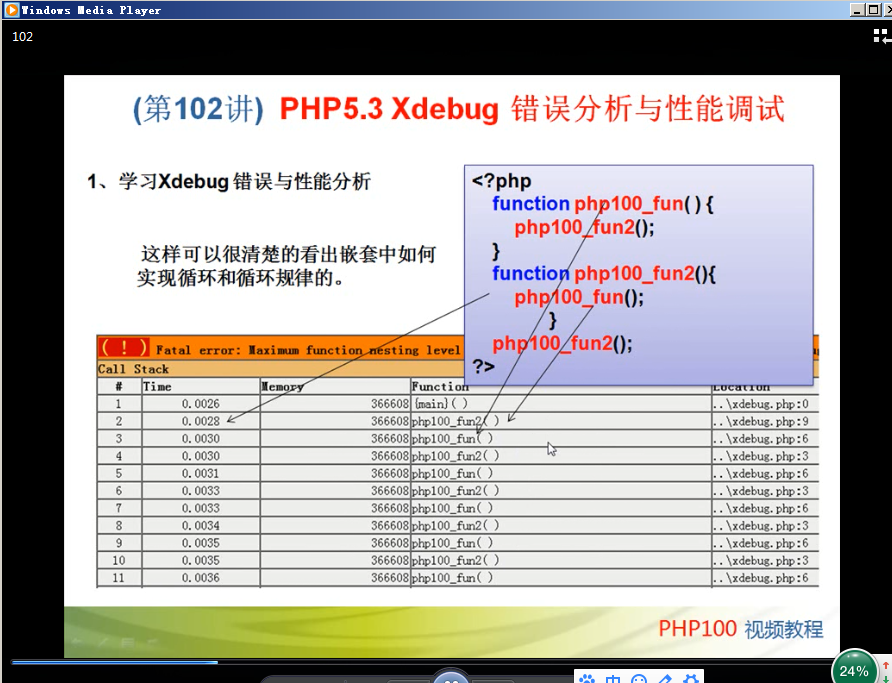
xdebug.max_nesting_level = 50 最大循环或调试次数,防止死循环
xdebug.dump_once = On
xdebug.dump_globals = On
xdebug.dump_undefined = On
xdebug.dump.SERVER = REQUEST_METHOD,REQUEST_URI,HTTP_USER_AGENT
xdebug.dump.REQUEST=*
xdebug.show_exception_trace = On 仍将强制执行异常跟踪
xdebug.show_local_vars = 1
;将打印每个函数调用的最外围中的所有局部变量,包括尚未初始化的变量
xdebug.var_display_max_depth = 6
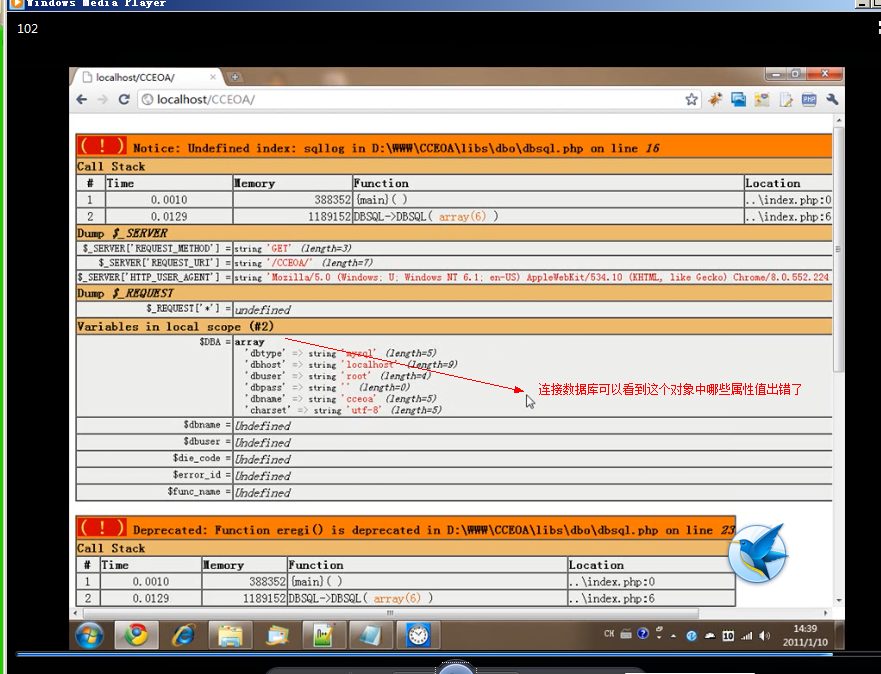
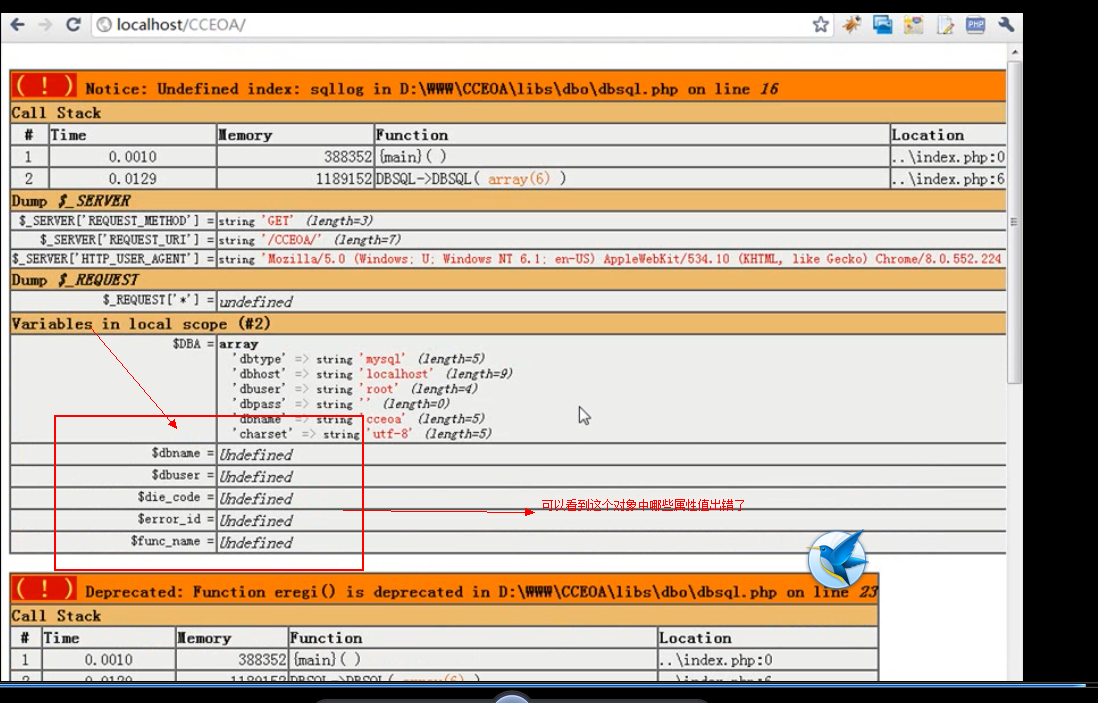
下面是安装调试工具后的调试效果:


 浙公网安备 33010602011771号