python profile性能分析
#! /usr/bin/env python
# encoding=utf8
import profile
def func1():
    for i in range(1000):
        pass
def func2():
    for i in range(1000):
        func1()
profile.run("func2()")
输出:
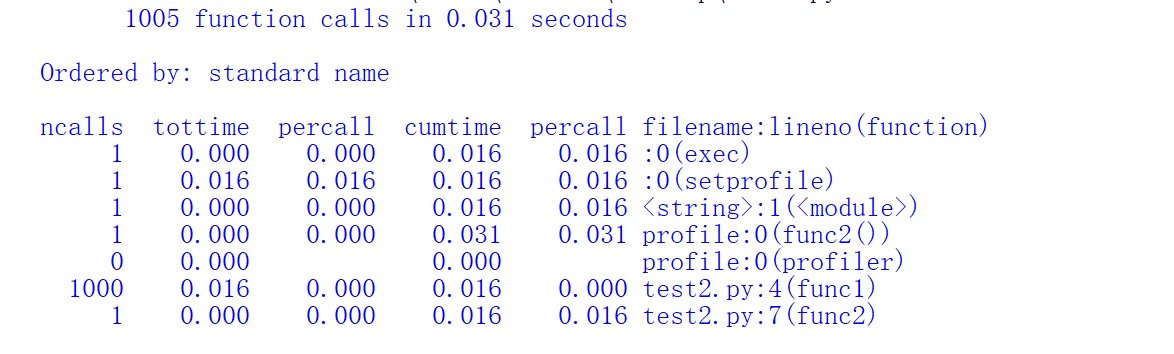
其中输出每列的具体解释如下:
●ncalls:表示函数调用的次数;
●tottime:表示指定函数的总的运行时间,除掉函数中调用子函数的运行时间;
●percall:(第一个 percall)等于 tottime/ncalls;
●cumtime:表示该函数及其所有子函数的调用运行的时间,即函数开始调用到返回的时间;
●percall:(第二个 percall)即函数运行一次的平均时间,等于 cumtime/ncalls;
●filename:lineno(function):每个函数调用的具体信息;
如果需要将输出以日志的形式保存,只需要在调用的时候加入另外一个参数。如 profile.run(“profileTest()”,”testprof”)。

 浙公网安备 33010602011771号