k8s prometheus展示数据对象
k8s-prometheus展示数据对象
1. k8s-prometheus+grafana展示
-
编写grafana展示的配置文件
[root@k8s-master prometheus]# cat grafana.yaml
apiVersion: apps/v1
kind: Deployment
metadata:
  name: grafana
  namespace: ops
spec:
  replicas: 1
  selector:
    matchLabels:
      app: grafana
  template:
    metadata:
      labels:
        app: grafana
    spec:
      containers:
      - name: grafana
        image: grafana/grafana:7.1.0
        ports:
          - containerPort: 3000
            protocol: TCP
        resources:
          limits:
            cpu: 100m
            memory: 256Mi
          requests:
            cpu: 100m
            memory: 256Mi
        volumeMounts:
          - name: grafana-data
            mountPath: /var/lib/grafana
            subPath: grafana
      securityContext:
        fsGroup: 472
        runAsUser: 472
      volumes:
      - name: grafana-data
        persistentVolumeClaim:
          claimName: grafana
---
apiVersion: v1
kind: PersistentVolumeClaim
metadata:
  name: grafana
  namespace: ops
spec:
  storageClassName: "managed-nfs-storage"
  accessModes:
    - ReadWriteMany
  resources:
    requests:
      storage: 5Gi
---
apiVersion: v1
kind: Service
metadata:
  name: grafana
  namespace: ops
spec:
  type: NodePort
  ports:
  - port : 80
    targetPort: 3000
    nodePort: 30030
  selector:
    app: grafana
2. 案例
-
执行配置文件
[root@k8s-master prometheus]# kubectl apply -f grafana.yaml deployment.apps/grafana unchanged persistentvolumeclaim/grafana unchanged service/grafana unchanged -
查看是否启动
[root@k8s-master prometheus]# kubectl get pods,svc -n ops NAME READY STATUS RESTARTS AGE pod/grafana-757fcd5f7c-twbmj 1/1 Running 0 40m pod/prometheus-859dbbc5f7-rlsqp 2/2 Running 0 22h NAME TYPE CLUSTER-IP EXTERNAL-IP PORT(S) AGE service/grafana NodePort 10.108.238.42 <none> 80:30030/TCP 40m service/prometheus NodePort 10.108.53.165 <none> 9090:30090/TCP 22h -
浏览器访问测试:http://ip:30030
![image]()
初次用户名和密码都是admin/admin
-
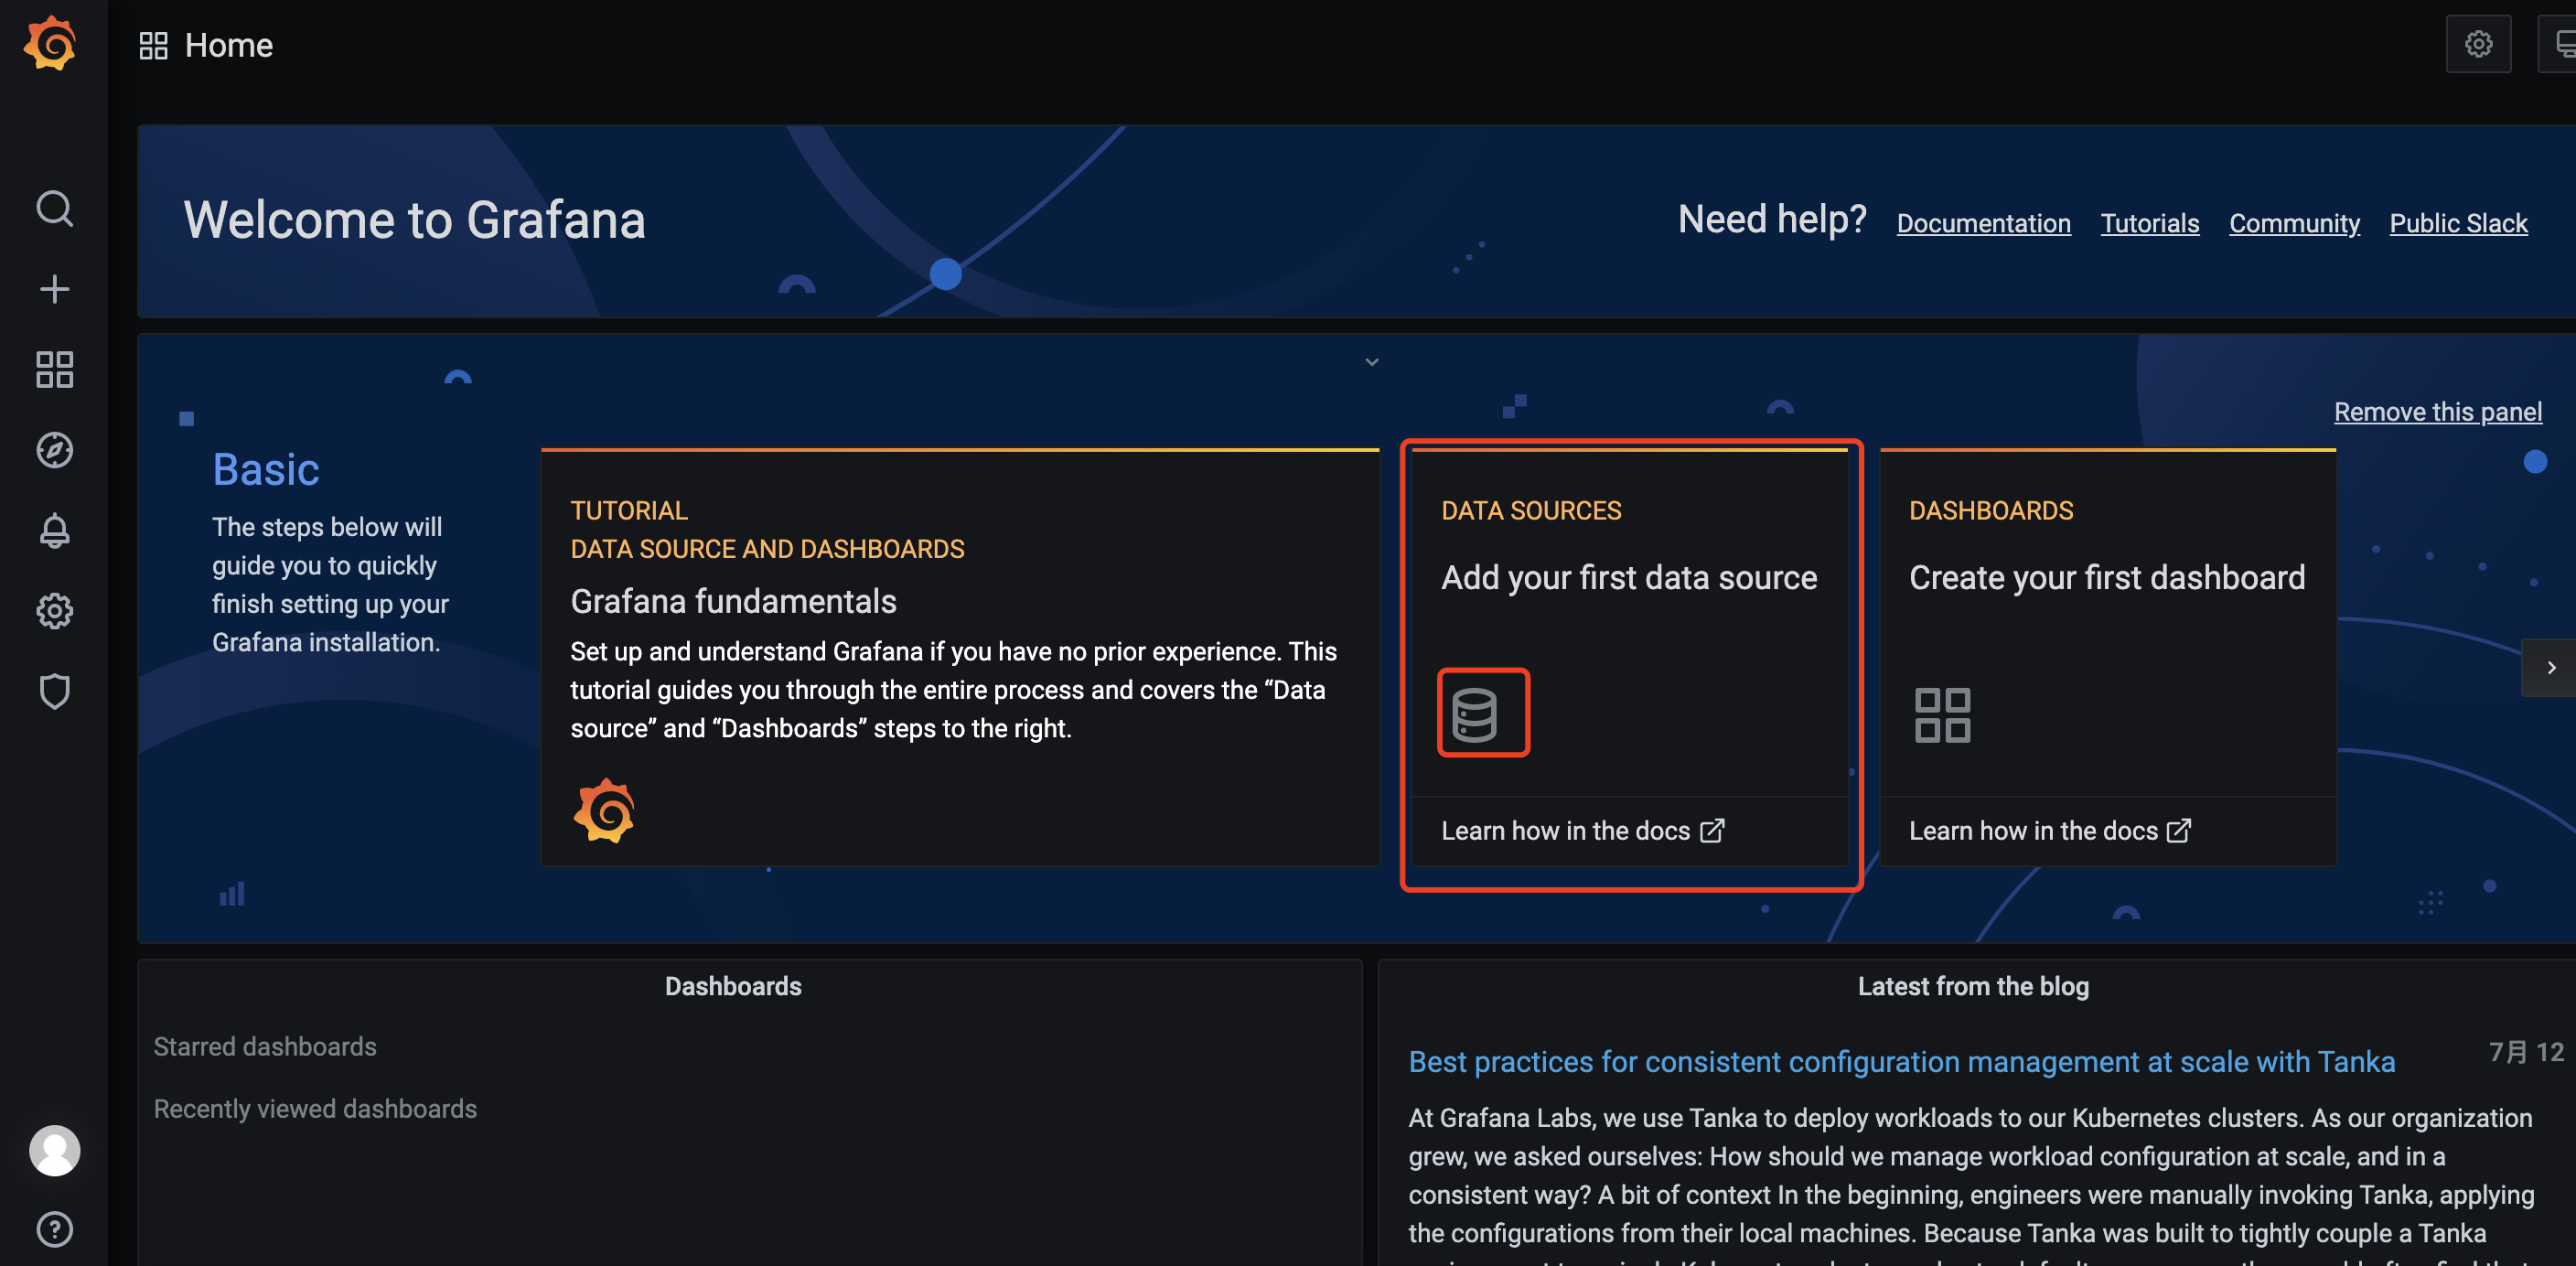
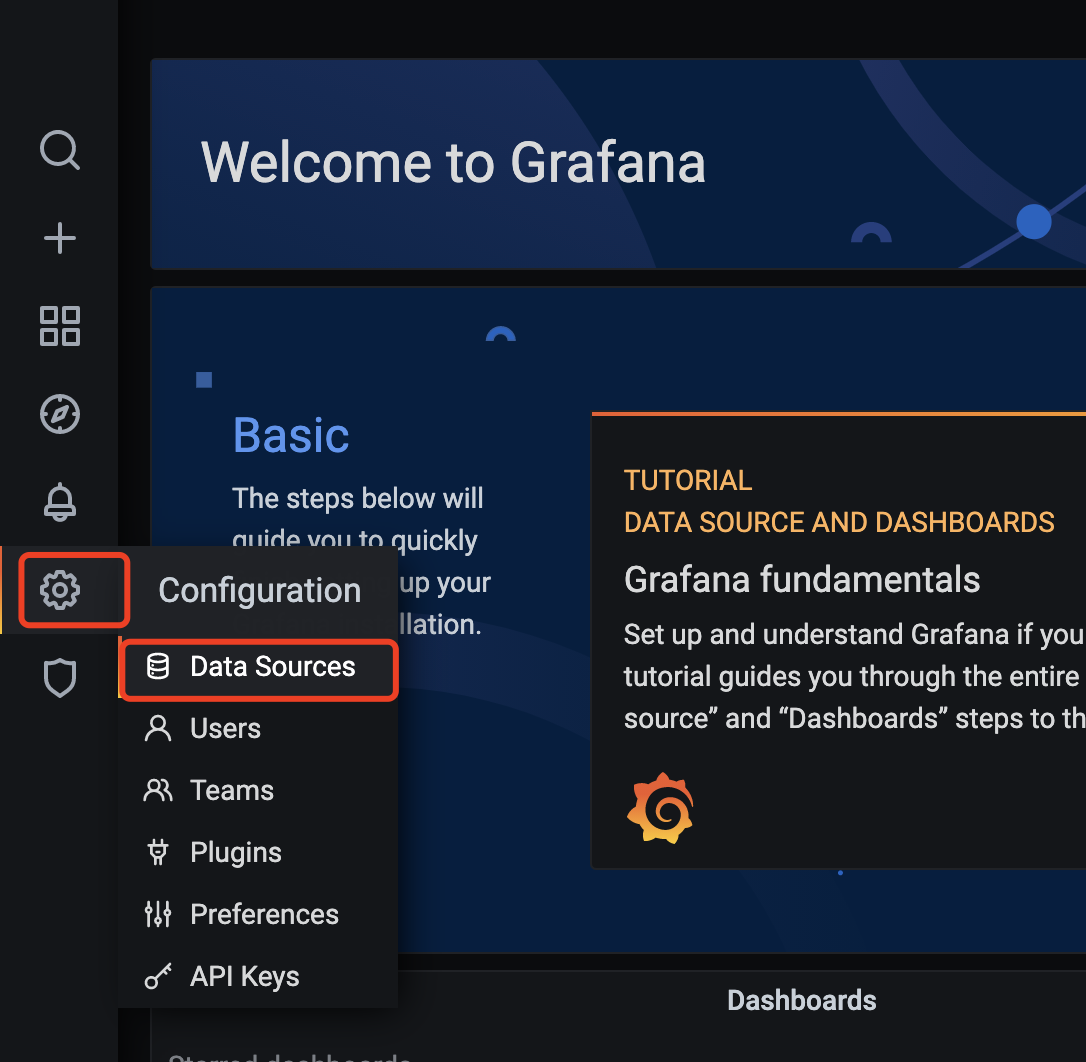
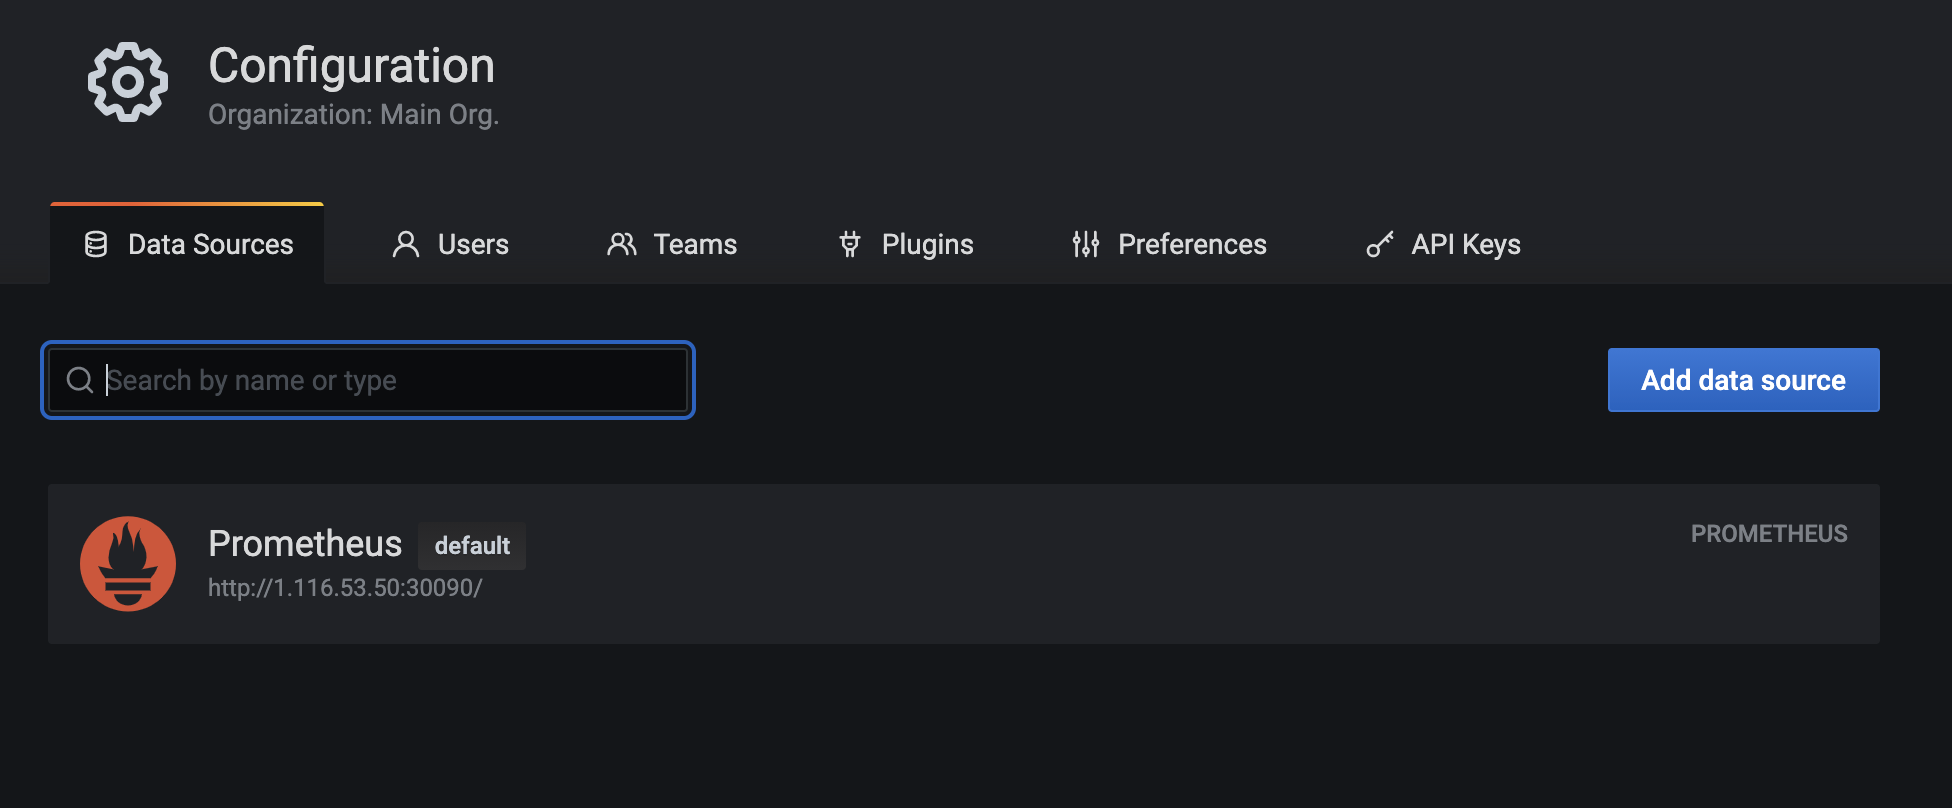
grafana我们要添加数据源
![image]()
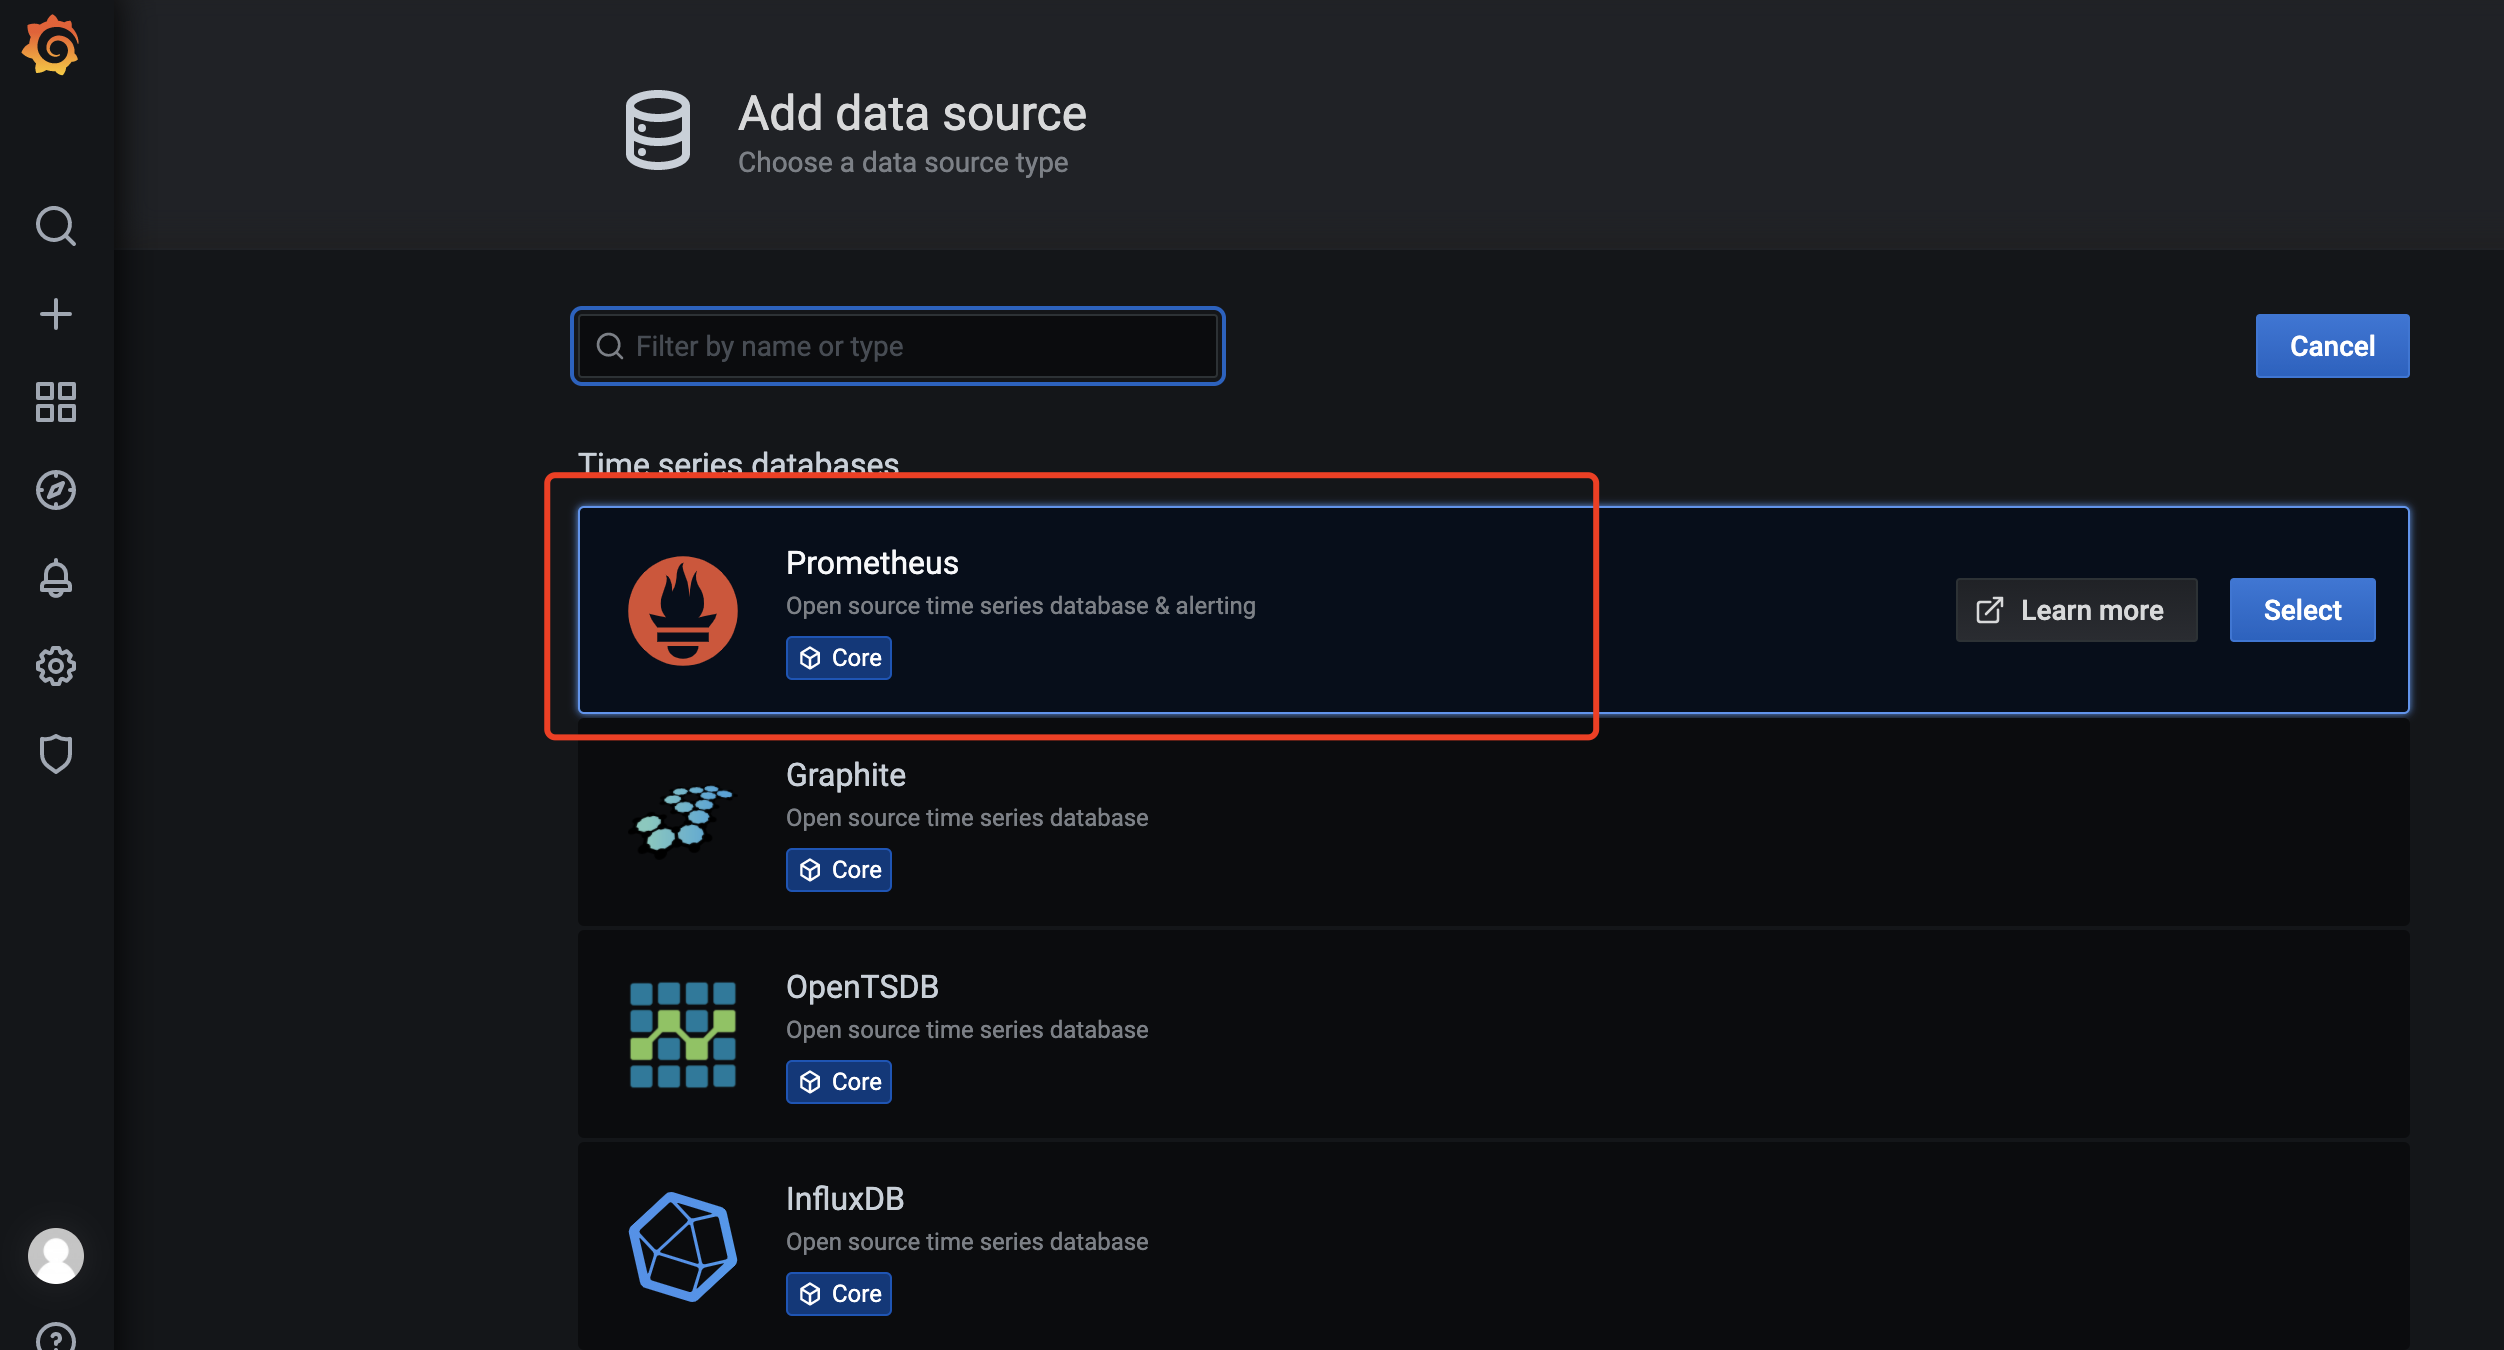
![image]()
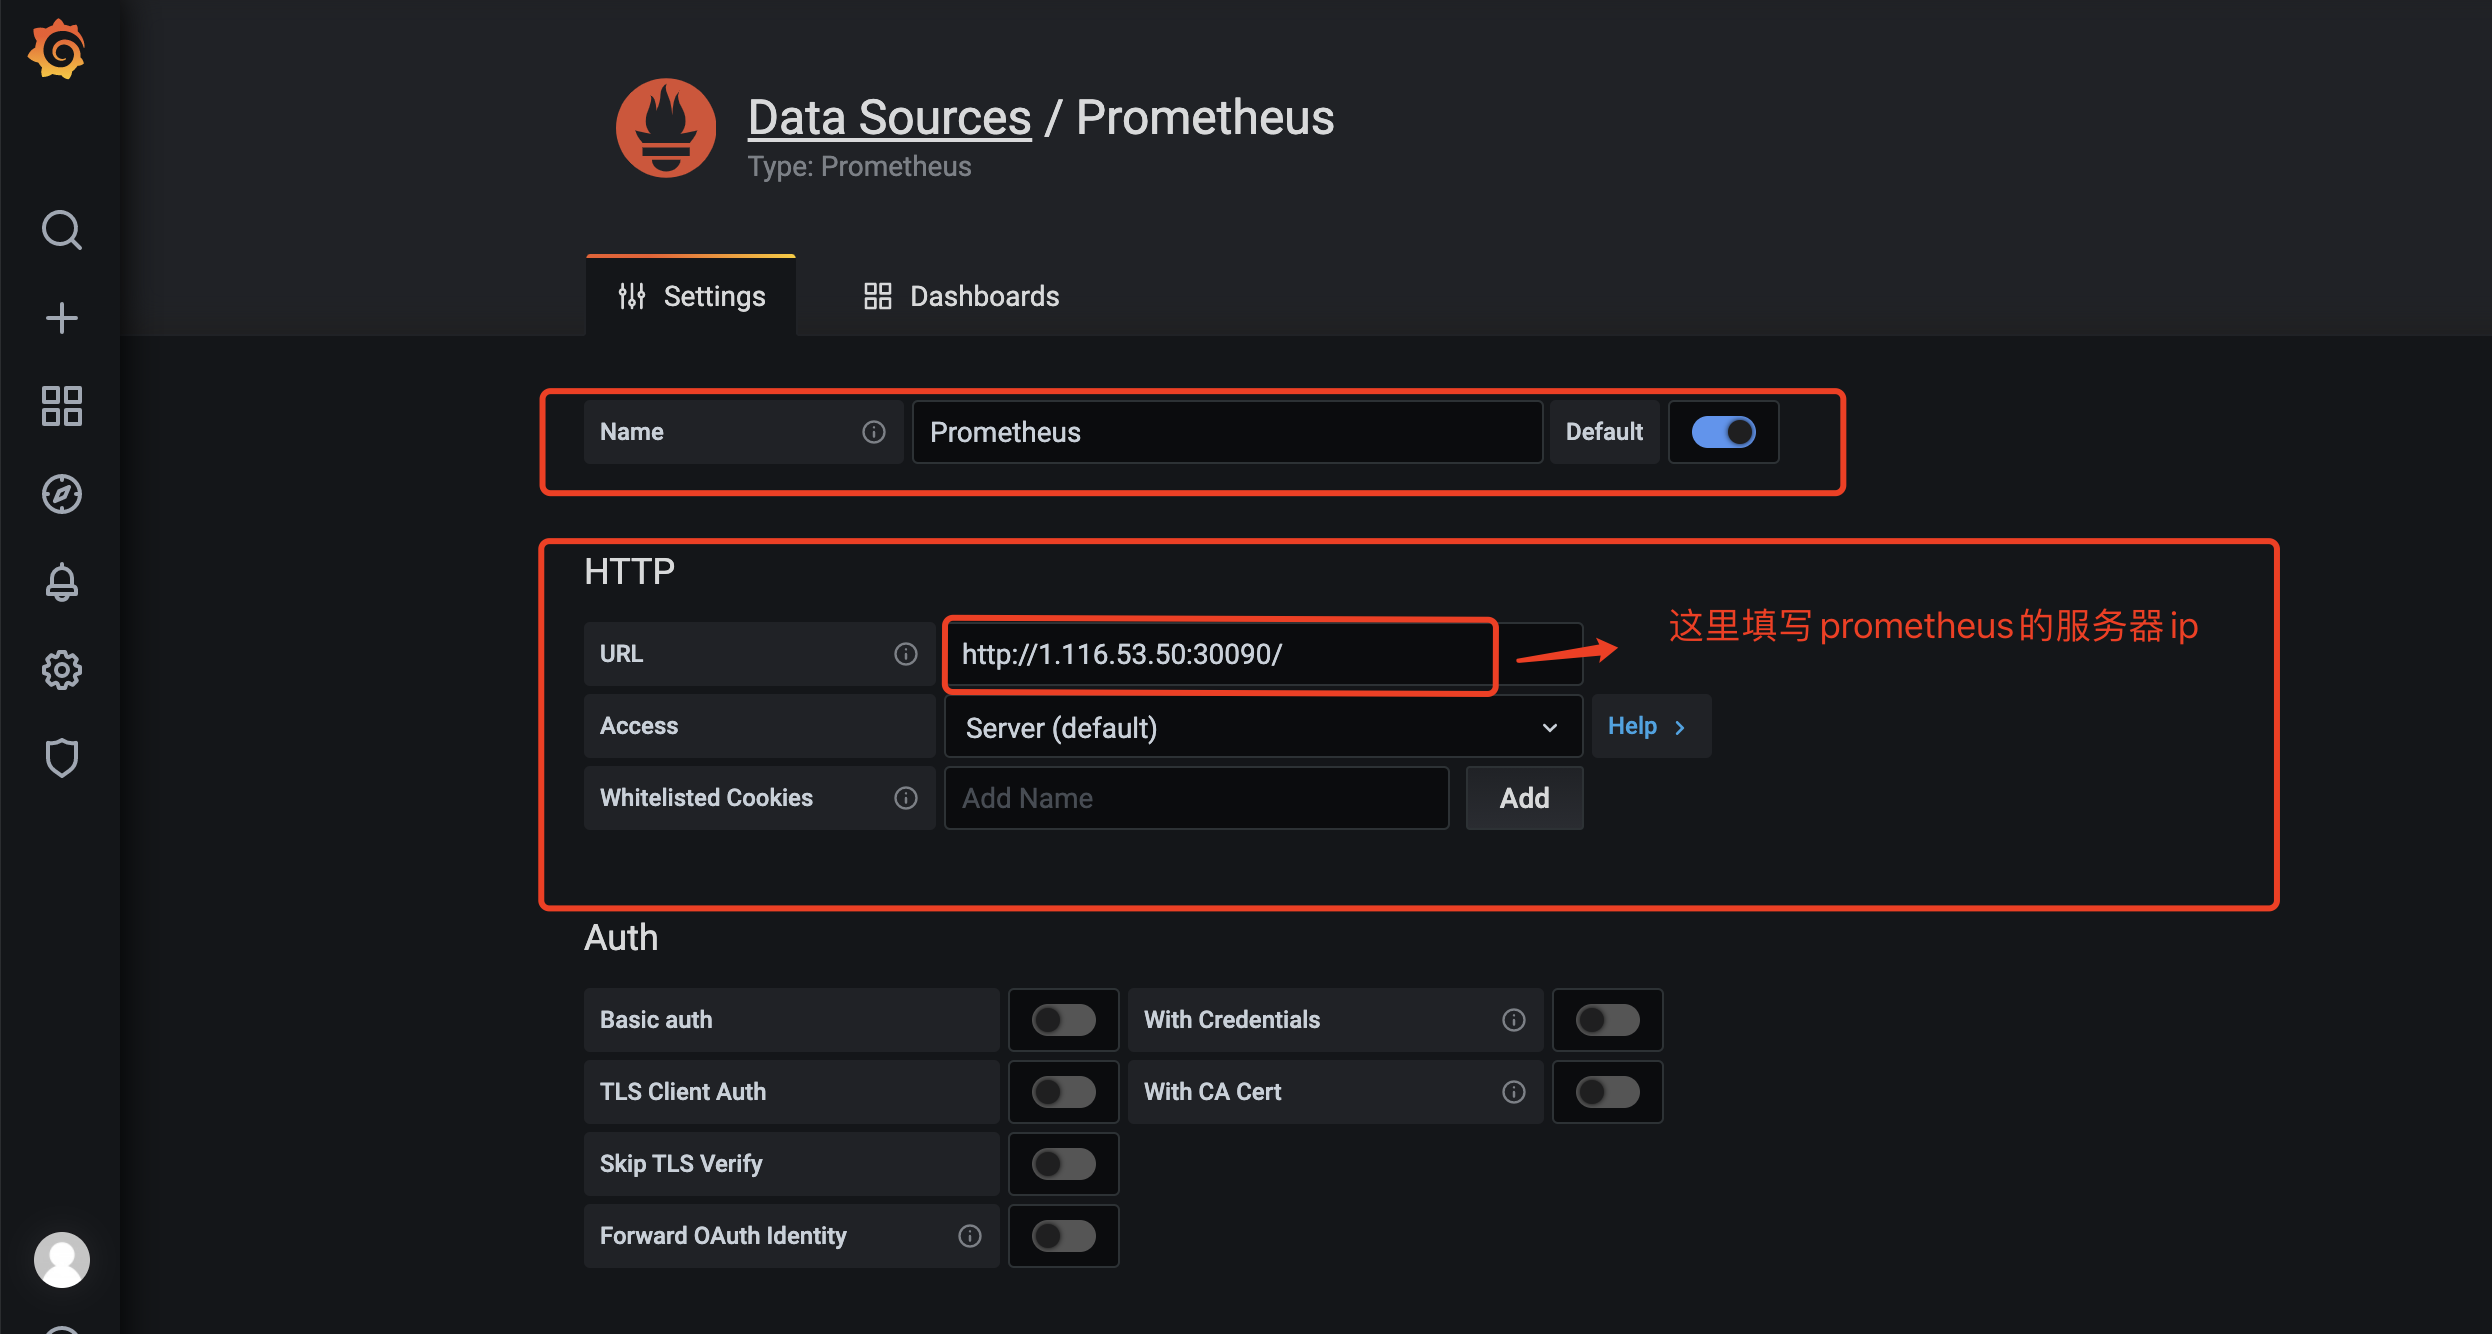
![image]()
![image]()
验证数据源添加是否正确
![image]()
发现已经有了
-
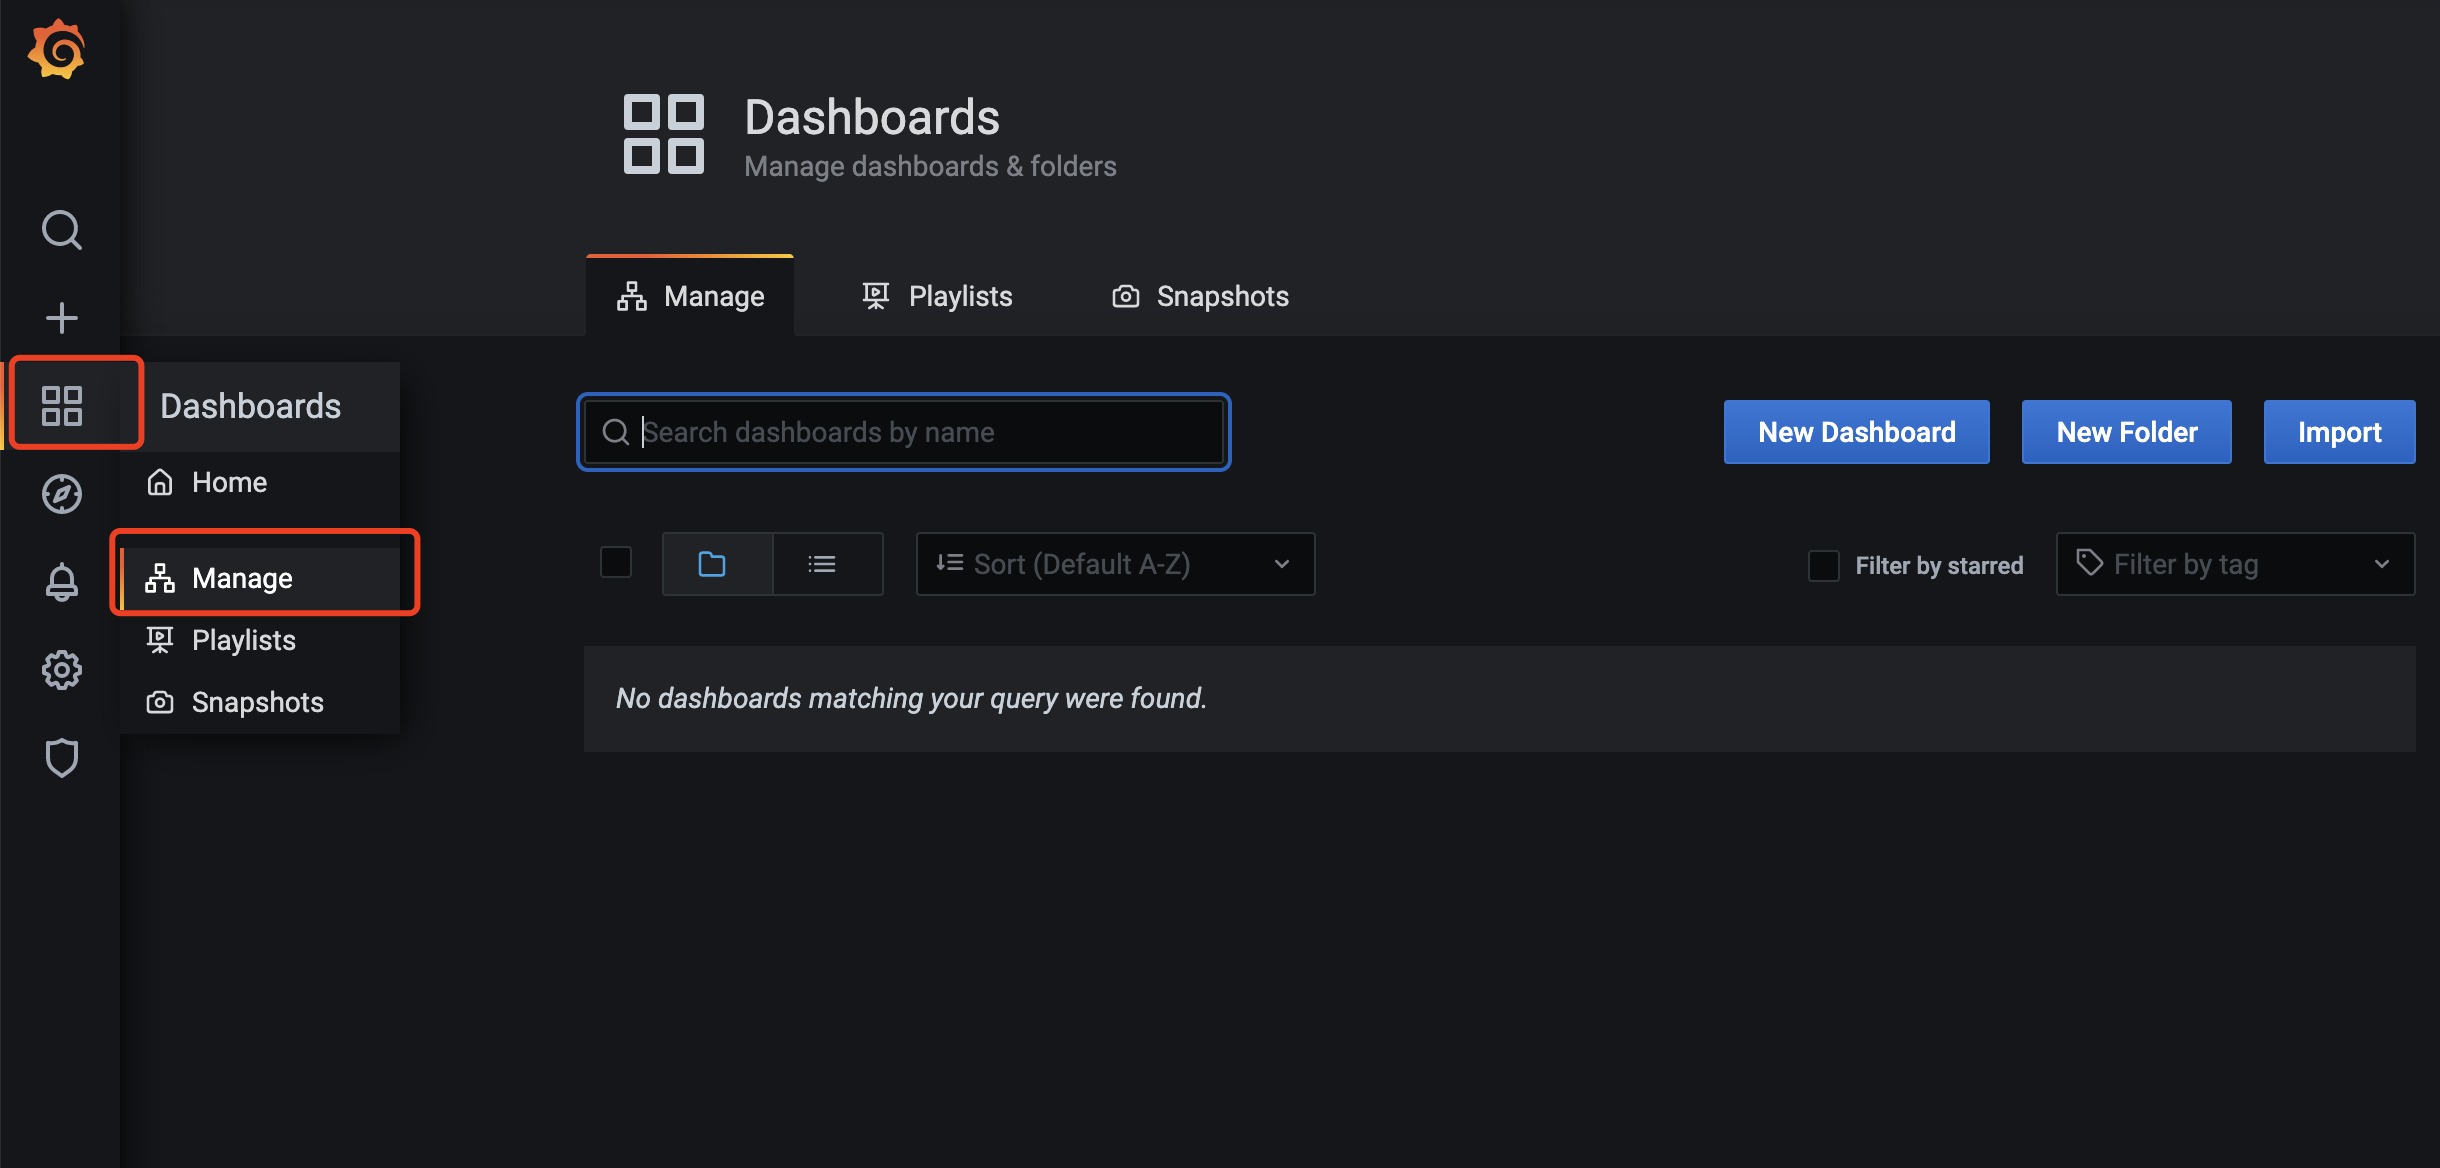
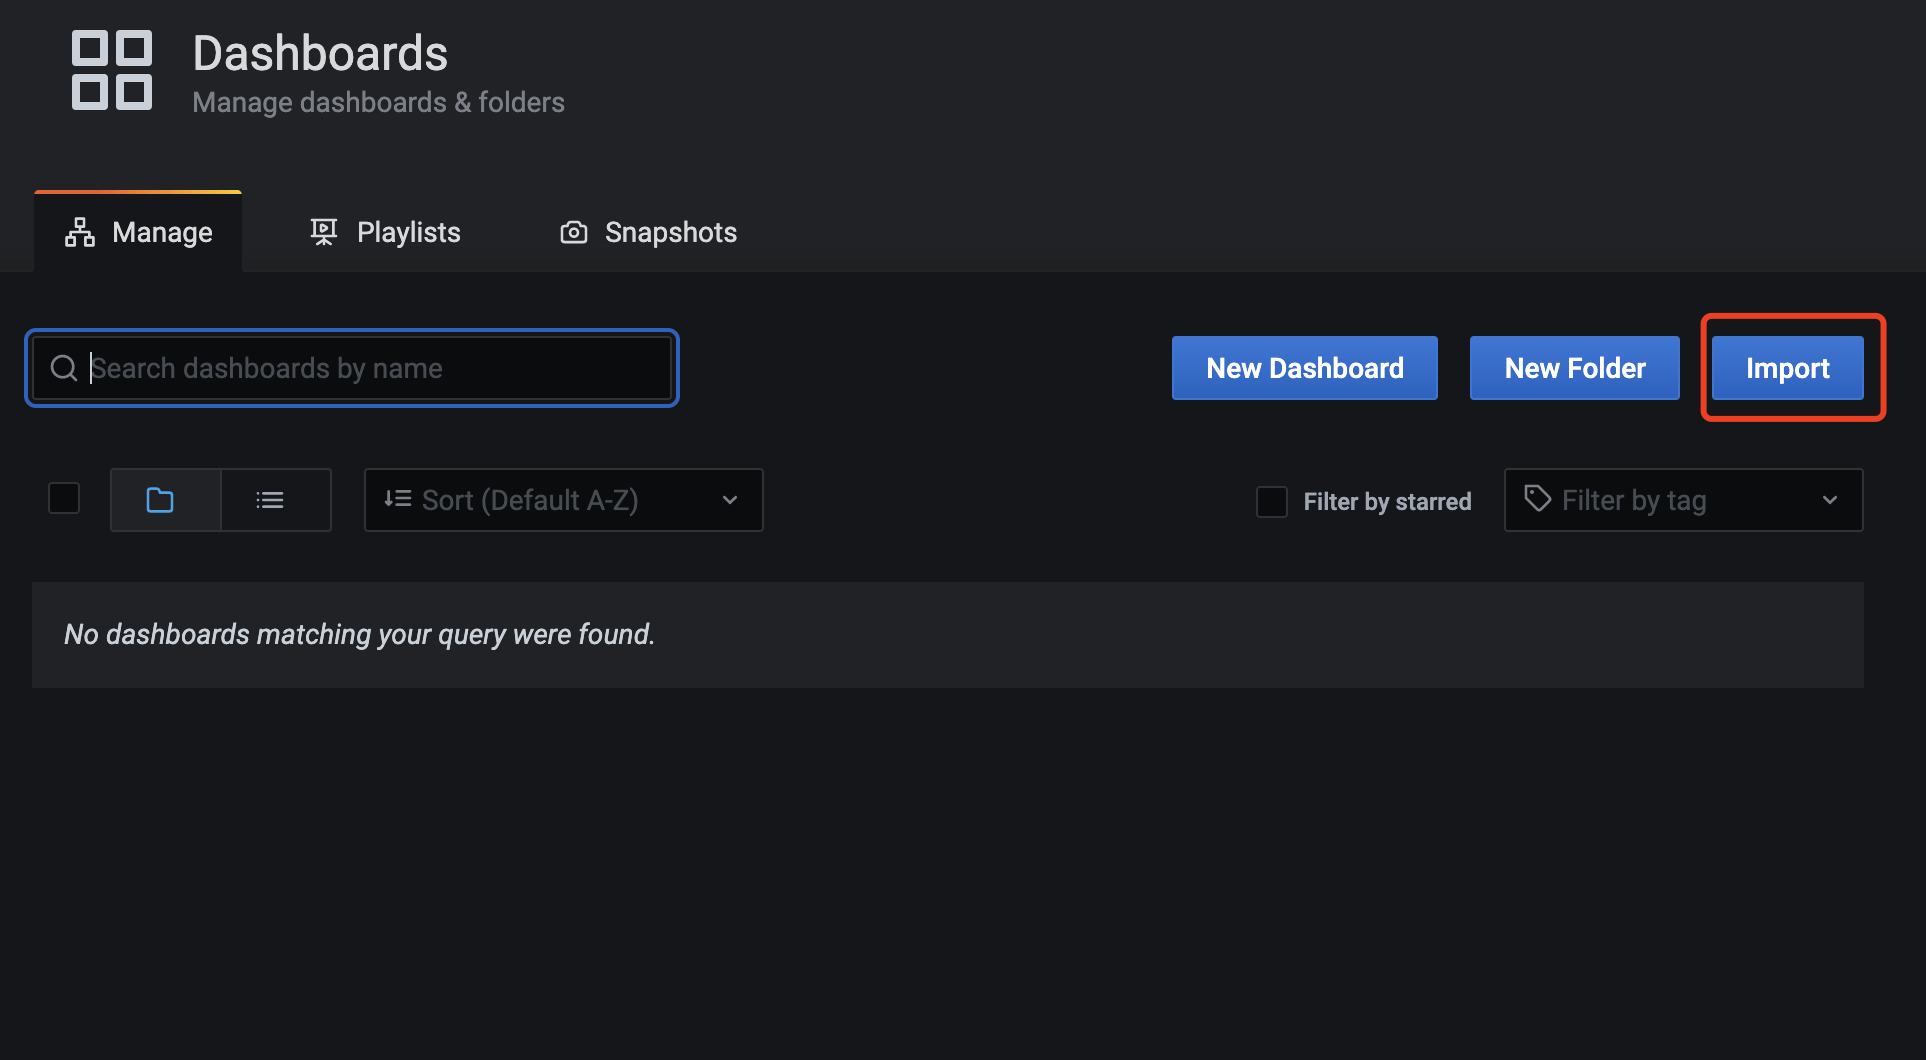
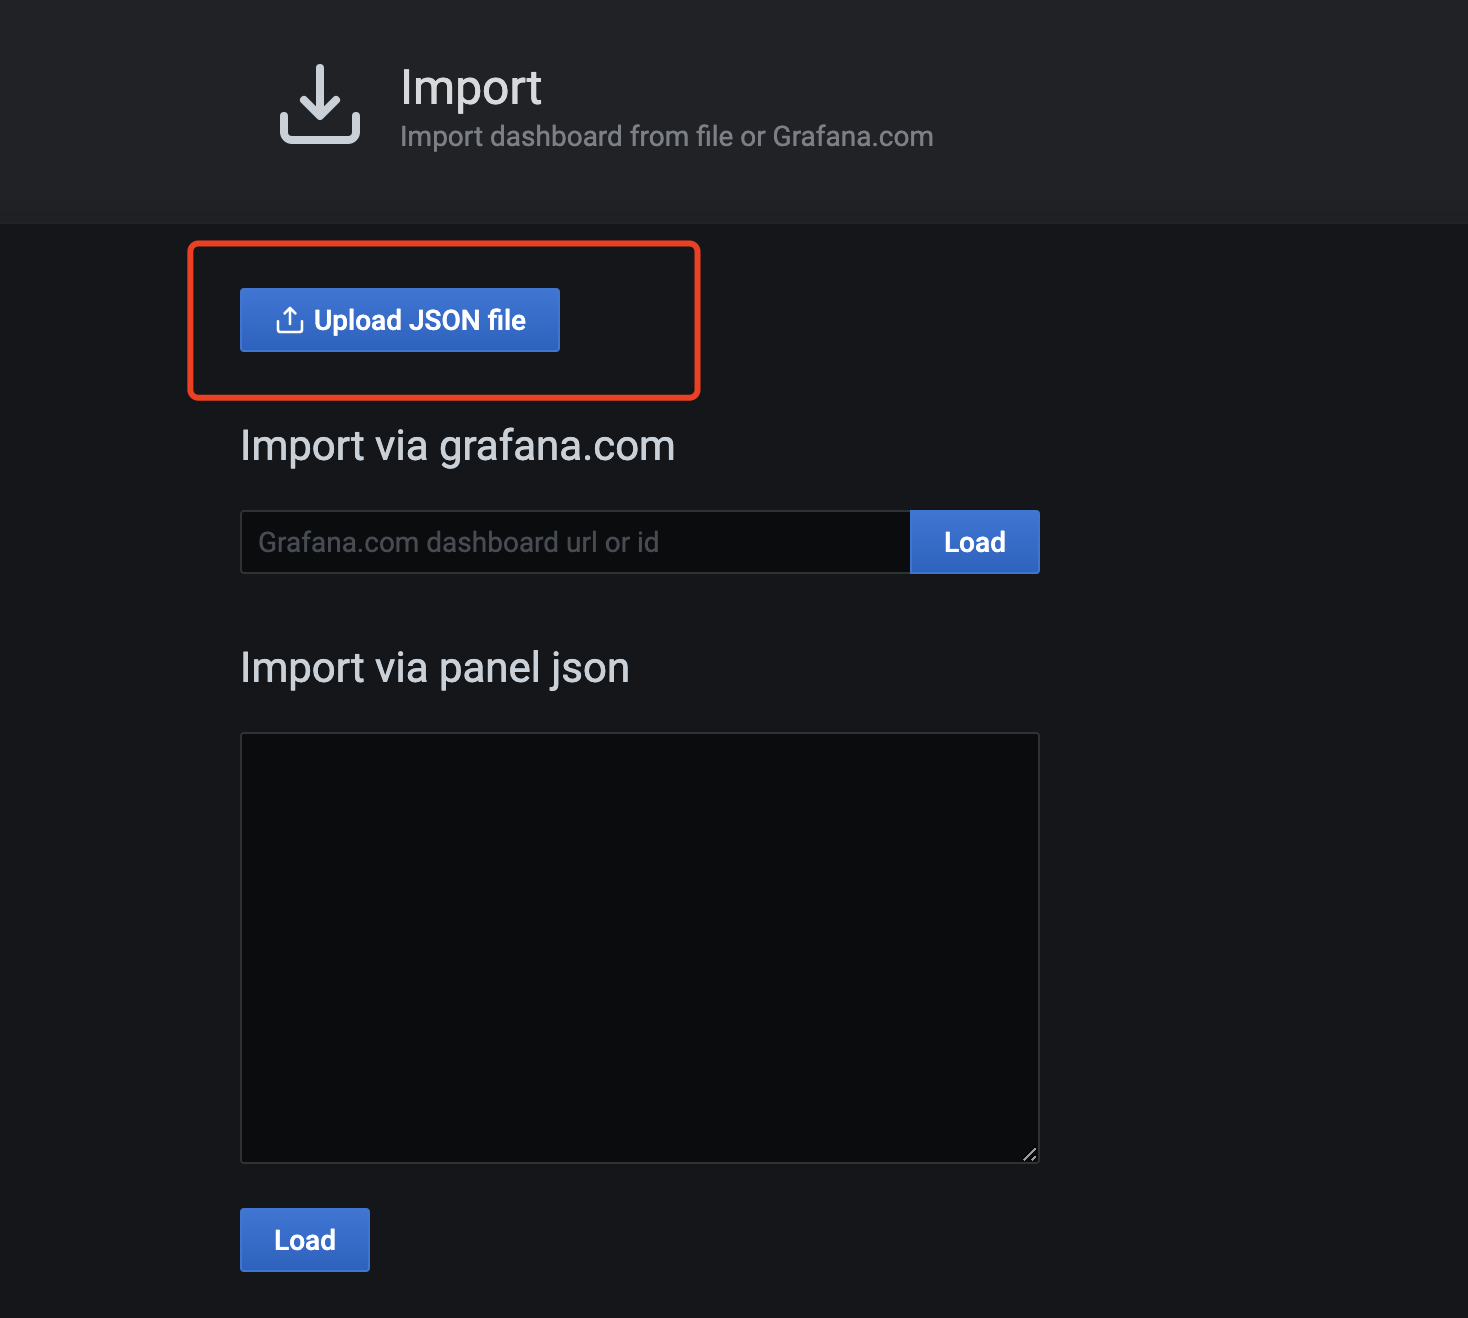
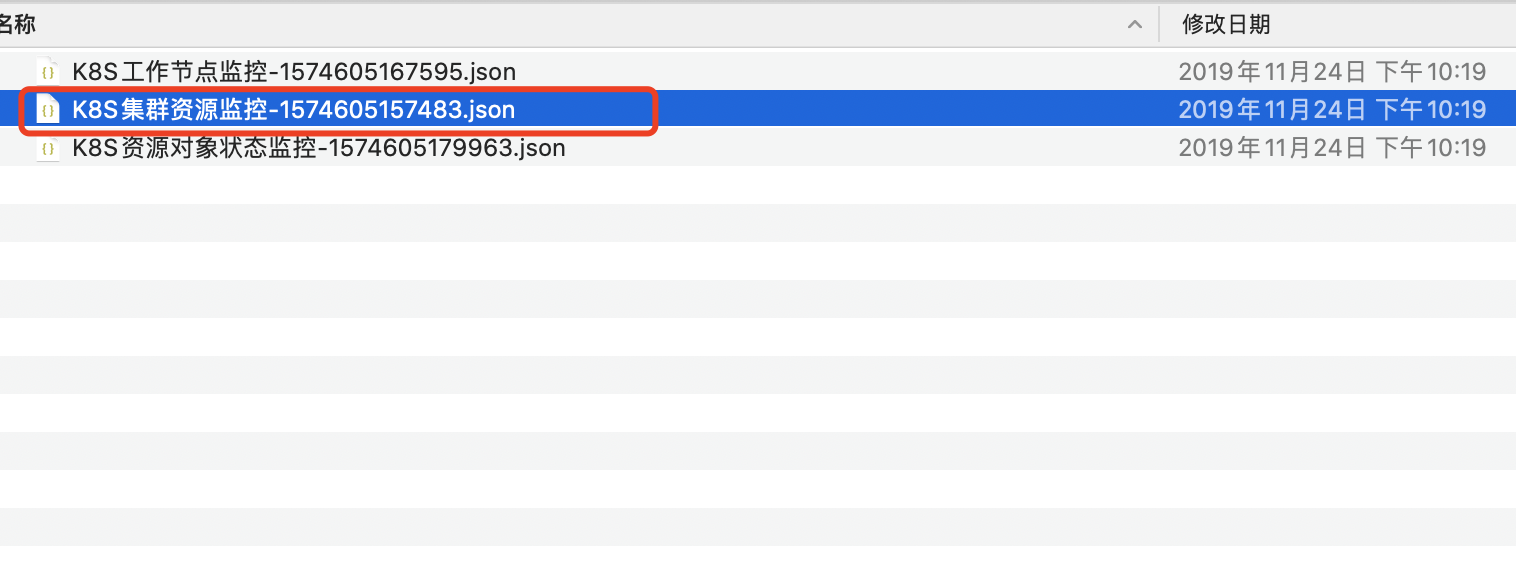
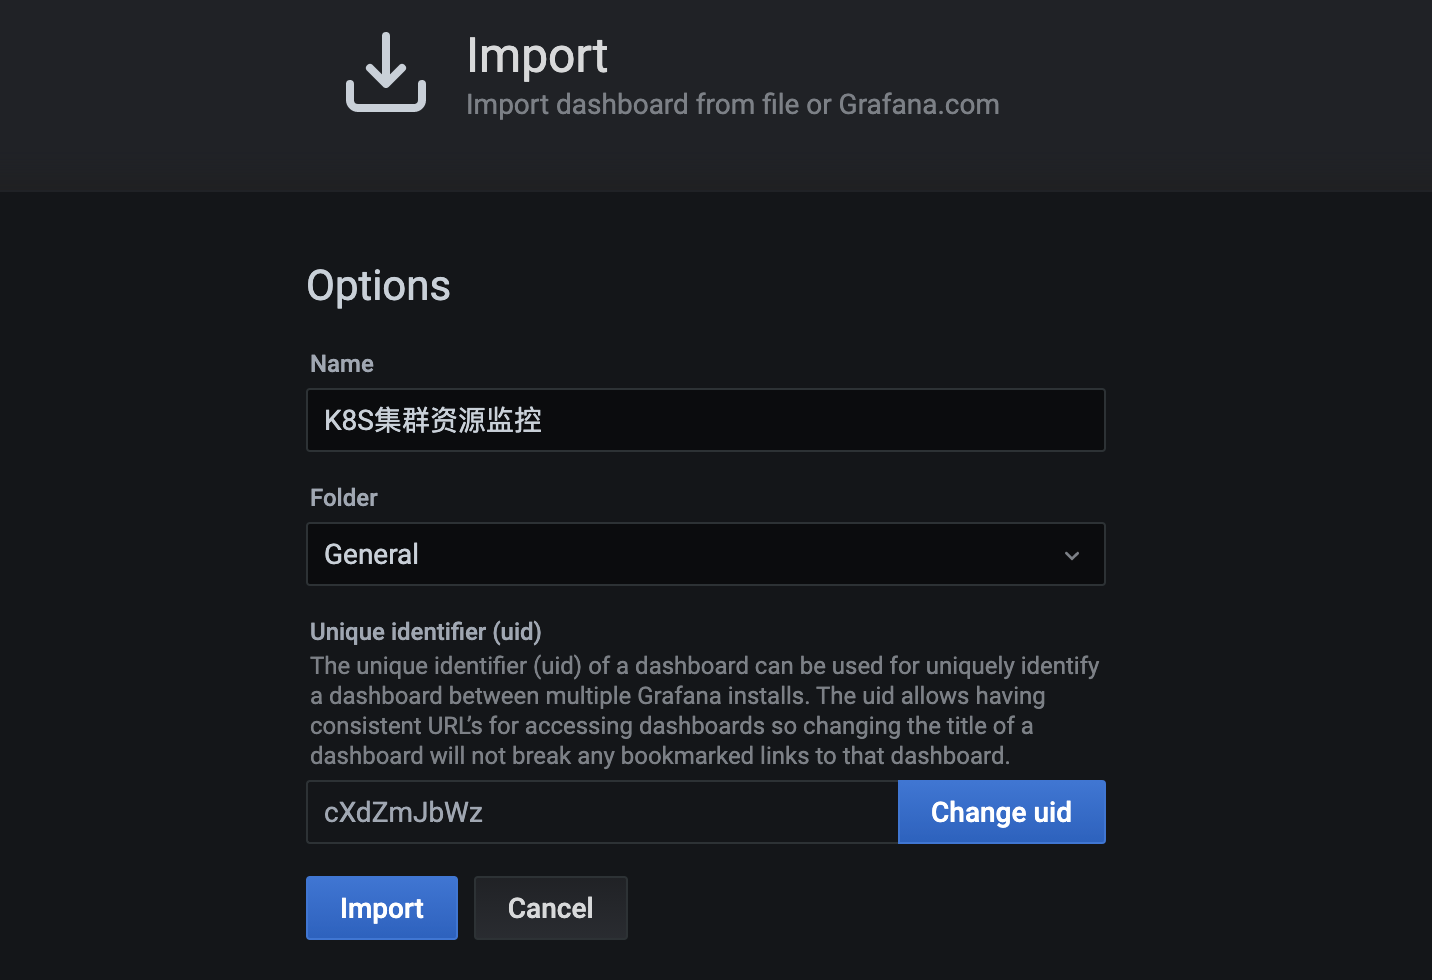
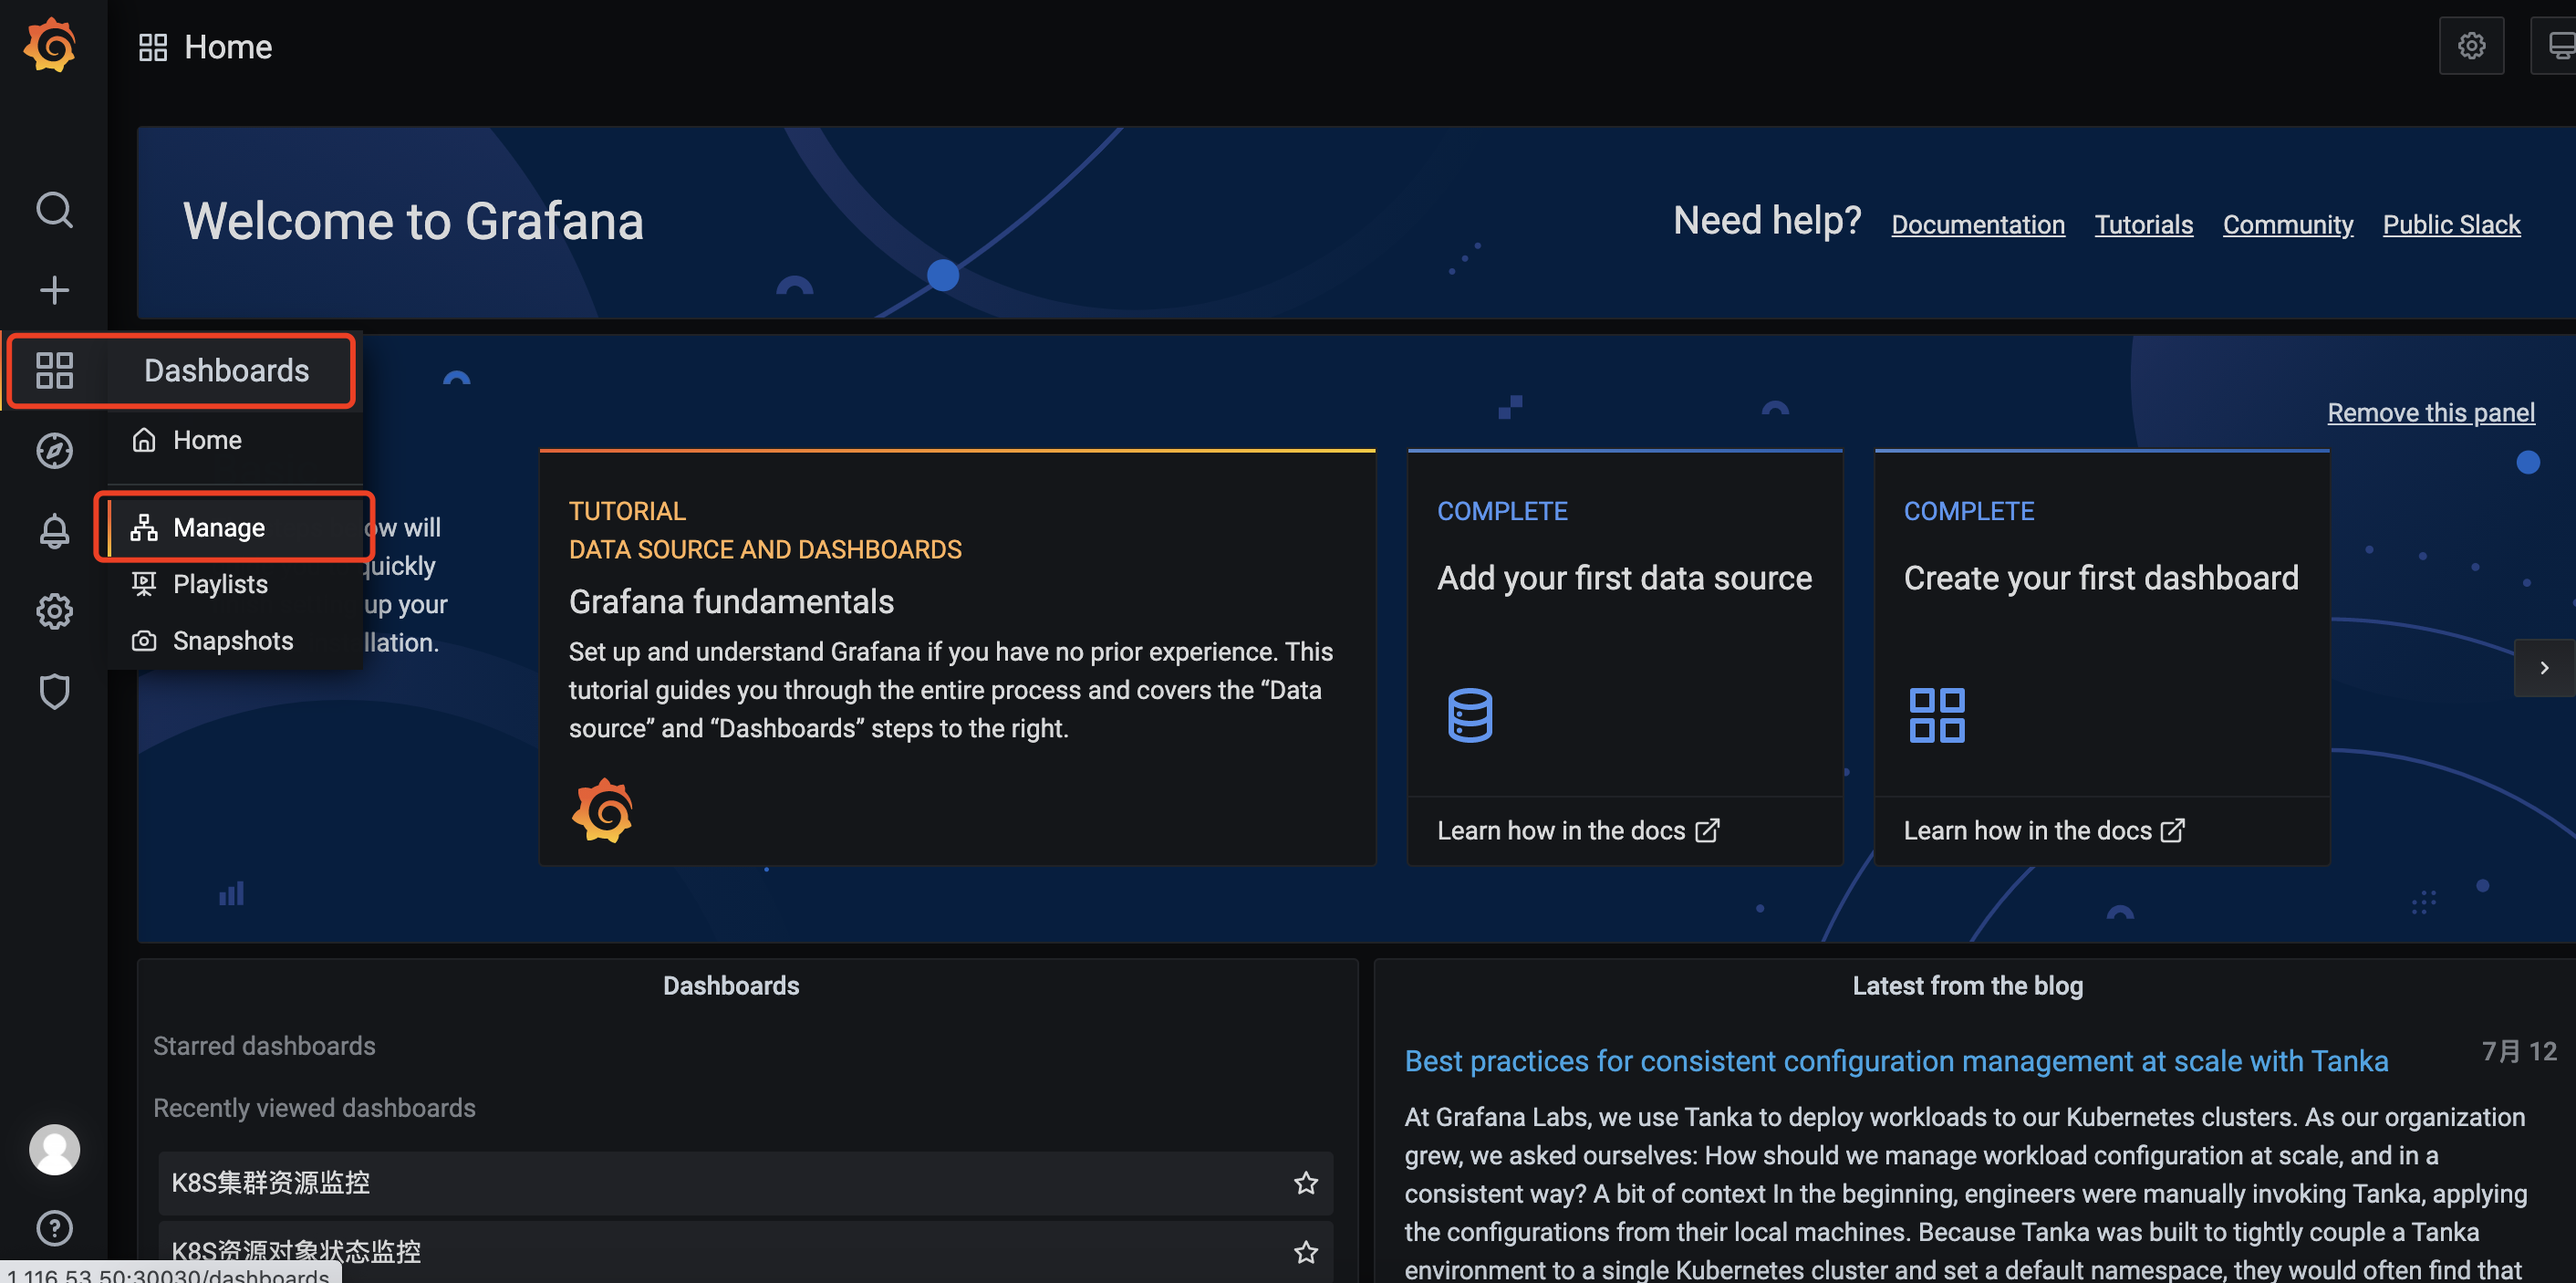
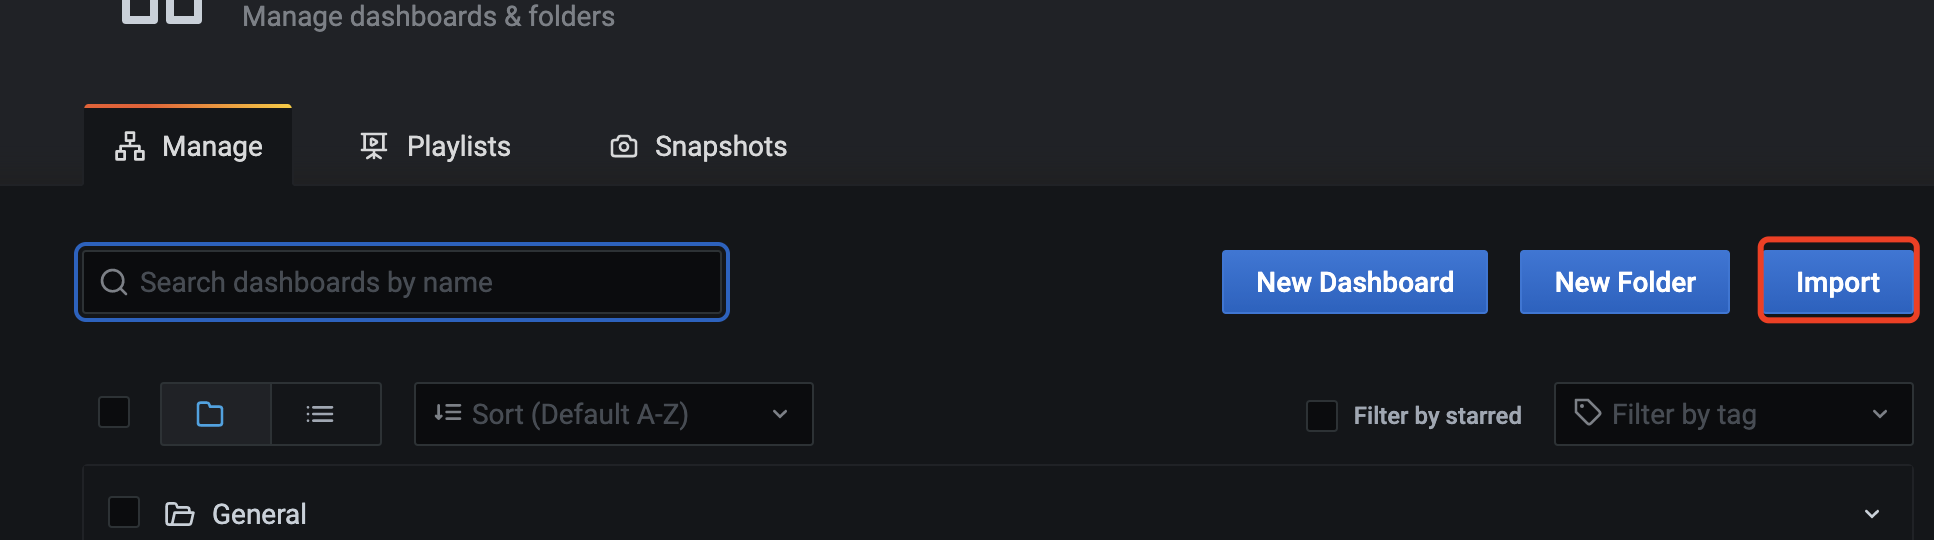
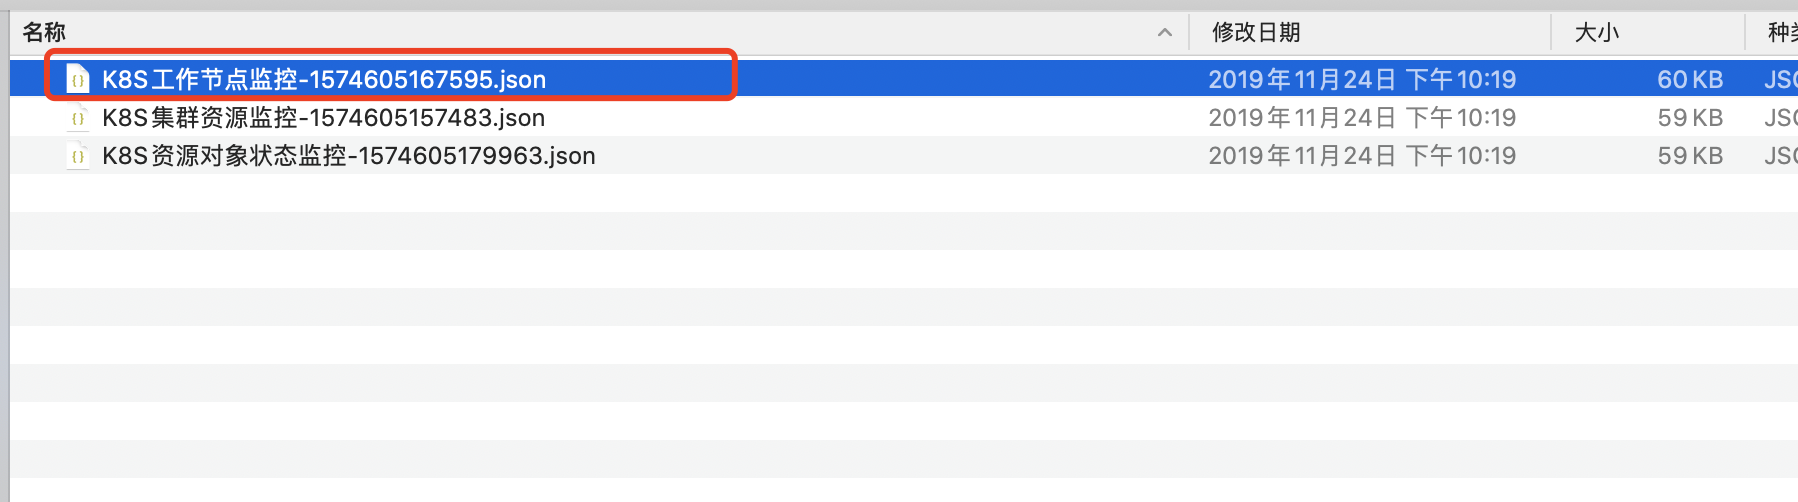
导入图表
![image]()
![image]()
![image]()
![image]()
![image]()
![image]()
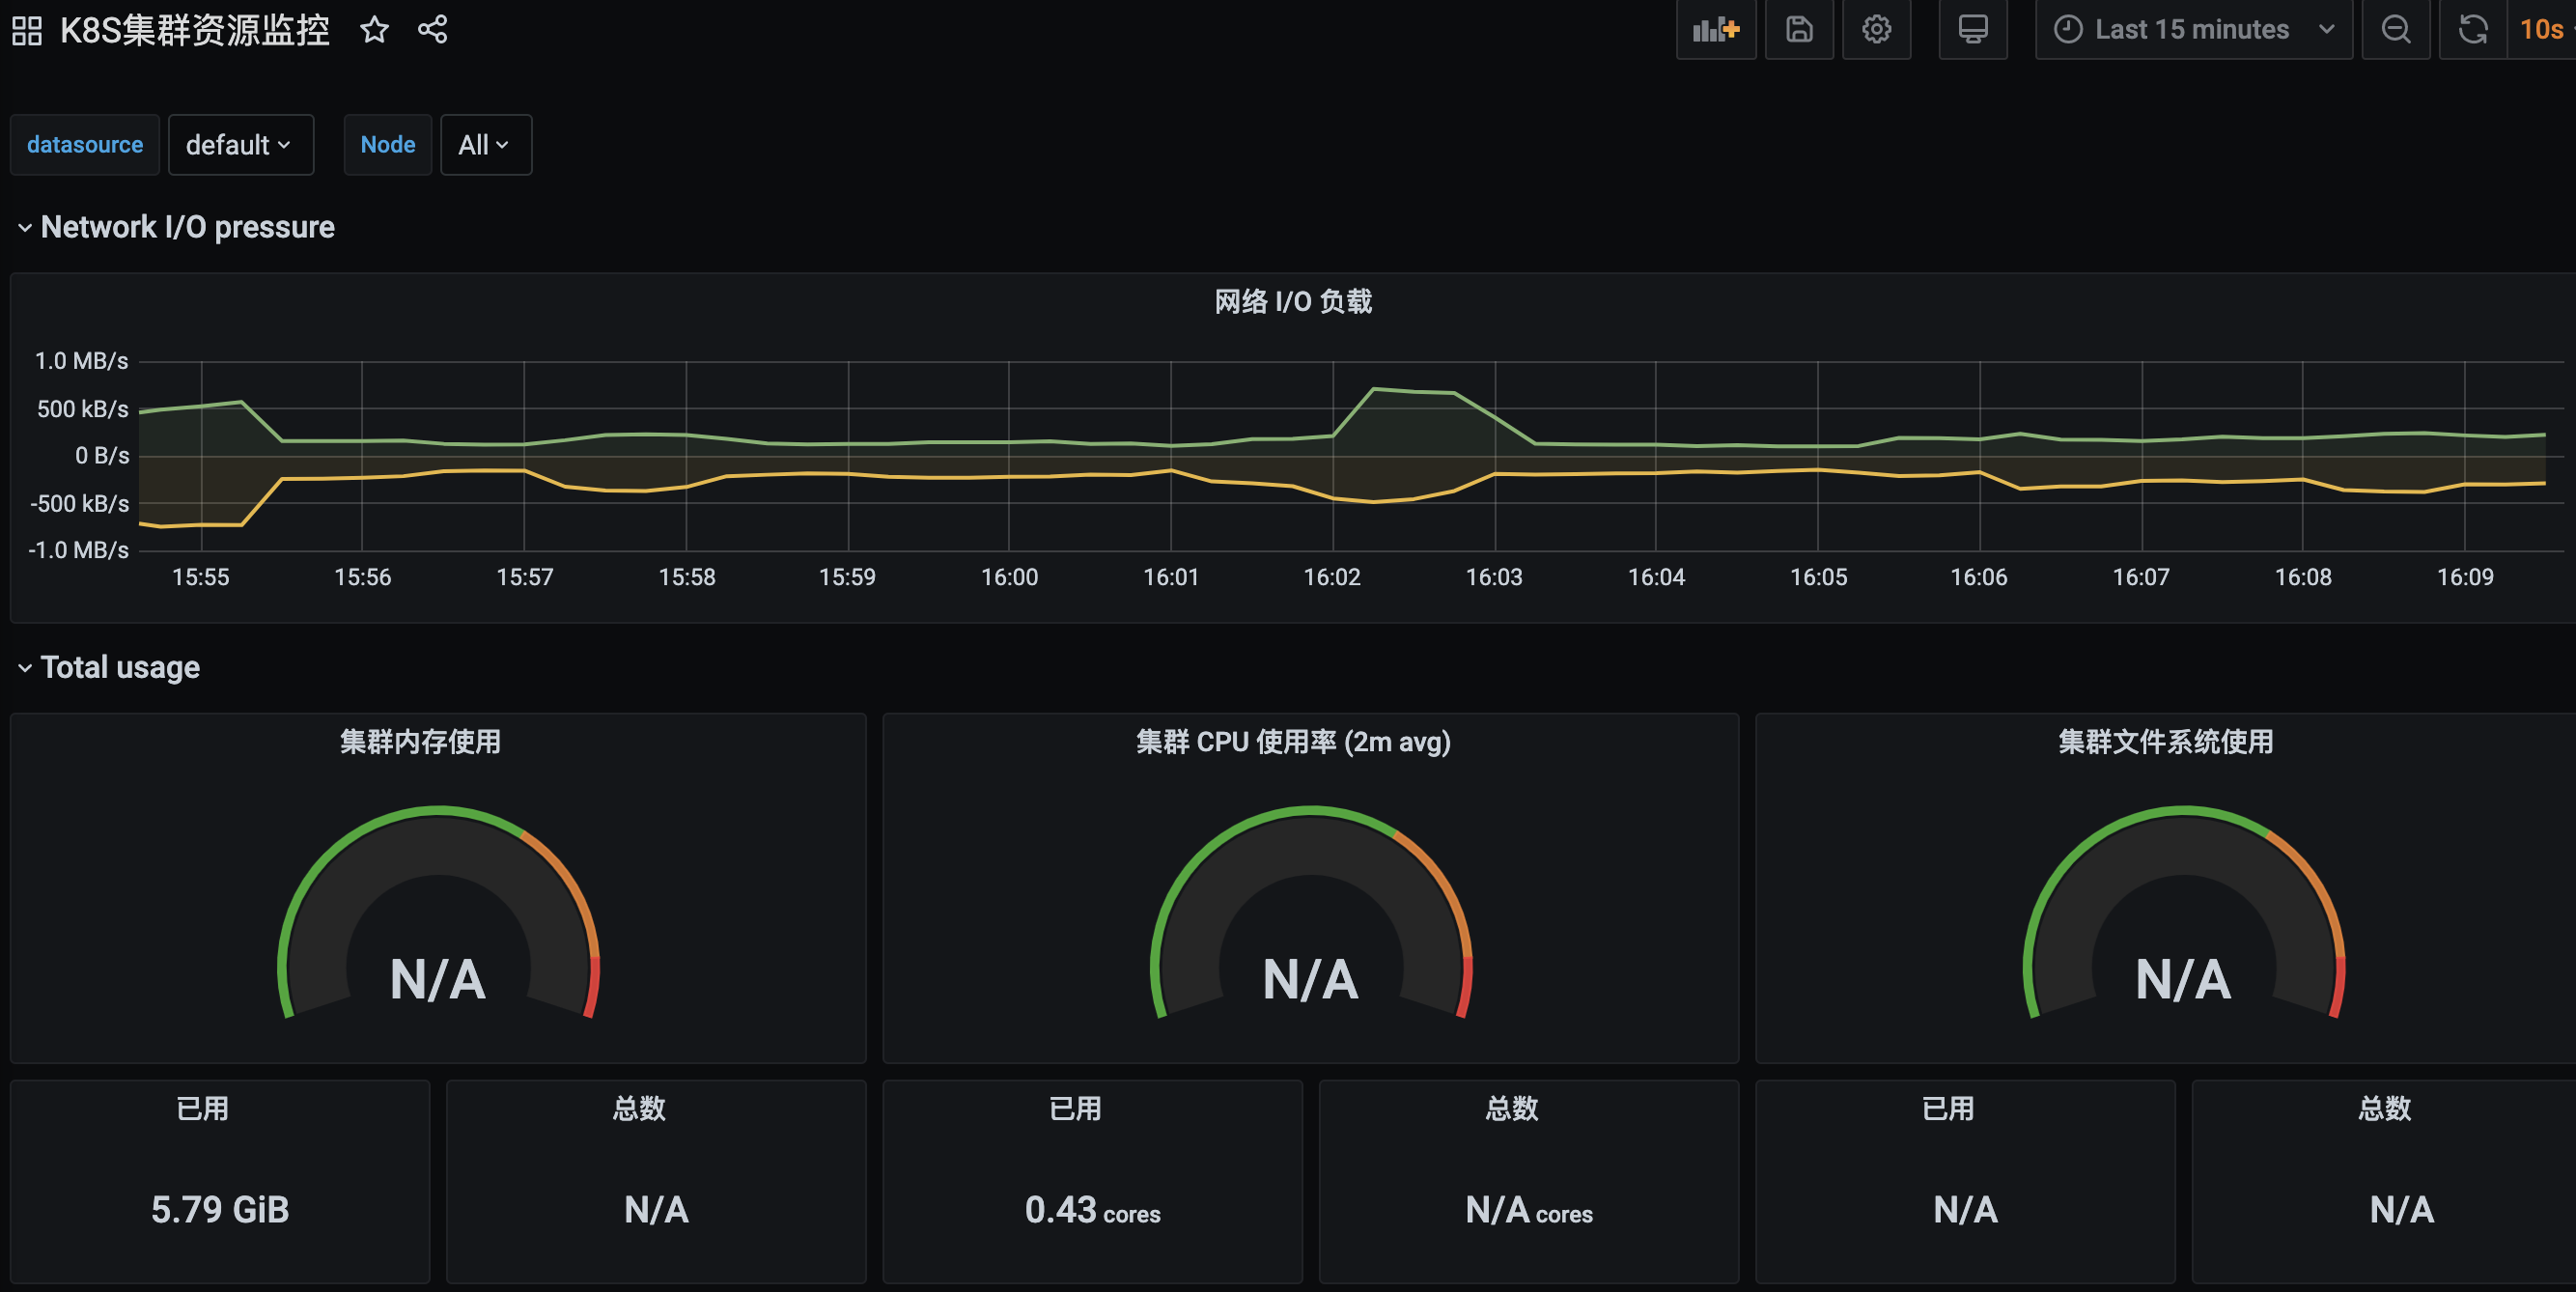
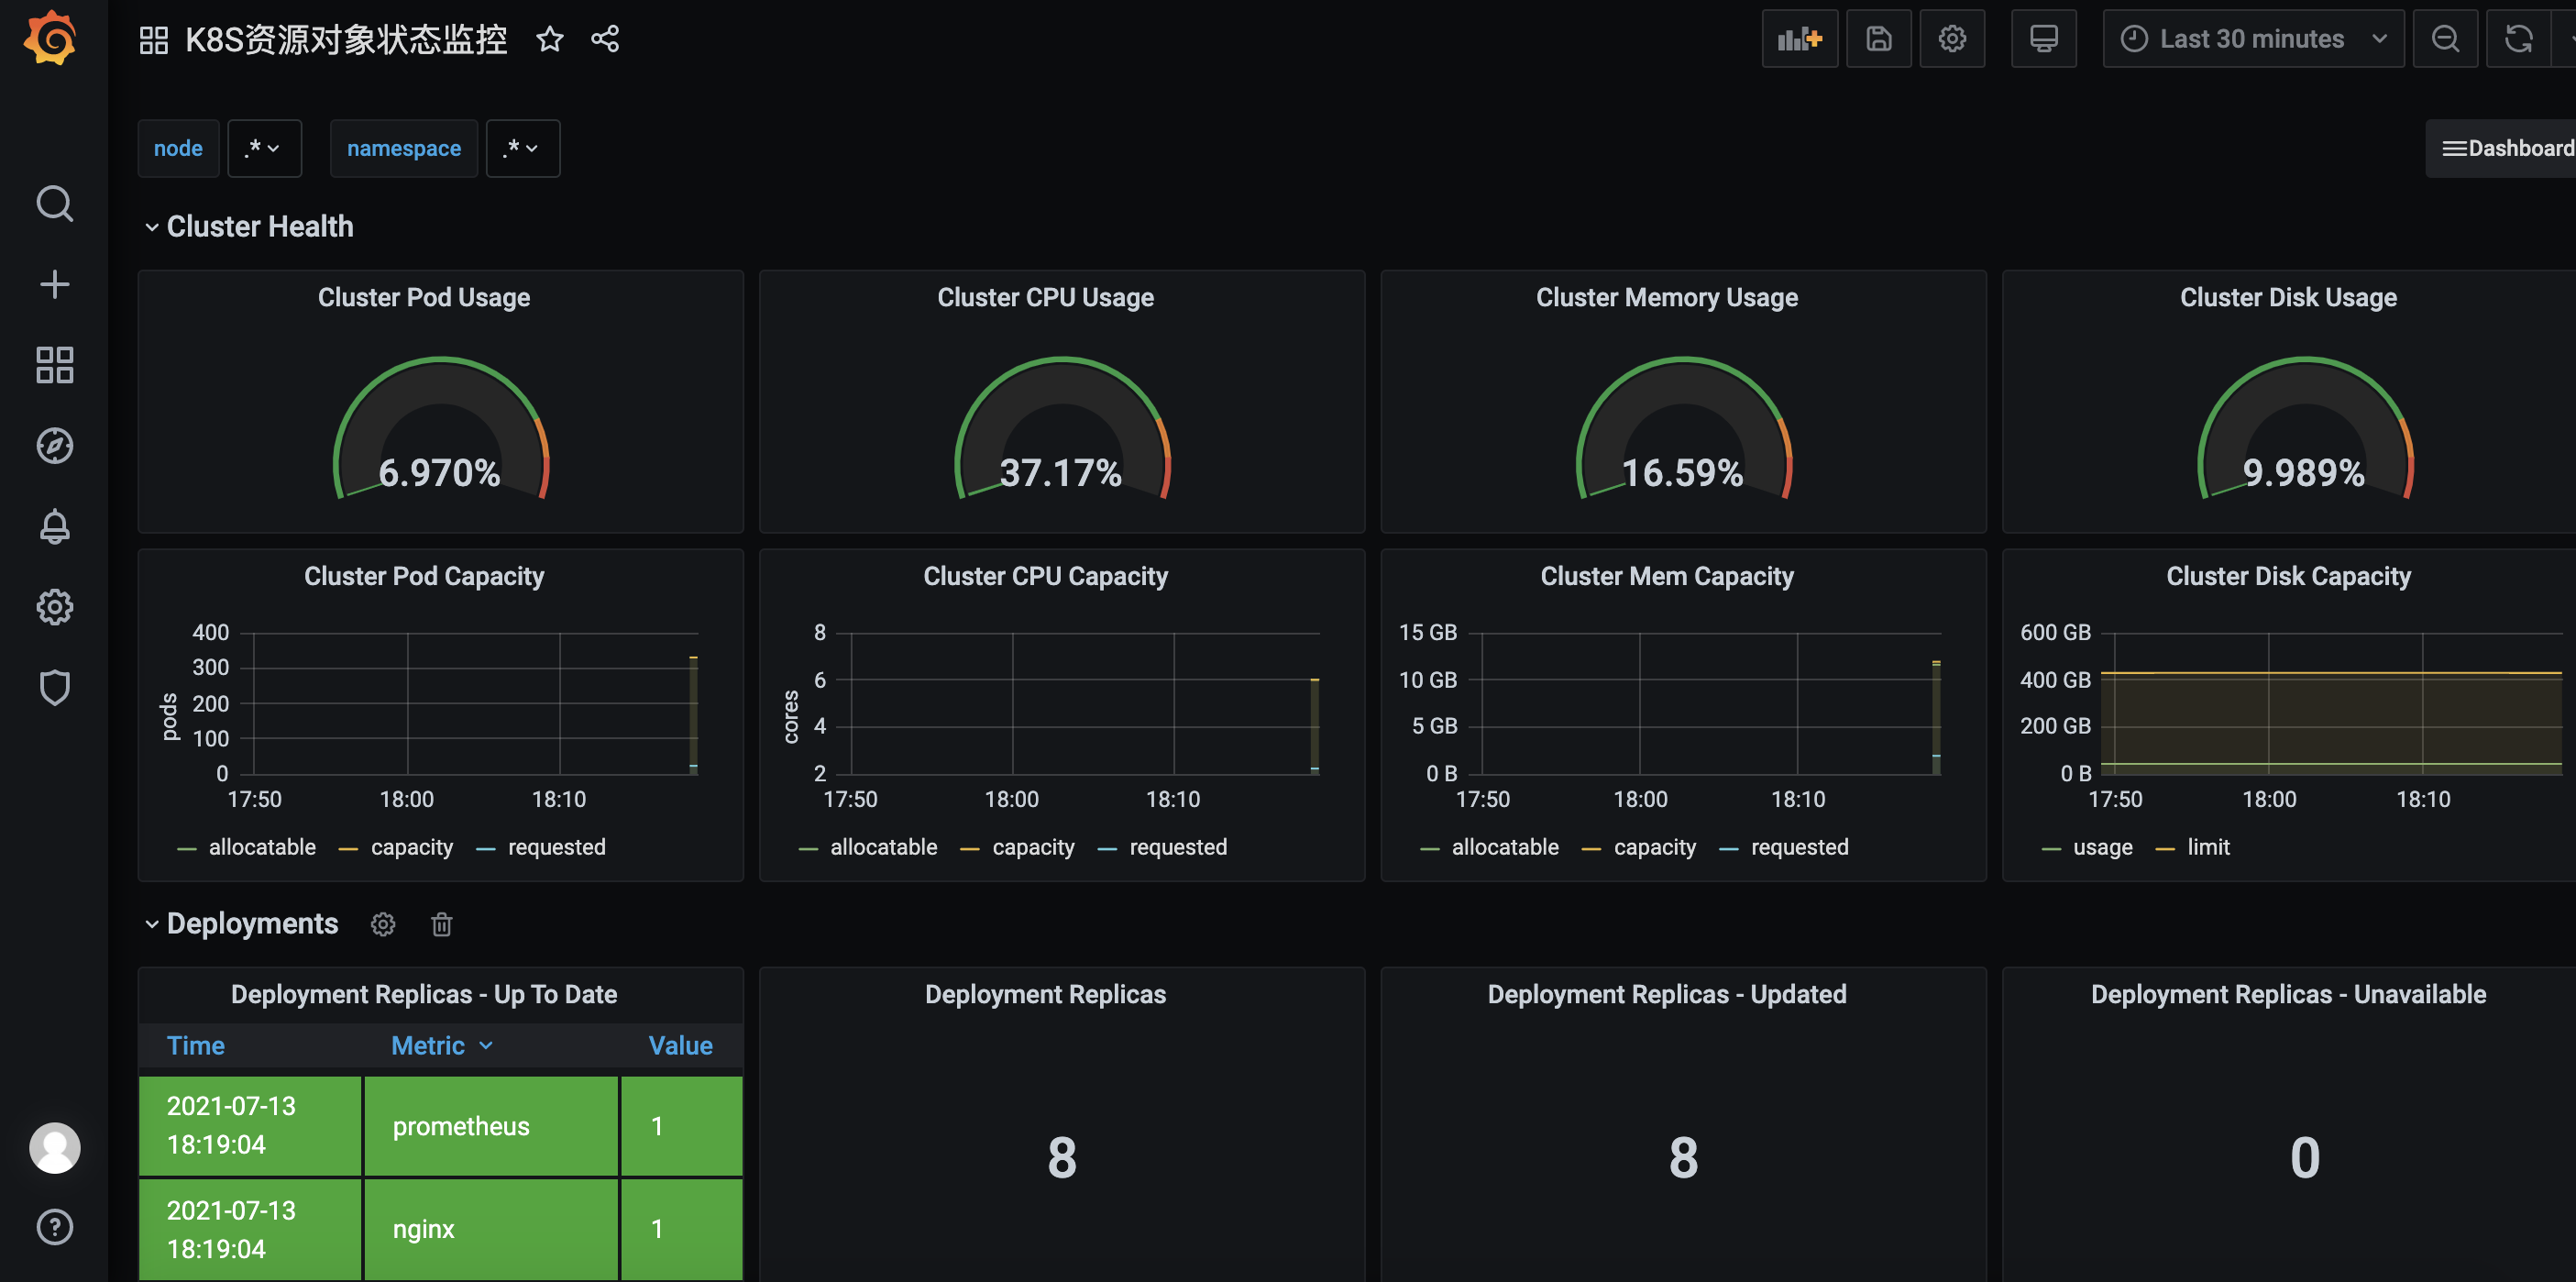
发现已经有数据了
-
部署node节点监控
[root@k8s-master prometheus]# kubectl apply -f node-exporter.yml
daemonset.apps/node-exporter created
service/node-exporter created
[root@k8s-master prometheus]# kubectl get pods,svc -n ops NAME READY STATUS RESTARTS AGE pod/grafana-757fcd5f7c-twbmj 1/1 Running 0 62m pod/node-exporter-27zdq 1/1 Running 0 2m6s pod/node-exporter-ftrhc 1/1 Running 0 2m6s pod/prometheus-859dbbc5f7-rlsqp 2/2 Running 0 23h NAME TYPE CLUSTER-IP EXTERNAL-IP PORT(S) AGE service/grafana NodePort 10.108.238.42 <none> 80:30030/TCP 62m service/node-exporter ClusterIP None <none> 9100/TCP 2m6s service/prometheus NodePort 10.108.53.165 <none> 9090:30090/TCP 23h


-
k8s资源对象监控
[root@k8s-master prometheus]# kubectl apply -f kube-state-metrics.yaml
deployment.apps/kube-state-metrics created
configmap/kube-state-metrics-config created
service/kube-state-metrics created
serviceaccount/kube-state-metrics created
clusterrole.rbac.authorization.k8s.io/kube-state-metrics created
role.rbac.authorization.k8s.io/kube-state-metrics-resizer created
clusterrolebinding.rbac.authorization.k8s.io/kube-state-metrics created
rolebinding.rbac.authorization.k8s.io/kube-state-metrics created
[root@k8s-master prometheus]# kubectl get pods -n ops NAME READY STATUS RESTARTS AGE grafana-757fcd5f7c-twbmj 1/1 Running 0 3h8m kube-state-metrics-667bc48f47-cwg8p 2/2 Running 0 116s node-exporter-27zdq 1/1 Running 0 128m node-exporter-ftrhc 1/1 Running 0 128m prometheus-859dbbc5f7-rlsqp 2/2 Running 0 25h

 浙公网安备 33010602011771号