


使用Prometheus和Grafana做服务指标监控可视化
Grafana安装
首先,确保系统版本是最新的
dnf update
添加官方的Grafana存储库
sudo nano /etc/yum.repos.d/grafana.repo
[grafana]
name=grafana
baseurl=https://packages.grafana.com/oss/rpm
repo_gpgcheck=1
enabled=1
gpgcheck=1
gpgkey=https://packages.grafana.com/gpg.key
sslverify=1
sslcacert=/etc/pki/tls/certs/ca-bundle.crt
安装最新版本的Grafana
sudo dnf update
sudo dnf install grafana
启动Grafana服务
sudo systemctl start grafana-server
sudo systemctl status grafana-server
查看
http://175.24.228.127:3000/

Prometheus安装
下载linux版的安装包
https://prometheus.io/download/
解压
tar xvfz prometheus-2.32.1.linux-amd64.tar.gz
启动Prometheus
./prometheus --config.file=prometheus.yml
Prometheus的数据源配置
Add Data Source >> prometheus

使用Prometheus和Grafana做服务器监控可视化
服务器指标监控Exporter可以从我们的Linux服务器中采集到一些关键指标用于可视化。
从官网下载该Exporter
wget https://github.com/prometheus/node_exporter/releases/download/v1.1.1/node_exporter-1.1.1.linux-amd64.tar.gz

tar xvfz node_exporter-1.1.1.linux-amd64.tar.gz
启动Exporter
cd node_exporter-1.1.1.linux-amd64

./node_exporter
我们可以访问下/metrics路径,看看能否正常获取到服务器指标:
http://175.24.228.127:9100/metrics

将Exporter的端口添加进Prometheus的配置
vi prometheus.yml
scrape_configs:
  # The job name is added as a label `job=<job_name>` to any timeseries scraped from this config.
  - job_name: "prometheus"

    # metrics_path defaults to '/metrics'
    # scheme defaults to 'http'.

    static_configs:
      - targets: ["localhost:9090"]
  - job_name: "server"
    static_configs:
      - targets: ["localhost:9100"]
修改配置完成后,对Prometheus进行重启
./prometheus --config.file=prometheus.yml &
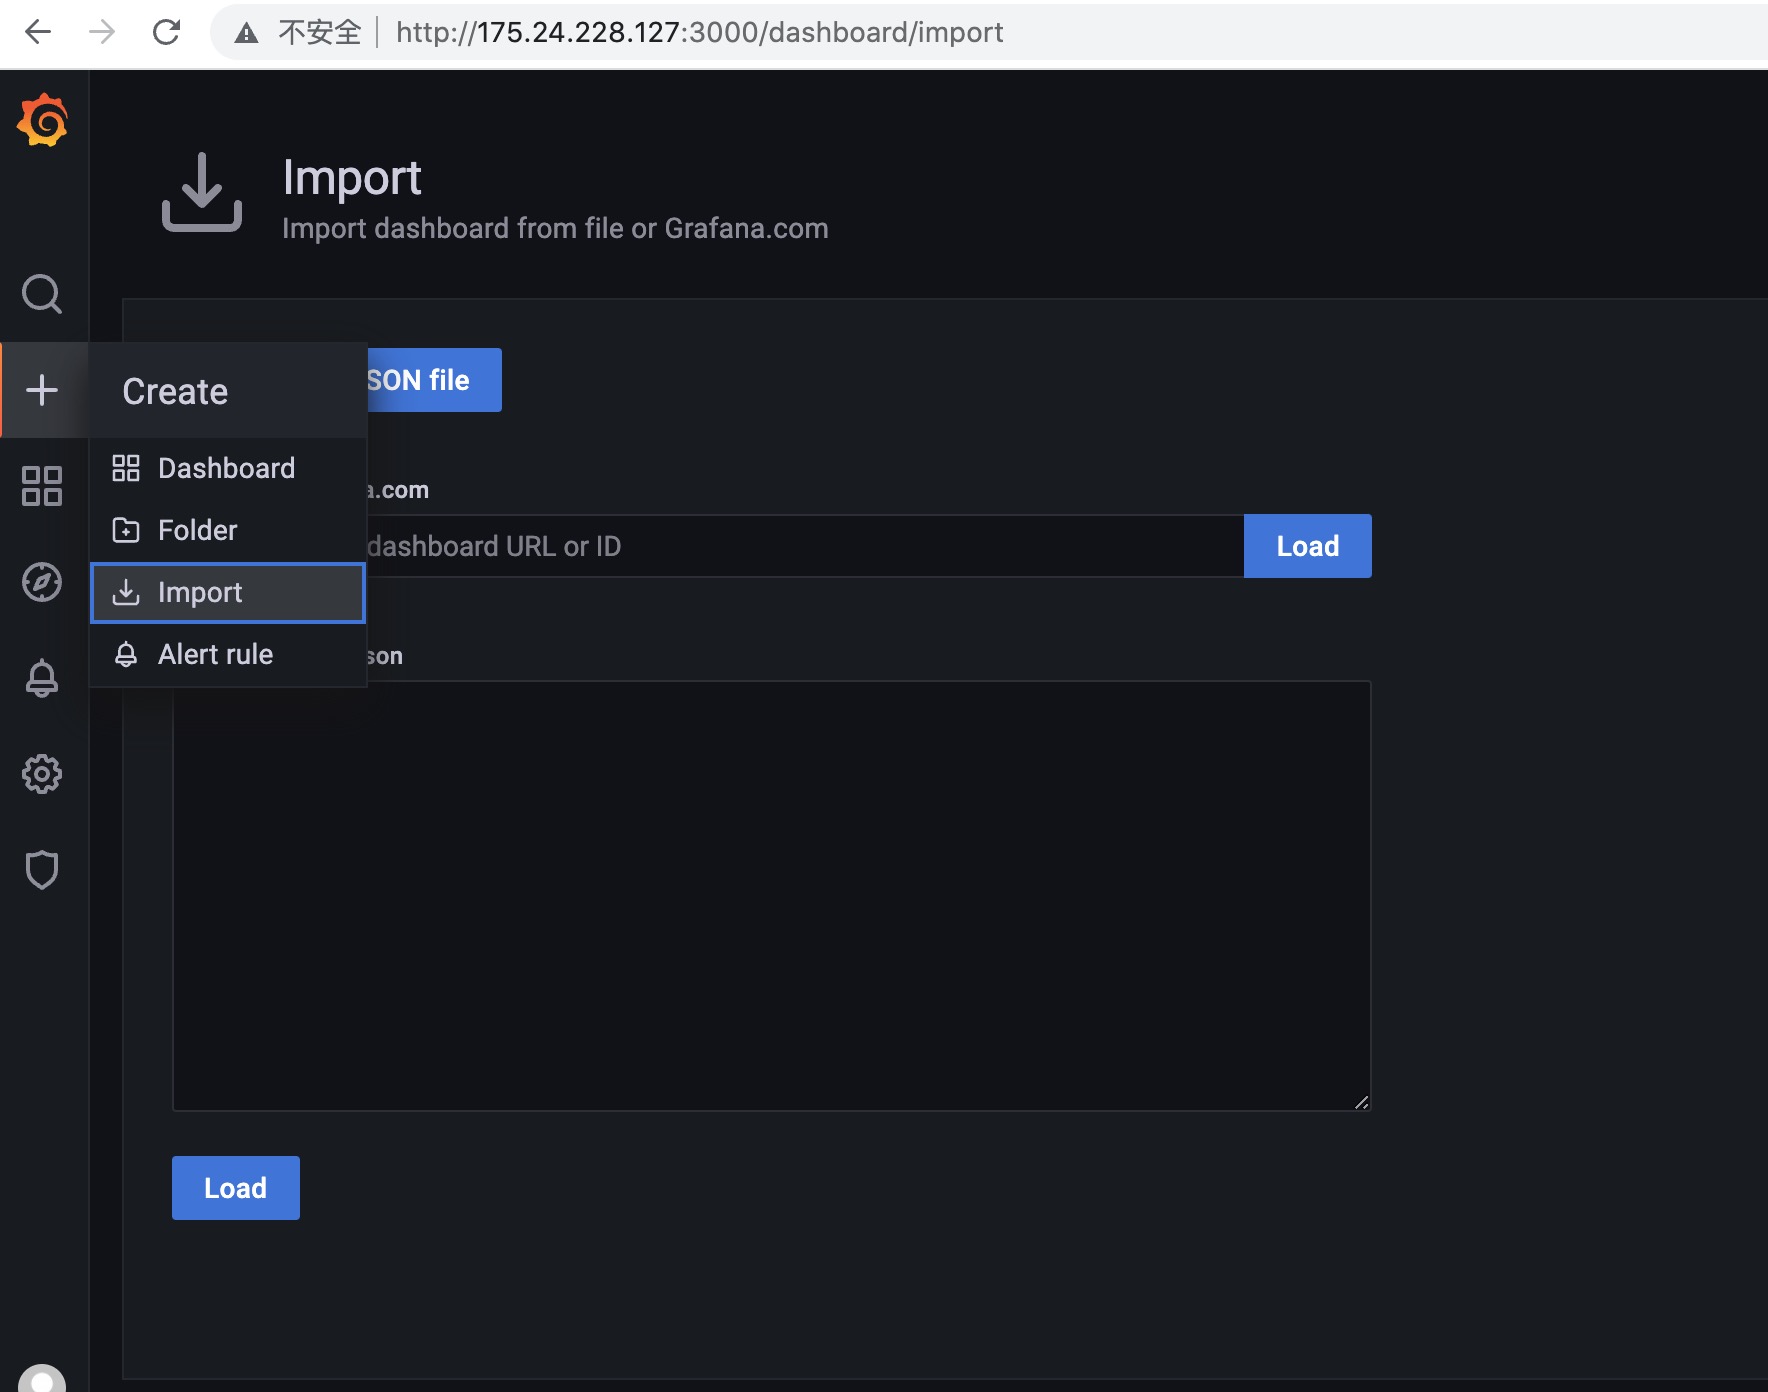
配置Grafana面板从而可视化指标
+ >> Import >> 输入dashboard ID:1860
数据源选择Prometheus。可以看到可视化页面:

该界面展示的就是我的服务器的指标监控数据了。

 浙公网安备 33010602011771号