

使用Prometheus和Grafana监控nacos集群
官方文档:https://nacos.io/zh-cn/docs/monitor-guide.html
按照部署文档搭建好Nacos集群
配置application.properties文件,暴露metrics数据
management.endpoints.web.exposure.include=*
访问{ip}:8848/nacos/actuator/prometheus,看是否能访问到metrics数据
搭建prometheus采集Nacos metrics数据
修改配置文件prometheus.yml采集Nacos metrics数据
  - job_name: 'nacos'
    metrics_path: '/nacos/actuator/prometheus'
    static_configs:
      - targets: ['172.16.0.75:8848','172.16.0.76:8848','172.16.0.235:8848']
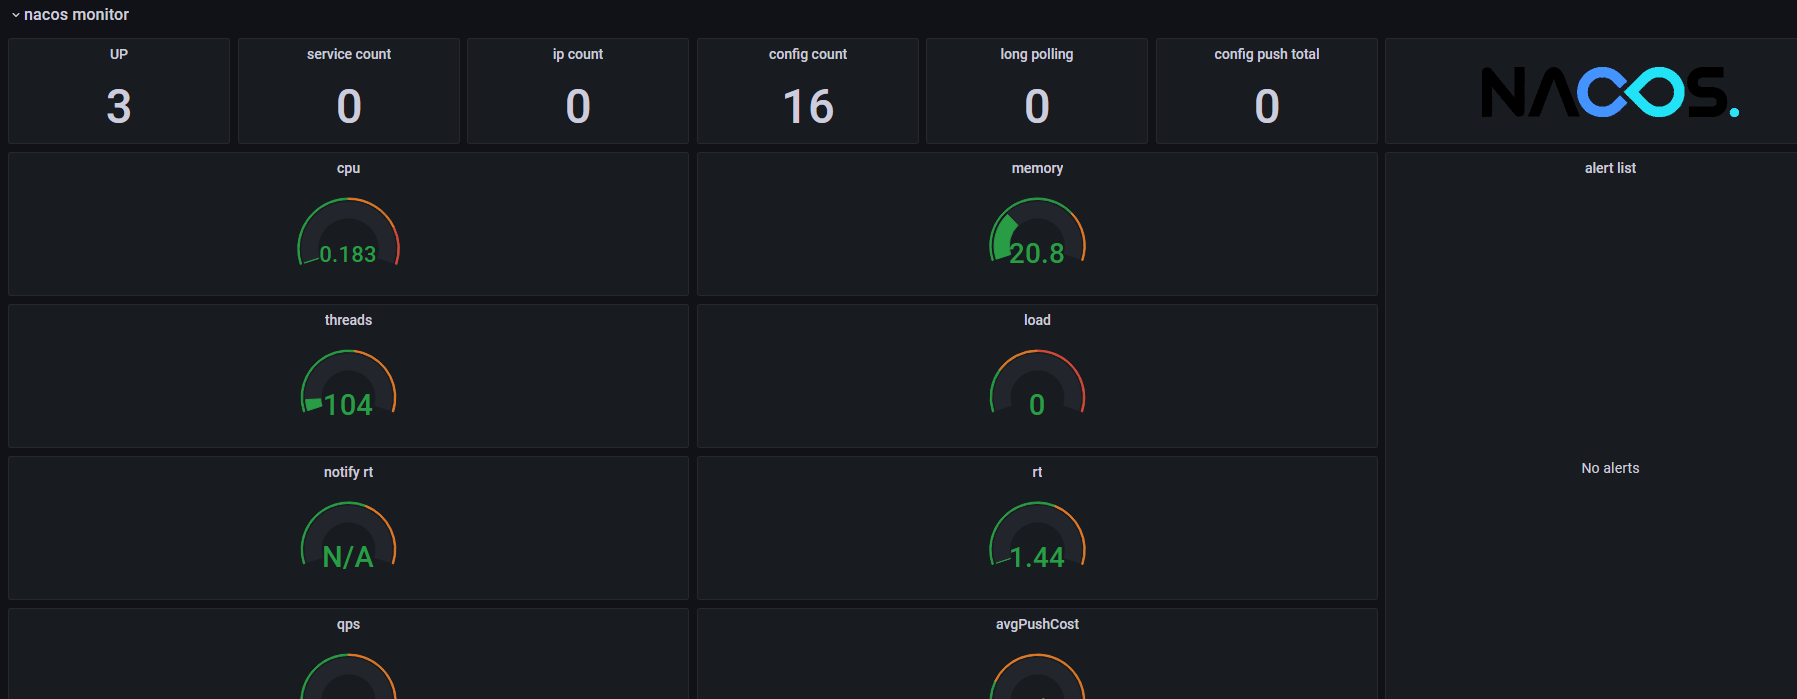
Grafana
https://grafana.com/grafana/dashboards/13221
面板ID:13221

 浙公网安备 33010602011771号