爬取微博热搜榜并进行数据分析
一.主题式网络主题式网络爬虫设计方案
1.爬虫名称:爬取微博热搜榜
2.爬虫爬取的内容:爬取微博热搜榜数据。
3.网络爬虫设计方案概述:用requests库访问页面用get方法获取页面资源,登录页面对页面HTML进行分析,用beautifulsoup库获取并提取自己所需要的信息。再讲数据保存到CSV文件中,进行数据清洗,数据可视化分析,绘制数据图表,并用最小二乘法进行拟合分析。
二、主题页面的结构特征分析
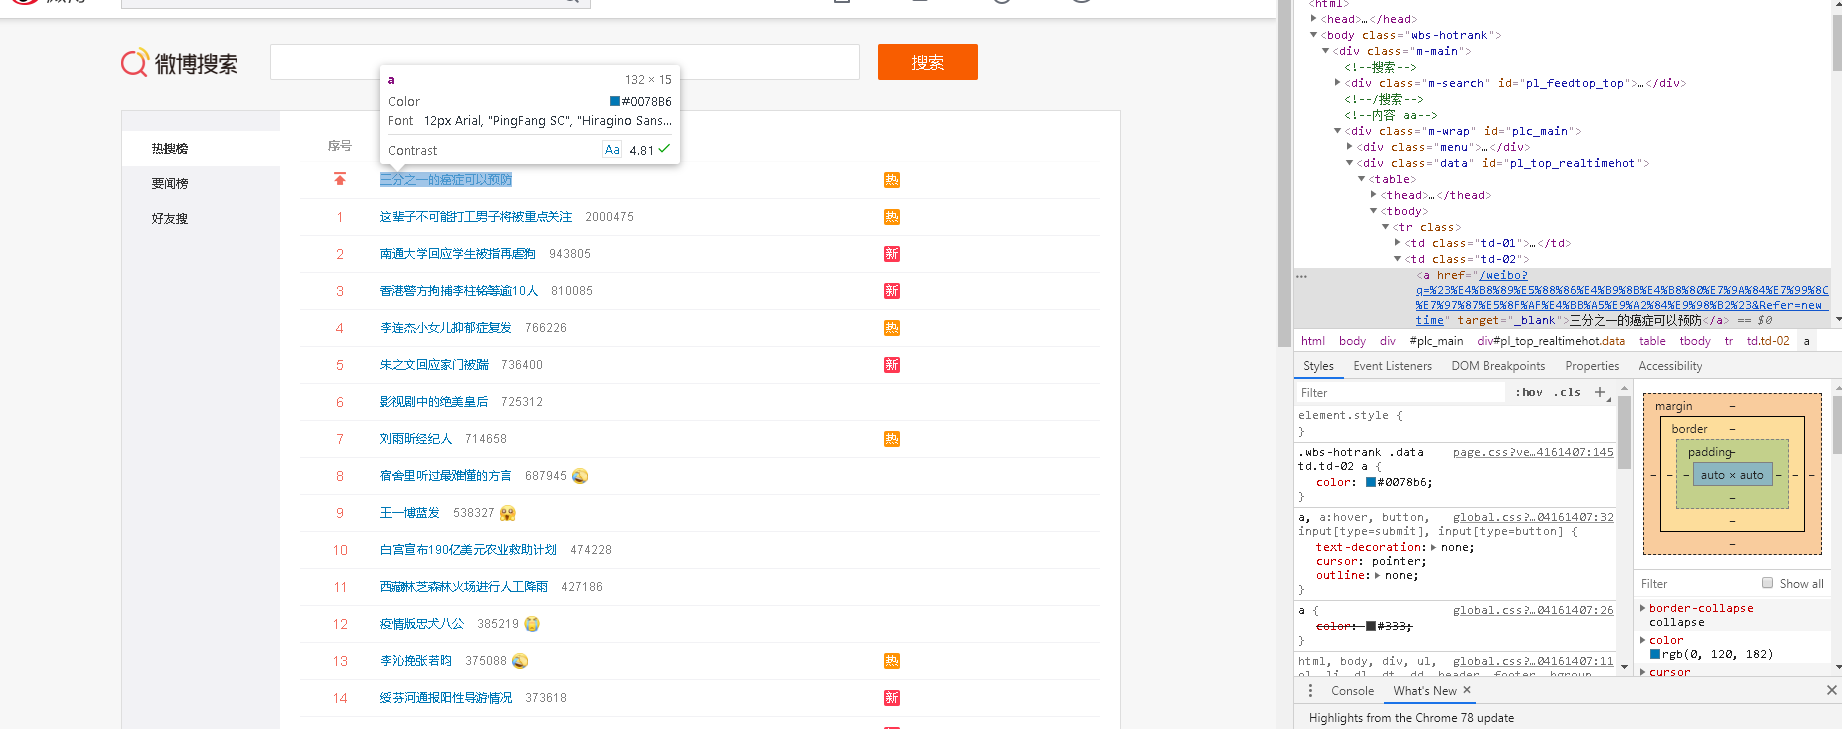
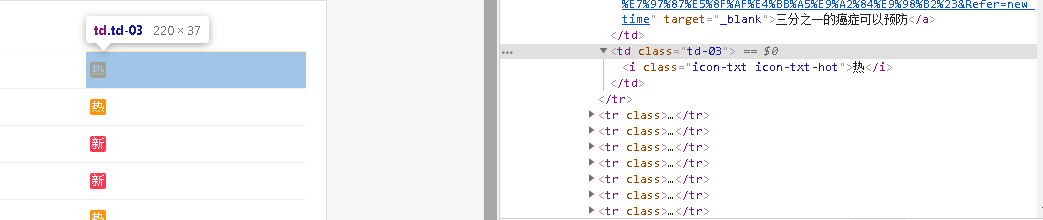
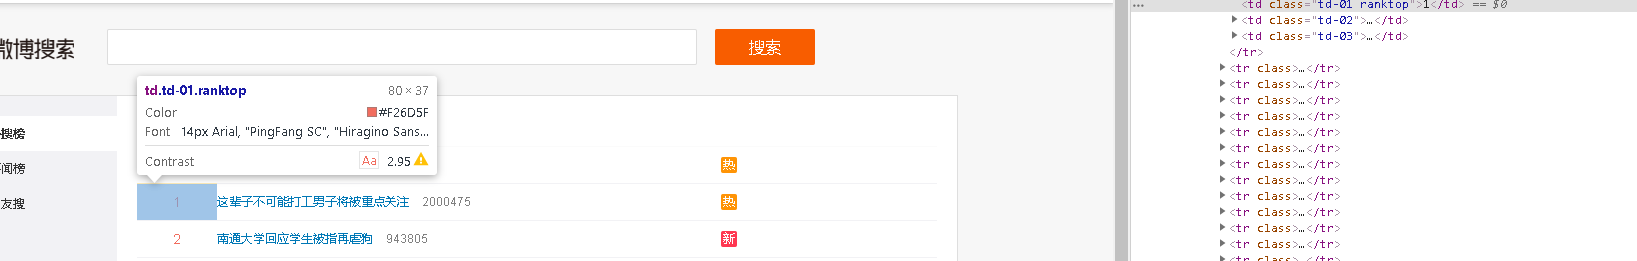
1.主题页面的结构与特征分析:通过观察页面HTML源代码,可以发现每个热搜名称的标题都位于"td",class_='td-02'标签的子标签中,热度和排名则分布在"td",class_='td-03'和"td",class_='td-01'标签中,他们的关系是 class>a>span。按照标签的从属关系 可从标签中遍历出我们所需要的内容。
2.Htmls页面解析
通过页面定位分析发现这是标题所在标签位置,td",class_='td-02“的子标签a 中,我们可以通过find all 函数来提取我们所需要的标题信息
继续审查页面元素 发现热度和排名所在的标签位置,查到所需要的内容的标签位置后,就可以开始编写我的爬虫程序了
三、网络爬虫程序设计
1.数据爬取与采集
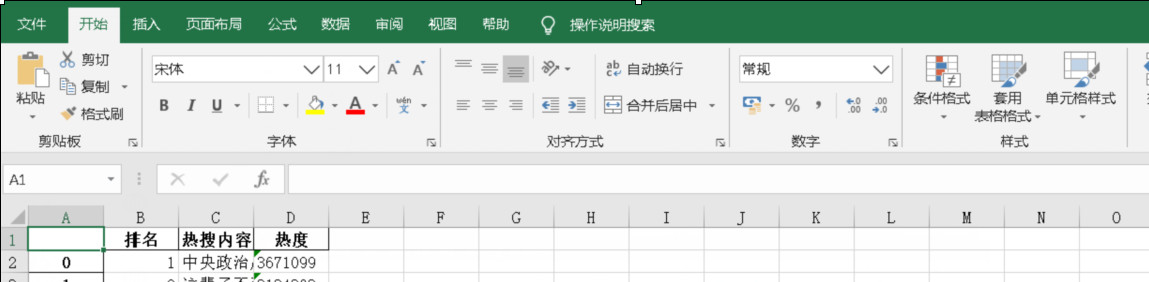
import requests
from bs4 import BeautifulSoup
import bs4
#定义函数第一步从网络上获取热搜排名网页内容
url = "https://s.weibo.com/top/summary?Refer=top_hot&topnav=1&wvr=6"
def getHTMLText(url):
    try:
        #设置表头信息
        kv={"User-Agent":"Mozilla/5.0"}
        r = requests.get(url, headers=kv, timeout=30)  #请求时间30s
        # 解决乱码问题
        r.raise_for_status()
        r.encoding=r.apparent_encoding  #修改编码方式
        return r.text
    except:
        return ""  #若出现异常则会返回空字符串
#使用BeautifulSoup工具解析页面
html = getHTMLText(url)
soup=BeautifulSoup(html,'html.parser')
# 爬取热搜名字
sou = soup.find_all("td",class_='td-02')
#创立空列表 把热搜名字数据填入
name = []
for x in sou:
    name.append(x.a.string)
# 获取热度排名
# 同理创立空列表
paiming = []
top = soup.find_all('span')
for y in top:
    paiming.append(y.string)
#用字符串格式化输出数据
print('{:^40}'.format('微博热搜'))
print('{:^15}\t{:^25}\t{:^40}'.format('排名', '热搜内容', '热度'))
list = []
#输出数据的前20条
for i in range(21):
    print('{:^15}\t{:^25}\t{:^40}'.format(i+1, name[i], paiming[i]))
    list.append([i+1,name[i],paiming[i]])
#用pandas对数据进行储存,并生成文件
df= pd.DataFrame(list,columns = ['排名','热搜内容','热度'])
df.to_csv('resou.csv')

生成文件
2.对数据进行清洗和处理
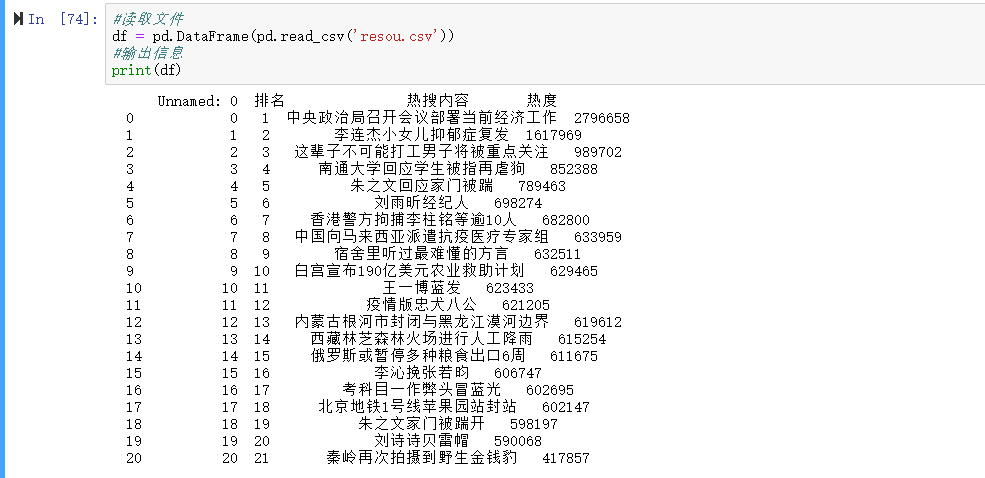
#读取文件
df = pd.DataFrame(pd.read_csv('resou.csv'))
#输出信息
print(df)
#开始进行数据清洗
#删除无效列与行
df.drop('热搜内容', axis=1, inplace = True)
df.head() #输出数据前五行

#检查是否有重复值
df.duplicated()

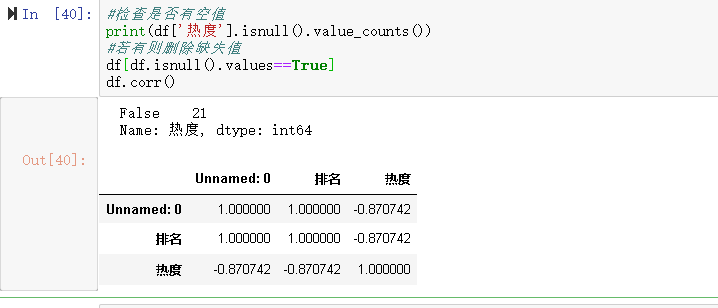
#检查是否有空值
print(df['热度'].isnull().value_counts())
#若有则删除缺失值
df[df.isnull().values==True]
df.corr()
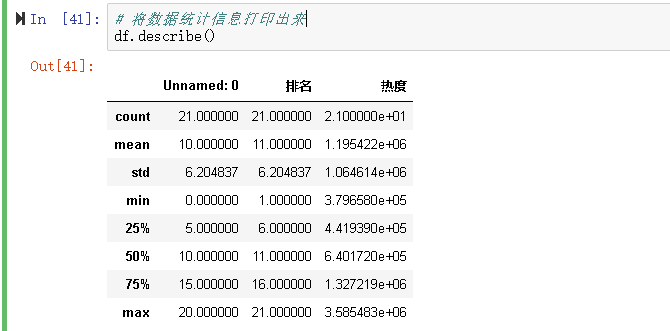
# 将数据统计信息打印出来
df.describe()
3.数据分析与可视化
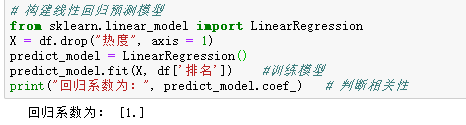
#继续数据分析与可视化
# 构建线性回归预测模型
from sklearn.linear_model import LinearRegression
X = df.drop("热度", axis = 1)
predict_model = LinearRegression()
predict_model.fit(X, df['排名'])    #训练模型
print("回归系数为:", predict_model.coef_)   # 判断相关性
#绘制散点图
import matplotlib.pyplot as plt
from scipy.optimize import leastsq
import numpy as np
%matplotlib inline
排名 = (df["排名"])
热度 = (df["热度"])
plt.rcParams['font.sans-serif']=['SimHei'] #用于正常显示中文标签
plt.figure(figsize=(8,5))
plt.scatter(排名,热度,color=[0,0,1,0.4],label=u"样本数据",linewidth=2)  #颜色用RGB值
plt.title("排名 scatter",color="blue")
plt.xlabel("排名")
plt.ylabel("热度")
plt.legend()
plt.grid()
plt.show()

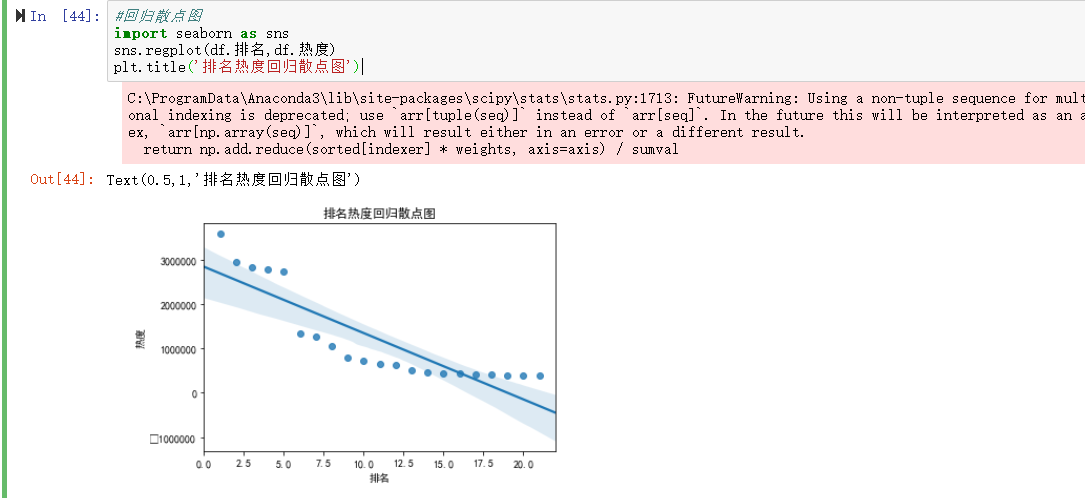
#回归散点图
import seaborn as sns
sns.regplot(df.排名,df.热度)
plt.title('排名热度回归散点图')
#绘制柱状图
plt.figure()
x=np.arange(0,20)
y=df.loc['1':'20','热度']  #选取画图数据范围
plt.bar(x, y,color='c',alpha=0.5) #增加透明度 使图更加美观
plt.xlabel('排名')
plt.ylabel('热度')
plt.title("热搜数据")
plt.show()

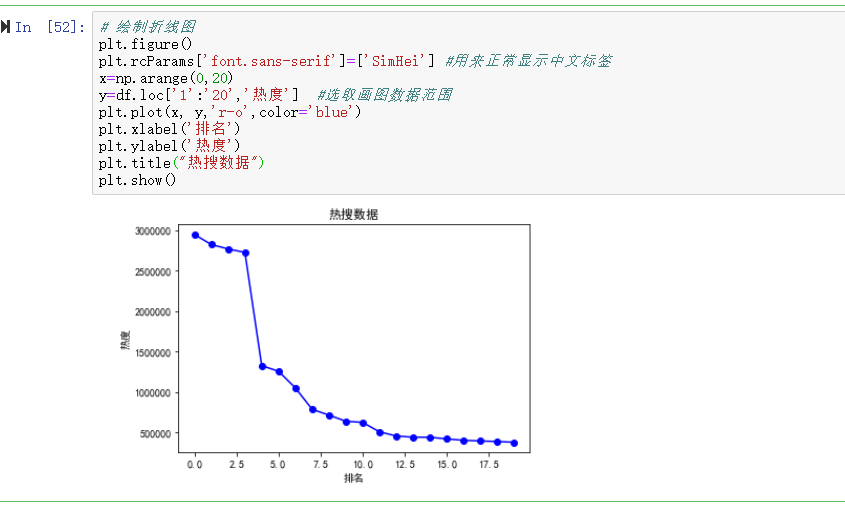
# 绘制折线图
plt.figure()
plt.rcParams['font.sans-serif']=['SimHei'] #用来正常显示中文标签
x=np.arange(0,20)
y=df.loc['1':'20','热度']  #选取画图数据范围
plt.plot(x, y,'r-o',color='blue')
plt.xlabel('排名')
plt.ylabel('热度')
plt.title("热搜数据")
plt.show()
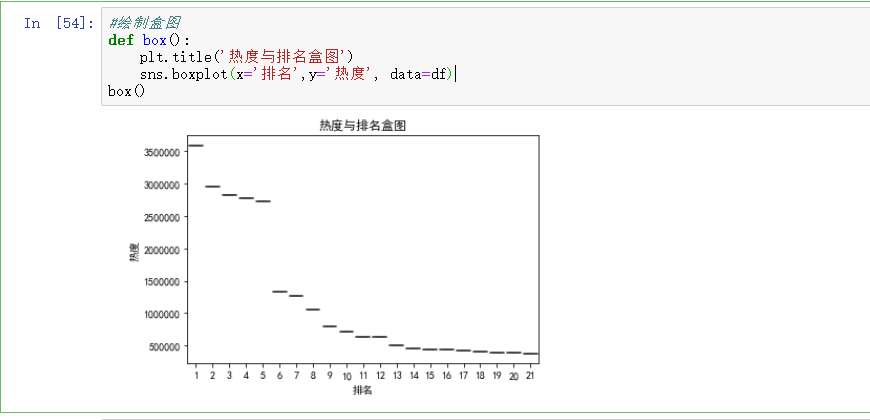
#绘制盒图
def box():
    plt.title('热度与排名盒图')
    sns.boxplot(x='排名',y='热度', data=df)
box()
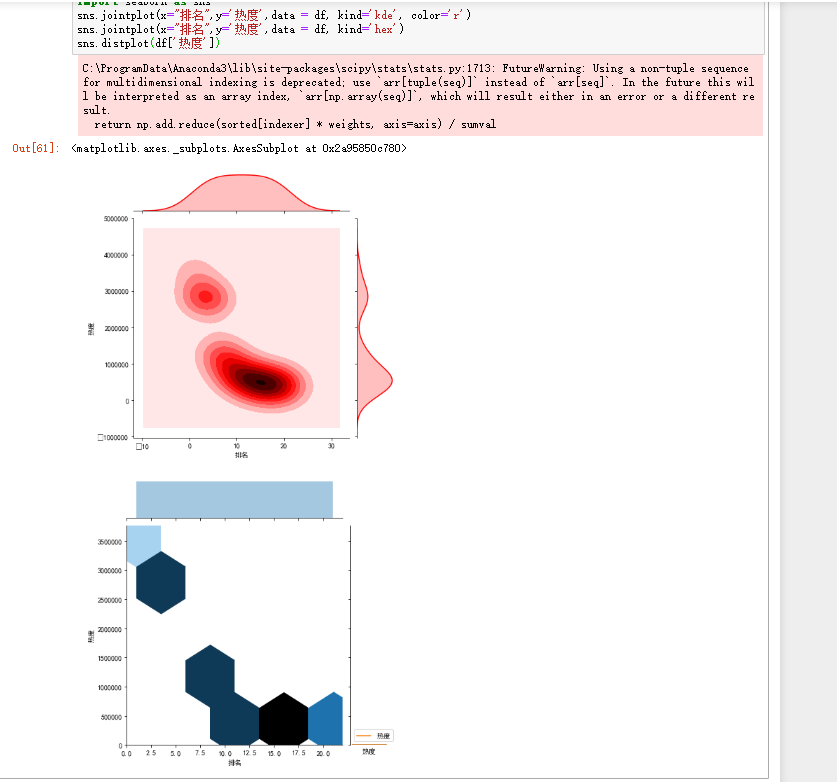
#用Seaborn绘制各种分布图
import seaborn as sns
sns.jointplot(x="排名",y='热度',data = df, kind='kde', color='r')
sns.jointplot(x="排名",y='热度',data = df, kind='hex')
sns.distplot(df['热度'])
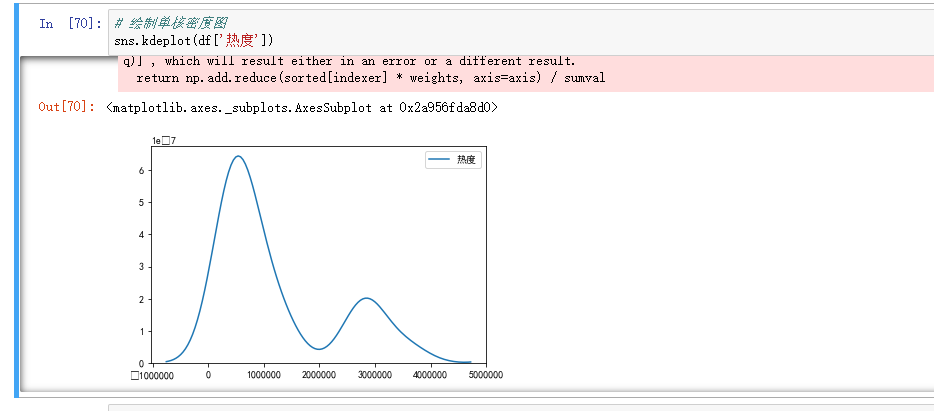
# 绘制单核密度图
sns.kdeplot(df['热度'])
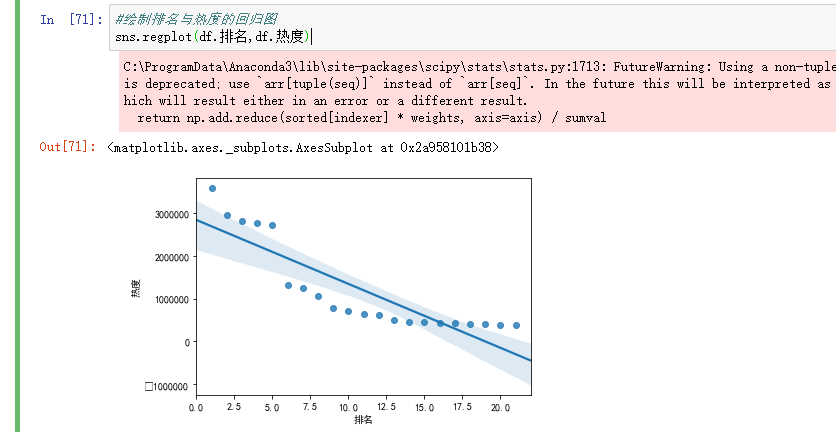
#绘制排名与热度的回归图
sns.regplot(df.排名,df.热度)
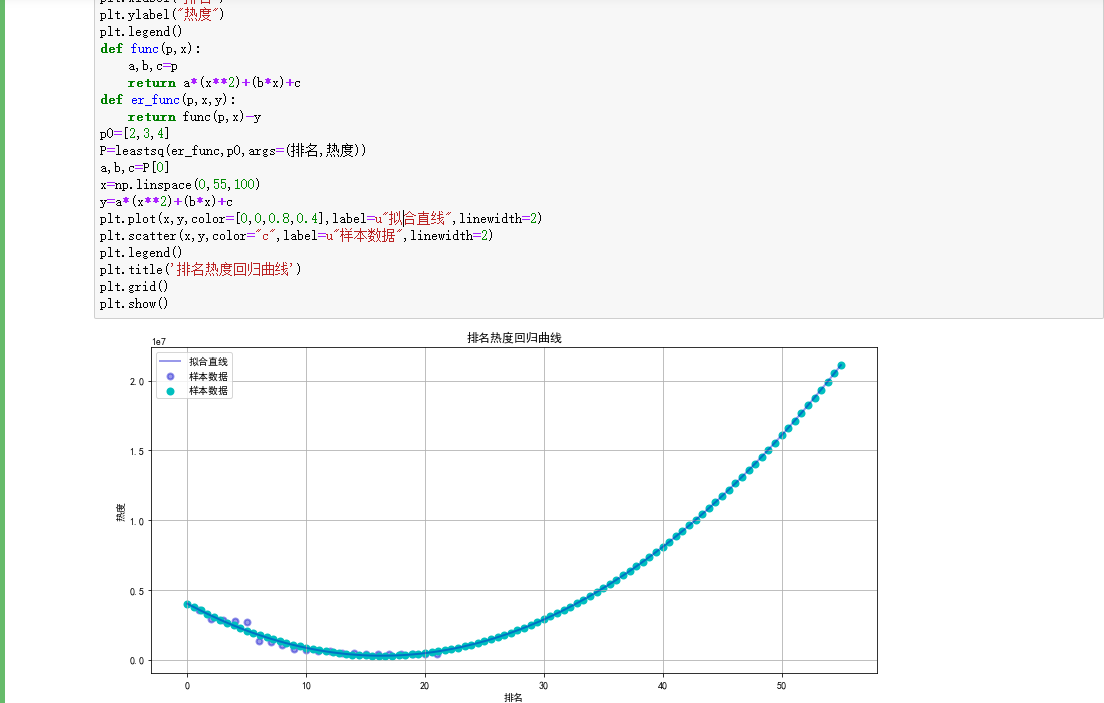
4..根据排名与热度数据之间的关系,分析两个变量拟合一元二次曲线,建立变量之间的回归方程
# 用最小二乘法得出一元二次拟合方程
import numpy as np
from numpy import genfromtxt
import scipy as sp
import matplotlib.pyplot as plt
from scipy.optimize import leastsq
plt.figure(figsize=(13,6))
plt.scatter(排名,热度,color=[0,0,0.8,0.4],label=u"样本数据",linewidth=2)
plt.xlabel("排名")
plt.ylabel("热度")
plt.legend()
def func(p,x):
    a,b,c=p
    return a*(x**2)+(b*x)+c
def er_func(p,x,y):
    return func(p,x)-y
p0=[2,3,4]
P=leastsq(er_func,p0,args=(排名,热度))
a,b,c=P[0]
x=np.linspace(0,55,100)
y=a*(x**2)+(b*x)+c
plt.plot(x,y,color=[0,0,0.8,0.4],label=u"拟合直线",linewidth=2)
plt.scatter(x,y,color="c",label=u"样本数据",linewidth=2)
plt.legend()
plt.title('排名热度回归曲线')
plt.grid()
plt.show()
5.将以上各部分的代码汇总,附上完整程序代码
import requests
from bs4 import BeautifulSoup
import bs4
import pandas as pd   #引入pandas用于数据可视化
from pandas import DataFrame
import seaborn as sns
import numpy as np
import matplotlib.pyplot as plt
from scipy.optimize import leastsq
from sklearn.linear_model import LinearRegression
#定义函数第一步从网络上获取热搜排名网页内容
url = "https://s.weibo.com/top/summary?Refer=top_hot&topnav=1&wvr=6"
def getHTMLText(url):
    try:
        #设置表头信息
        kv={"User-Agent":"Mozilla/5.0"}
        r = requests.get(url, headers=kv, timeout=30)  #请求时间30s
        # 解决乱码问题
        r.raise_for_status()
        r.encoding=r.apparent_encoding  #修改编码方式
        return r.text
    except:
        return ""  #若出现异常则会返回空字符串


#使用BeautifulSoup工具解析页面
html = getHTMLText(url)
soup=BeautifulSoup(html,'html.parser')


# 爬取热搜名字
sou = soup.find_all("td",class_='td-02')


#创立空列表 把热搜名字数据填入
name = []
for x in sou:
    name.append(x.a.string)


# 获取热度排名
# 同理创立空列表
paiming = []
top = soup.find_all('span')
for y in top:
    paiming.append(y.string)


#用字符串格式化输出数据
print('{:^40}'.format('微博热搜'))
print('{:^15}\t{:^25}\t{:^40}'.format('排名', '热搜内容', '热度'))
list = []


#输出数据的前20条
for i in range(21):
    print('{:^15}\t{:^25}\t{:^40}'.format(i+1, name[i], paiming[i]))
    list.append([i+1,name[i],paiming[i]])


#用pandas对数据进行储存,并生成文件
df= pd.DataFrame(list,columns = ['排名','热搜内容','热度'])
df.to_csv('resou.csv')


#读取文件
df = pd.DataFrame(pd.read_csv('resou.csv'))
#输出信息
print(df)


#开始进行数据清洗
#删除无效列与行
df.drop('热搜内容', axis=1, inplace = True)
df.head() #输出数据前五行


#检查是否有重复值
df.duplicated()


#检查是否有空值
print(df['热度'].isnull().value_counts())
#若有则删除缺失值
df[df.isnull().values==True]
df.corr()


# 将数据统计信息打印出来
df.describe()


#进行数据分析与可视化
X = df.drop("热度", axis = 1)
predict_model = LinearRegression()
predict_model.fit(X, df['排名'])    #训练模型
print("回归系数为:", predict_model.coef_)   # 判断相关性


#绘制散点图
import matplotlib.pyplot as plt
from scipy.optimize import leastsq
import numpy as np
%matplotlib inline
排名 = (df["排名"])
热度 = (df["热度"])
plt.rcParams['font.sans-serif']=['SimHei'] #用于正常显示中文标签
plt.figure(figsize=(8,5))
plt.scatter(排名,热度,color=[0,0,1,0.4],label=u"样本数据",linewidth=2)  #颜色用RGB值
plt.title("排名 scatter",color="blue")
plt.xlabel("排名")
plt.ylabel("热度")
plt.legend()
plt.grid()
plt.show()


#回归散点图
import seaborn as sns
sns.regplot(df.排名,df.热度)
plt.title('排名热度回归散点图')


#绘制柱状图
plt.figure()
x=np.arange(0,20)
y=df.loc['1':'20','热度']  #选取画图数据范围
plt.bar(x, y,color='c',alpha=0.5) #增加透明度 使图更加美观
plt.xlabel('排名')
plt.ylabel('热度')
plt.title("热搜数据")
plt.show()


# 绘制折线图
plt.figure()
plt.rcParams['font.sans-serif']=['SimHei'] #用来正常显示中文标签
x=np.arange(0,20)
y=df.loc['1':'20','热度']  #选取画图数据范围
plt.plot(x, y,'r-o',color='blue')
plt.xlabel('排名')
plt.ylabel('热度')
plt.title("热搜数据")
plt.show()


#绘制盒图
def box():
    plt.title('热度与排名盒图')
    sns.boxplot(x='排名',y='热度', data=df)
box()


#用Seaborn绘制各种分布图
sns.jointplot(x="排名",y='热度',data = df, kind='kde', color='r')
sns.jointplot(x="排名",y='热度',data = df, kind='hex')
sns.distplot(df['热度'])


# 绘制单核密度图
sns.kdeplot(df['热度'])


#绘制排名与热度的回归图
sns.regplot(df.排名,df.热度)


# 用最小二乘法得出一元二次拟合方程
plt.figure(figsize=(13,6))
plt.scatter(排名,热度,color=[0,0,0.8,0.4],label=u"样本数据",linewidth=2)
plt.xlabel("排名")
plt.ylabel("热度")
plt.legend()
def func(p,x):
    a,b,c=p
    return a*(x**2)+(b*x)+c
def er_func(p,x,y):
    return func(p,x)-y
p0=[2,3,4]
P=leastsq(er_func,p0,args=(排名,热度))
a,b,c=P[0]
x=np.linspace(0,55,100)
y=a*(x**2)+(b*x)+c
plt.plot(x,y,color=[0,0,0.8,0.4],label=u"拟合直线",linewidth=2)
plt.scatter(x,y,color="c",label=u"样本数据",linewidth=2)
plt.legend()
plt.title('排名热度回归曲线')
plt.grid()
plt.show()
四、结论
1:通过对热搜主题的数据分析与可视化的回归曲线可以看出 热度和排名是成正相关的,数据的可视化与图表可以清晰明了的将数据的关系体现出来,让我们直观的了解热度和排名的变化。
2.对本次程序设计任务完成的情况做一个简单的小结。
此次程序设计我遇到了许多困难,初期对HTML页面的不熟悉,无法从众多标签中提取到自己的有用信息。一次次程序的出错,让我不断的去百度查阅资料和视频一次次的去解决,很好的锻炼了我的耐心,和代码的准确表达能力。也是通过这次设计我很好的学习了BeautifulSoup库的使用,并将它初步熟练掌握。BeautifulSoup库在用于HTML解析和提取相关信息方面是非常优秀的,BeautifulSoup库的掌握对我今后的爬虫设计上也是非常有用的。这次设计也让我意识到了自己的不足,例如 获取数据时如果能掌握正则表达式 就会更加简洁迅速 我也还需要进行进步学习。

 浙公网安备 33010602011771号