Day11-prometheus安装、promQL语句、node_exporter、cadvisor、alertmanager告警
Day11-11.14号作业
1.针对网络的总结
2.prometheus 的安装方式
3.promQL语句
4.node exporter/blackbox exporter/cadvisor
nginx
5.prometheus告警
小结:
prometheus-server1,172.31.2.101,prometheus-server:9090
prometheus-server2,172.31.2.102,grafana:3000
prometheus-node1,172.31.2.181,node_exporter:9100、cadvisor:8080
prometheus-node2,172.31.2.182,node_exporter:9100、alertmanager:9093[9094]
prometheus-node3,172.31.2.183,node_exporter:9100、blackbox_exporter:9115
1.针对网络的总结
- 能用calico就不用flannel
- calico能用IPIP就不用vxlan
ff
2.prometheus 的安装方式
官网https://prometheus.io/docs/introduction/overview/
Prometheus是基于go语言开发的一套开源的监控、报警和时间序列数据库的组合,是由SoundCloud公司开发的开源监控系统,Prometheus于2016年加入CNCF,2018年8月9日prometheus成为CNCF基金会继kubernetes之后毕业的第二个项目,prometheus在容器和微服务领域中得到了广泛的应用,其特点主要如下:
使用key-value的多维度格式保存数据;
数据不使用MySQL这样的传统数据库,面是使用时序数据库,目前是使用的TSDB;
支持第三方dashboard实现更高的图形界面,如grafana功能组件化;
不需要依赖存储,数据可以本地保存也可以远程保存;
服务自动化发现;
强大的数据查询语句功能(PromQL,Prometheus Query Language);
支持不同语言开发的客户端;
官方和社区推出很多exporter;
组件介绍
prometheus server:主服务,接受外部http请求,收集、存储与查询数据等;
prometheus targets:静态收集的目标服务数据;
service discovery:动态发现服务;
prometheus alerting:报警通知;
push gateway:数据收集代理服务器(类似于zabbix proxy)
data visualization and export:数据可视化与数据导致(访问客户端)

2.1通过容器启动prometheus
https://prometheus.io/docs/prometheus/latest/installation/#using-docker
https://hub.docker.com/r/prom/prometheus/tags
root@prometheus-server1:~# docker images
root@prometheus-server1:~# docker ps -a
root@prometheus-server1:~# docker pull prom/prometheus:v2.31.1
root@prometheus-server1:~# docker run -it -d --restart=always -p 9090:9090 prom/prometheus:v2.31.1
浏览器访问prometheus-server1的ip地址验证,http://172.31.2.101:9090
2.2使用apt/yum在线安装prometheus
root@prometheus-server1:~# apt search prometheus
root@prometheus-server1:~# apt-cache madison prometheus
root@prometheus-server1:~# apt install prometheus
浏览器访问验证。
2.3使用operator部署prometheus
https://github.com/prometheus-operator/kube-prometheus
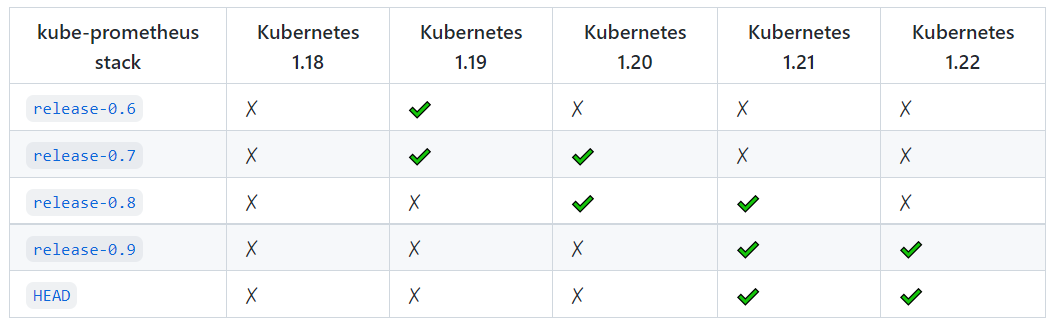
版本兼容性
使用operator部署
kubectl create -f manifests/setup
until kubectl get servicemonitors --all-namespaces ; do date; sleep 1; echo ""; done
kubectl create -f manifests/
会自动创建很多svc和configmap,默认是集群内网访问,可以修改yml文件监听nodeport端口;
会通过daemonset在node节点自动配置pod采集监控;

(1)查看kubernetes版本,下载相应的prometheus operator版本;
root@k8s-master1:~# kubectl get node
root@k8s-master1:~# git clone -b release-0.9 https://github.com/prometheus-operator/kube-prometheus.git

(2)kubectl create -f manifests/setup
root@k8s-master1:~# cd kube-prometheus/manifests/setup
root@k8s-master1:~/kube-prometheus/manifests/setup# grep image: ./* -R  检查有无google镜像,改为使用hub.docker.com镜像;或提前传到本地Harbor使用;
root@k8s-master1:~/kube-prometheus/manifests/setup# kubectl apply -f .
root@k8s-master1:~/kube-prometheus/manifests/setup# kubectl get pod | grep monitor

(3)kubectl create -f manifests/
root@k8s-master1:~/kube-prometheus/manifests/setup# cd ..
root@k8s-master1:~/kube-prometheus/manifests/# grep image: ./* -R | grep gcr.io
./kube-state-metrics-deployment.yaml:        image: k8s.gcr.io/kube-state-metrics/kube-state-metrics:v2.1.1
./prometheus-adapter-deployment.yaml:        image: k8s.gcr.io/prometheus-adapter/prometheus-adapter:v0.9.0
将google镜像,改为使用hub.docker.com镜像;或提前传到本地Harbor使用;
root@k8s-master1:~/kube-prometheus/manifests/# kubectl apply -f .
root@k8s-master1:~/kube-prometheus/manifests/setup# kubectl get pod -n monitoring

(4)通过port-forward临时配置端口访问测试,(不建议长期使用)
root@k8s-master1:~/kube-prometheus/manifests/setup# kubectl port-forward --help
root@k8s-master1:~/kube-prometheus/manifests/setup# kubectl --namespace monitoring port-forward --address 0.0.0.0 svc/prometheus-k8s 9090:9090

(5)修改prometheus-service.yaml设置nodePort端口;
root@k8s-master1:~/kube-prometheus/manifests# vi prometheus-service.yaml
spec:
  type: NodePort
  ports:
  - name: web
    port: 9090
    nodePort: 39090
    targetPort: web
root@k8s-master1:~/kube-prometheus/manifests# kubectl apply -f prometheus-service.yaml

()修改grafana-service.yaml 设置nodePort端口
root@k8s-master1:~/kube-prometheus/manifests# vi grafana-service.yaml
spec:
  type: NodePort
  ports:
  - name: http
    port: 3000
    nodePort: 33000
    targetPort: http
  selector:
    app.kubernetes.io/component: grafana
    app.kubernetes.io/name: grafana
    app.kubernetes.io/part-of: kube-prometheus
root@k8s-master1:~/kube-prometheus/manifests# kubectl apply -f grafana-service.yaml
浏览器访问验证。
root@k8s-master1:~# kubectl get configmap -n monitoring
root@k8s-master1:~# kubectl edit configmap blackbox-exporter-configuration -n monitoring
2.4二进制文件安装prometheus server
官网https://prometheus.io/download/
https://github.com/prometheus/prometheus/tags
(1)下载prometheus二进制包到/apps目录,解压和软连接;
root@prometheus-server1:~# mkdir /apps
root@prometheus-server1:~# cd /apps
root@prometheus-server1:/apps# wget https://github.com/prometheus/prometheus/releases/download/v2.31.1/prometheus-2.31.1.linux-amd64.tar.gz
root@prometheus-server1:/apps# tar zxvf prometheus-2.31.1.linux-amd64.tar.gz
root@prometheus-server1:/apps# ln -sv /apps/prometheus-2.31.1.linux-amd64 /apps/prometheus
root@prometheus-server1:/apps# cd /apps/prometheus
root@prometheus-server1:/apps/prometheus# ll
-rwxr-xr-x 1 3434 3434 100985353 Nov  6 04:38 prometheus*   #prometheus服务可执行程序
-rw-r--r-- 1 3434 3434       934 Nov  6 04:42 prometheus.yml    #配置文件
-rwxr-xr-x 1 3434 3434  90409996 Nov  6 04:41 promtool*      #测试工具,用于检测配置文件、检测metrics数据等;

root@prometheus-server1:/apps/prometheus# ./promtool check config prometheus.yml
Checking prometheus.yml
  SUCCESS: 0 rule files found

(2)创建service文件
root@prometheus-server1:/apps/prometheus#vim /etc/systemd/system/prometheus.service
[Unit]
Description=Prometheus Server
Documentation=https://prometheus.io/docs/introduction/overview/
After=network.target

[Service]
Restart=on-failure
WorkingDirectory=/apps/prometheus/
ExecStart=/apps/prometheus/prometheus --config.file=/apps/prometheus/prometheus.yml

[Install]
WantedBy=multi-user.target

(3)启动prometheus服务;
root@prometheus-server1:/apps/prometheus# systemctl daemon-reload && systemctl start prometheus.service && systemctl enable prometheus.service

(4)查看端口监听情况,浏览器访问验证;
root@prometheus-server1:/apps/prometheus# ss -tln
State           Recv-Q          Send-Q                   Local Address:Port                    Peer Address:Port          Process
LISTEN          0               4096                                 *:9090                               *:*
默认监听9090端口,浏览器访问验证。
3.promQL语句
ff
4.node exporter/blackbox exporter/cadvisor/nginx
4.1 在被监控节点安装node_exporter
root@prometheus-node1:~# mkdir /apps
root@prometheus-node1:~# cd /apps/
root@prometheus-node1:/apps# ls
root@prometheus-node1:/apps# wget https://github.com/prometheus/node_exporter/releases/download/v1.3.0/node_exporter-1.3.0.linux-amd64.tar.gz
root@prometheus-node1:/apps# tar zxvf node_exporter-1.3.0.linux-amd64.tar.gz
root@prometheus-node1:/apps# ln -sv node_exporter-1.3.0.linux-amd64 node_exporter

(2)创建service文件
root@prometheus-node1:/apps/prometheus#vim /etc/systemd/system/node-exporter.service
[Unit]
Description=Prometheus Node Exporter
Documentation=https://prometheus.io/docs/introduction/overview/
After=network.target

[Service]
ExecStart=/apps/node_exporter/node_exporter

[Install]
WantedBy=multi-user.target

(3)启动服务,配置开机自动启动;
root@prometheus-node1:/apps/node_exporter# systemctl daemon-reload && systemctl restart node-exporter.service && systemctl enable node-exporter.service

root@prometheus-node1:/apps# ss -tln
State           Recv-Q          Send-Q                   Local Address:Port                    Peer Address:Port          Process
LISTEN          0               4096                     127.0.0.53%lo:53                           0.0.0.0:*
LISTEN          0               128                            0.0.0.0:22                           0.0.0.0:*
LISTEN          0               128                               [::]:22                              [::]:*
LISTEN          0               4096                                 *:9100                               *:*

mkdir /apps && cd /apps
wget https://github.com/prometheus/node_exporter/releases/download/v1.3.0/node_exporter-1.3.0.linux-amd64.tar.gz
tar zxvf node_exporter-1.3.0.linux-amd64.tar.gz
ln -sv node_exporter-1.3.0.linux-amd64 node_exporter
vi /etc/systemd/system/node-exporter.service
node_exporter默认监听9100端口,浏览器访问http://172.31.2.181:9100/metrics验证。
4.2 配置prometheus采集node指标数据
root@prometheus-server1:~# vi /apps/prometheus/prometheus.yml
# my global config
global:
  scrape_interval: 15s # Set the scrape interval to every 15 seconds. Default is every 1 minute.  #数据收集间隔时间,如果不配置默认为一分钟;
  evaluation_interval: 15s # Evaluate rules every 15 seconds. The default is every 1 minute.  #规则扫描间隔时间,如果不配置默认为一分钟;
  # scrape_timeout is set to the global default (10s).  #超时时间;

# Alertmanager configuration
alerting:  #报警通知配置;
  alertmanagers:
    - static_configs:
        - targets:
          # - alertmanager:9093

# Load rules once and periodically evaluate them according to the global 'evaluation_interval'.
rule_files:  #规则配置;
  # - "first_rules.yml"
  # - "second_rules.yml"

# A scrape configuration containing exactly one endpoint to scrape:
# Here it's Prometheus itself.
scrape_configs:  #数据采集目标配置;
  # The job name is added as a label `job=<job_name>` to any timeseries scraped from this config.
  - job_name: "prometheus"  #抓取node监控指标的job作业一;

    # metrics_path defaults to '/metrics'
    # scheme defaults to 'http'.

    static_configs:
      - targets: ["localhost:9090"]

  - job_name: "prometheus-node"  #抓取node监控指标的job作业二;
    static_configs:
            - targets: ["172.31.2.181:9100","172.31.2.182:9100","172.31.2.183:9100"]


root@prometheus-server1:~# systemctl restart prometheus.service
root@prometheus-server1:~# ss -tln
State           Recv-Q          Send-Q                   Local Address:Port                    Peer Address:Port          Process
LISTEN          0               4096                     127.0.0.53%lo:53                           0.0.0.0:*
LISTEN          0               128                            0.0.0.0:22                           0.0.0.0:*
LISTEN          0               128                               [::]:22                              [::]:*
LISTEN          0               4096                                 *:9090                               *:*
root@prometheus-server1:~#
4.3 配置blackbox_exporter;
官网https://prometheus.io/download/#blackbox_exporter
https://github.com/prometheus/blackbox_exporter
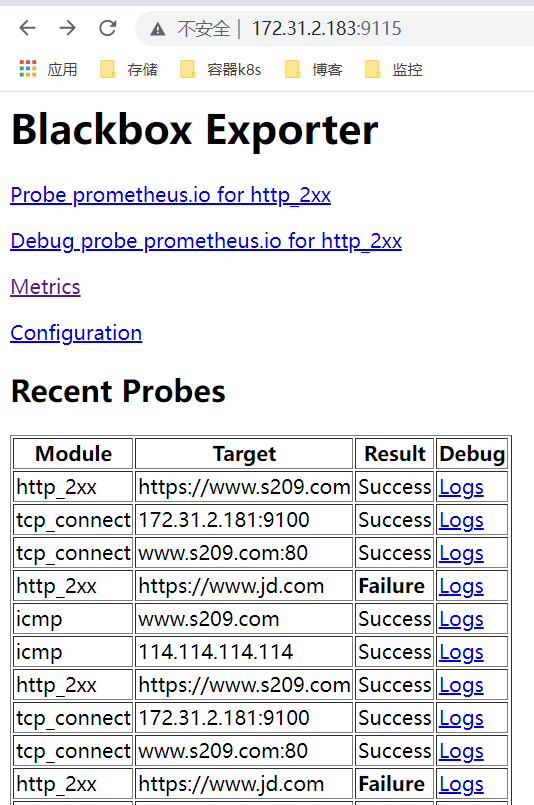
blackbox_exporter是Prometheus官方提供的一个exporter,可以通过HTTP、HTTPS、DNS、TCP和ICMP对被监控节点进行监控和数据采集。
HTTP/HTTPS:URL/API可用必检测
TCP:端口监听检测
ICMP:主机存活检测
DNS:域名解析
部署blackbox_exporter
(1)下载解压tar二进制包;
root@prometheus-node3:/apps# wget https://github.com/prometheus/blackbox_exporter/releases/download/v0.19.0/blackbox_exporter-0.19.0.linux-amd64.tar.gz
root@prometheus-node3:/apps# tar zxvf blackbox_exporter-0.19.0.linux-amd64.tar.gz
root@prometheus-node3:/apps# ln -sv blackbox_exporter-0.19.0.linux-amd64 blackbox_exporter

(2)创建service启动文件;
root@prometheus-node3:/apps/prometheus#vim /etc/systemd/system/blackbox-exporter.service
[Unit]
Description=Prometheus Blackbox Exporter
Documentation=https://prometheus.io/docs/introduction/overview/
After=network.target

[Service]
Type=simple
User=root
Group=root
ExecStart=/apps/blackbox_exporter/blackbox_exporter --config.file=/apps/blackbox_exporter/blackbox.yml --web.listen-address=:9115
Restart=on-failure

[Install]
WantedBy=multi-user.target

(3)启动service服务,设置开机启动;
root@prometheus-node3:/apps# systemctl start blackbox-exporter.service
root@prometheus-node3:/apps# systemctl enable blackbox-exporter.service

root@prometheus-node3:/apps# ss -tln
State           Recv-Q          Send-Q                   Local Address:Port                    Peer Address:Port          Process
LISTEN          0               4096                     127.0.0.53%lo:53                           0.0.0.0:*
LISTEN          0               128                            0.0.0.0:22                           0.0.0.0:*
LISTEN          0               128                               [::]:22                              [::]:*
LISTEN          0               4096                                 *:9115                               *:*
LISTEN          0               4096                                 *:9100                               *:*
4.4配置prometheus调用blackbox_exporter实现对URL/ICMP的监控
blackbox_exporter是Prometheus 官方提供的 exporter 之一,可以提供 http、dns、tcp、icmp 的监控数据采集。
# my global config
global:
  scrape_interval: 15s # Set the scrape interval to every 15 seconds. Default is every 1 minute.
  evaluation_interval: 15s # Evaluate rules every 15 seconds. The default is every 1 minute.
  # scrape_timeout is set to the global default (10s).

# 告警配置
# Alertmanager configuration
alerting:
  alertmanagers:
    - static_configs:
        - targets:
          # - alertmanager:9093

# Load rules once and periodically evaluate them according to the global 'evaluation_interval'.
rule_files:
  # - "first_rules.yml"
  # - "second_rules.yml"

# 抓取数据配置
# A scrape configuration containing exactly one endpoint to scrape:
# Here it's Prometheus itself.
scrape_configs:
  # The job name is added as a label `job=<job_name>` to any timeseries scraped from this config.
  - job_name: "prometheus"

    # metrics_path defaults to '/metrics'
    # scheme defaults to 'http'.

    static_configs:
      - targets: ["localhost:9090"]

# node节点监控
  - job_name: "prometheus-node"
    static_configs:
      - targets: ["172.31.2.181:9100","172.31.2.182:9100","172.31.2.183:9100"]

# 网站http、https状态码监控
  - job_name: "blackbox_http_monitor"
    metrics_path: /probe
    params:
       module: [http_2xx]
    static_configs:
       - targets: ["https://www.jd.com","https://www.s209.com"]
         labels:
            instance: http_status
            group: web
    relabel_configs:
       - source_labels: [__address__]
         target_label: __param_target
       - source_labels: [__param_target]
         target_label: url
       - target_label: __address__
         replacement: 172.31.2.183:9115

# ICMP检测
  - job_name: "blackbox_ping_monitor"
    metrics_path: /probe
    params:
       module: [icmp]
    static_configs:
       - targets: ["114.114.114.114","www.s209.com"]
         labels:
            instance: ping_status
            group: icmp
    relabel_configs:
       - source_labels: [__address__]
         target_label: __param_target
       - source_labels: [__param_target]
         target_label: ip
       - target_label: __address__
         replacement: 172.31.2.183:9115

# TCP端口检测
  - job_name: "blackbox_tcp_port_monitor"
    metrics_path: /probe
    params:
       module: [tcp_connect]
    static_configs:
       - targets: ["172.31.2.181:9100","www.s209.com:80"]
         labels:
            instance: port_status
            group: port
    relabel_configs:
       - source_labels: [__address__]
         target_label: __param_target
       - source_labels: [__param_target]
         target_label: ip
       - target_label: __address__
         replacement: 172.31.2.183:9115


root@prometheus-server1:~# /apps/prometheus/promtool check config /apps/prometheus/prometheus.yml
Checking /apps/prometheus/prometheus.yml
  SUCCESS: 0 rule files found

root@prometheus-server1:~# systemctl restart prometheus.service
root@prometheus-server1:~# ss -tln
State           Recv-Q          Send-Q                   Local Address:Port                    Peer Address:Port          Process
LISTEN          0               4096                     127.0.0.53%lo:53                           0.0.0.0:*
LISTEN          0               128                            0.0.0.0:22                           0.0.0.0:*
LISTEN          0               128                               [::]:22                              [::]:*
LISTEN          0               4096                                 *:9090                               *:*
root@prometheus-server1:~#
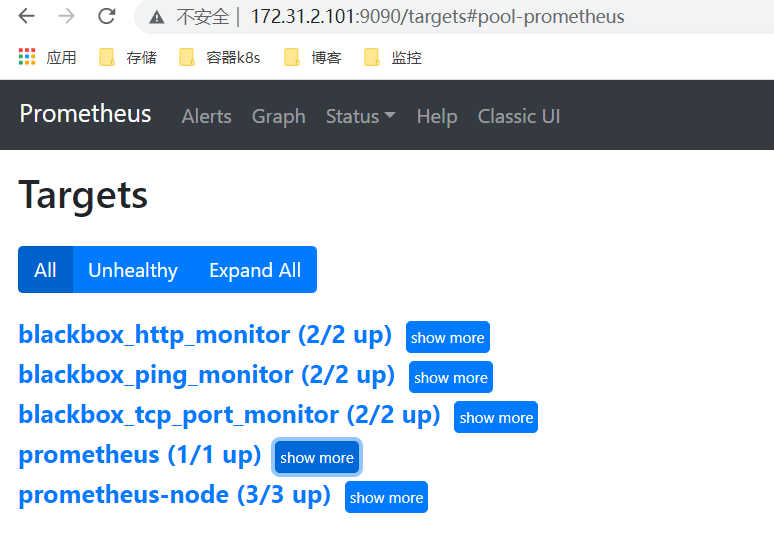
prometheus示例:
blackbox_exporter示例:
4.5 安装grafana展示prometheus抓取的指标数据
官网https://grafana.com/grafana/download/7.5.11?pg=get&plcmt=selfmanaged-box1-cta1&edition=oss
选择安装7.5.11版本使用,稳定性和兼容性相对高一些;
sudo apt-get install -y adduser libfontconfig1
wget https://dl.grafana.com/oss/release/grafana_7.5.11_amd64.deb
sudo dpkg -i grafana_7.5.11_amd64.deb
systemctl daemon-reload && systemctl enable grafana-server && systemctl start grafana-server
选择另外一台节点rometheus-server2安装,和prometheus分开部署,测试验证;
root@prometheus-server2:/apps# more /etc/grafana/grafana.ini
##################### Grafana Configuration Example #####################
#
# Everything has defaults so you only need to uncomment things you want to
# change

# possible values : production, development
;app_mode = production

# instance name, defaults to HOSTNAME environment variable value or hostname if HOSTNAME var is empty
;instance_name = ${HOSTNAME}

#################################### Paths ####################################
[paths]
# Path to where grafana can store temp files, sessions, and the sqlite3 db (if that is used)
;data = /var/lib/grafana

# Temporary files in `data` directory older than given duration will be removed
;temp_data_lifetime = 24h

# Directory where grafana can store logs
;logs = /var/log/grafana

# Directory where grafana will automatically scan and look for plugins
;plugins = /var/lib/grafana/plugins

# folder that contains provisioning config files that grafana will apply on startup and while running.
;provisioning = conf/provisioning

#################################### Server ####################################
[server]
# Protocol (http, https, h2, socket)
;protocol = http

# The ip address to bind to, empty will bind to all interfaces
;http_addr =

# The http port  to use
;http_port = 3000

root@prometheus-server2:/apps# ss -tln
State           Recv-Q          Send-Q                   Local Address:Port                    Peer Address:Port          Process
LISTEN          0               4096                     127.0.0.53%lo:53                           0.0.0.0:*
LISTEN          0               128                            0.0.0.0:22                           0.0.0.0:*
LISTEN          0               128                               [::]:22                              [::]:*
LISTEN          0               4096                                 *:3000                               *:*
root@prometheus-server2:/apps#
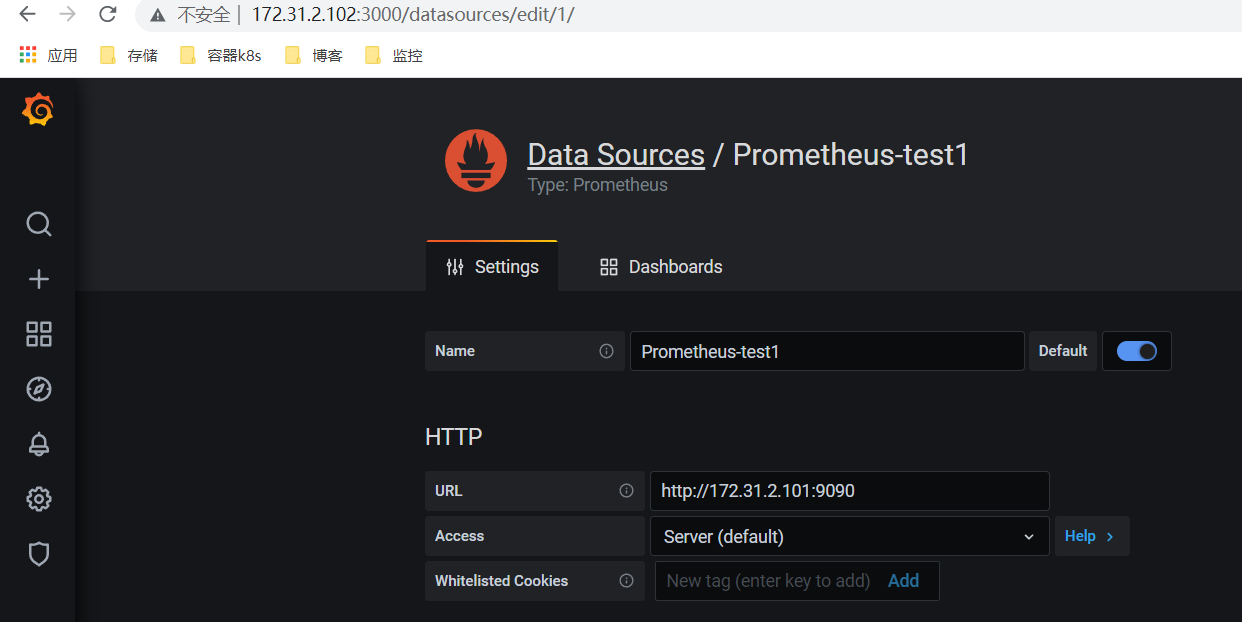
使用Grafana:
1> 添加数据源;
2> 导入展示模板
node_exporter模板:8919
blackbox_exporter模板:9719
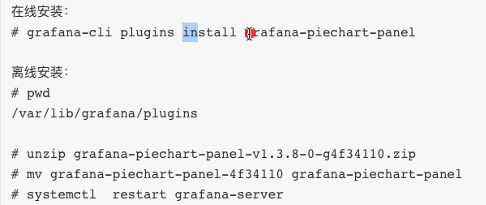
pod模板:395 或 893
3> 安装饼图插件https://grafana.com/grafana/plugins/grafana-piechart-panel/
4.6 部署cadvisor监控Pod资源使用情况
官网https://github.com/google/cadvisor
Cadvisor由谷歌开源,cadvisor不仅可以搜集一台机器上所有运行的容器信息,还提供基础查询界面和http接口,方便其它组件如Prometheus进行数据抓取,cadvisor可以对节点机器上的资源及容器进行实时监控和性能数据采集,包括CPU使用情况、内存使用情况、网络吞吐量及文件系统使用情况。
k8s 1.12之前cadvisor集成在node节点的kubelet服务中,从1.12版本开始分离为两个组件,因此需要在node节点单独部署cadvisor。
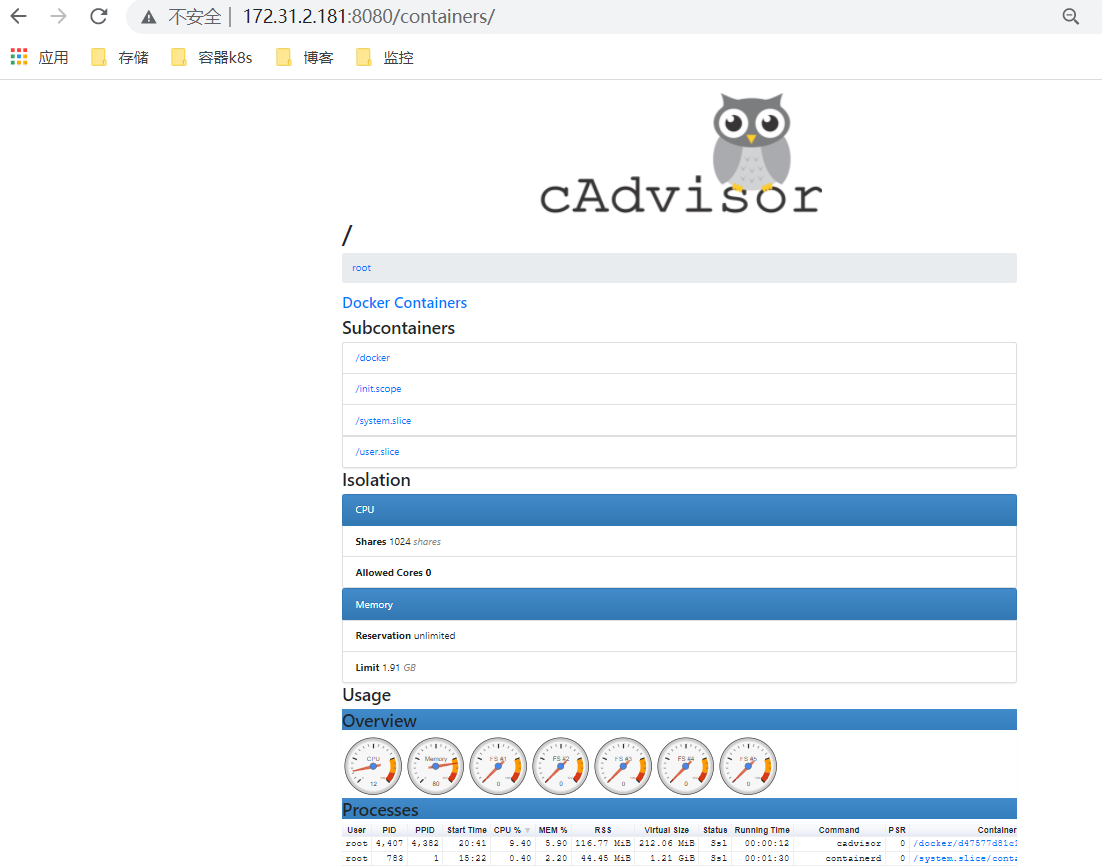
(1)准备cadvisor镜像;
root@k8s-master1:~# docker load -i cadvisor-v0.39.2.tar.gz
root@k8s-master1:~# docker tag gcr.io/cadvisor/cadvisor:v0.39.2 harbor.s209.com/baseimage/cadvisor:v0.39.2
root@k8s-master1:~# docker push harbor.s209.com/baseimage/cadvisor:v0.39.2

(2)启动cadvisor容器;
docker run \
  --volume=/:/rootfs:ro \
  --volume=/var/run:/var/run:ro \
  --volume=/sys:/sys:ro \
  --volume=/var/lib/docker/:/var/lib/docker:ro \
  --volume=/dev/disk/:/dev/disk:ro \
  --publish=8080:8080 \
  --detach=true \
  --name=cadvisor \
  --privileged \
  --device=/dev/kmsg \
  harbor.s209.com/baseimage/cadvisor:v0.39.2

(3)验证cadvisor web界面(猫头鹰)
4.7配置prometheus采集pos监控指标
root@prometheus-server1:~# vi /apps/prometheus/prometheus.yml
……
# Pod容器监控
  - job_name: "prometheus-k8s-containers"
    static_configs:
            - targets: ["172.31.7.111:8080","172.31.8.112:8080","172.31.7.113:8080"]

root@prometheus-server1:~# /apps/prometheus/promtool check config /apps/prometheus/prometheus.yml
Checking /apps/prometheus/prometheus.yml
  SUCCESS: 0 rule files found

root@prometheus-server1:~# systemctl restart prometheus.service
在Grafana添加pod模板395 或893展示监控指标。
5.prometheus告警
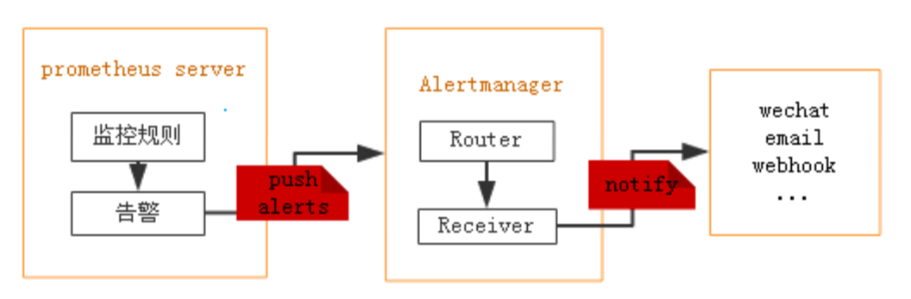
prometheus-->触发阈值-->超出持续时间-->alertmanager-->分组|抑制|静默-->媒体类型-->邮件|钉钉|微信等。
分组(group):将类似性质的警报合并为单个通知,比如网络通知、主机通知、服务通知。
静默(silences):是一种简单的特定时间静音的机制,例如:服务器要升级维护可以先设置这个时间段告警静默。
抑制(inhibition):当警报发出后,停止重复发送由此警报引发的其他警报即合并一个故障引起的多个报警事件,可以消除冗余告敬。
5.1安装和配置告警组件alertmanager
https://prometheus.io/download/#alertmanager
官网https://prometheus.io/docs/alerting/latest/configuration/
(1)下载解压alertmanager二进制包;
root@prometheus-node2:/apps# wget https://github.com/prometheus/alertmanager/releases/download/v0.23.0/alertmanager-0.23.0.linux-amd64.tar.gz
root@prometheus-node2:/apps# tar zxvf alertmanager-0.23.0.linux-amd64.tar.gz
root@prometheus-node2:/apps# ln -sv alertmanager-0.23.0.linux-amd64 alertmanager

(2)配置service文件;
root@prometheus-node2:/apps# vim /etc/systemd/system/alertmanager.service
[Unit]
Description=Prometheus Alertmanager
Documentation=https://prometheus.io/docs/introduction/overview/
After=network.target

[Service]
Restart=on-failure
WorkingDirectory=/apps/alertmanager
ExecStart=/apps/alertmanager/alertmanager

[Install]
WantedBy=multi-user.target

(3)启动service服务和设置开机自启动;
root@prometheus-node2:/apps# systemctl start alertmanager.service && systemctl enable alertmanager.service

root@prometheus-node2:/apps# netstat -tulpn
Active Internet connections (only servers)
Proto Recv-Q Send-Q Local Address           Foreign Address         State       PID/Program name
tcp        0      0 0.0.0.0:22              0.0.0.0:*               LISTEN      811/sshd: /usr/sbin
tcp        0      0 127.0.0.53:53           0.0.0.0:*               LISTEN      748/systemd-resolve
tcp6       0      0 :::22                   :::*                    LISTEN      811/sshd: /usr/sbin
tcp6       0      0 :::9093                 :::*                    LISTEN      3721/alertmanager
tcp6       0      0 :::9094                 :::*                    LISTEN      3721/alertmanager
tcp6       0      0 :::9100                 :::*                    LISTEN      3248/node_exporter
udp        0      0 127.0.0.53:53           0.0.0.0:*                           748/systemd-resolve
udp6       0      0 :::9094                 :::*                                3721/alertmanager

(4)配置alertmanager.yml发件服务器和收件人
root@prometheus-node2:/apps/alertmanager# more alertmanager.yml
global:
  resolve_timeout: 5m
  smtp_smarthost: 'smtp.qq.com:465'
  smtp_from: 'dqemail@qq.com'
  smtp_auth_username: 'dqemail@qq.com'
  smtp_auth_password: 'xxxxx'
  smtp_hello: '@qq.com'
  smtp_require_tls: false

route:
  group_by: ['alertname']
  group_wait: 30s
  group_interval: 5m
  repeat_interval: 1h
  receiver: 'web.hook'
receivers:
- name: 'web.hook'
  #webhook_configs:
  #- url: 'http://127.0.0.1:5001/'
  email_configs:
  - to: 'dqemail@qq.com'

inhibit_rules:
  - source_match:
      severity: 'critical'
    target_match:
      severity: 'warning'
    equal: ['alertname', 'dev', 'instance']

(5)重启alertmanager
root@prometheus-node2:/apps/alertmanager# systemctl restart alertmanager.service
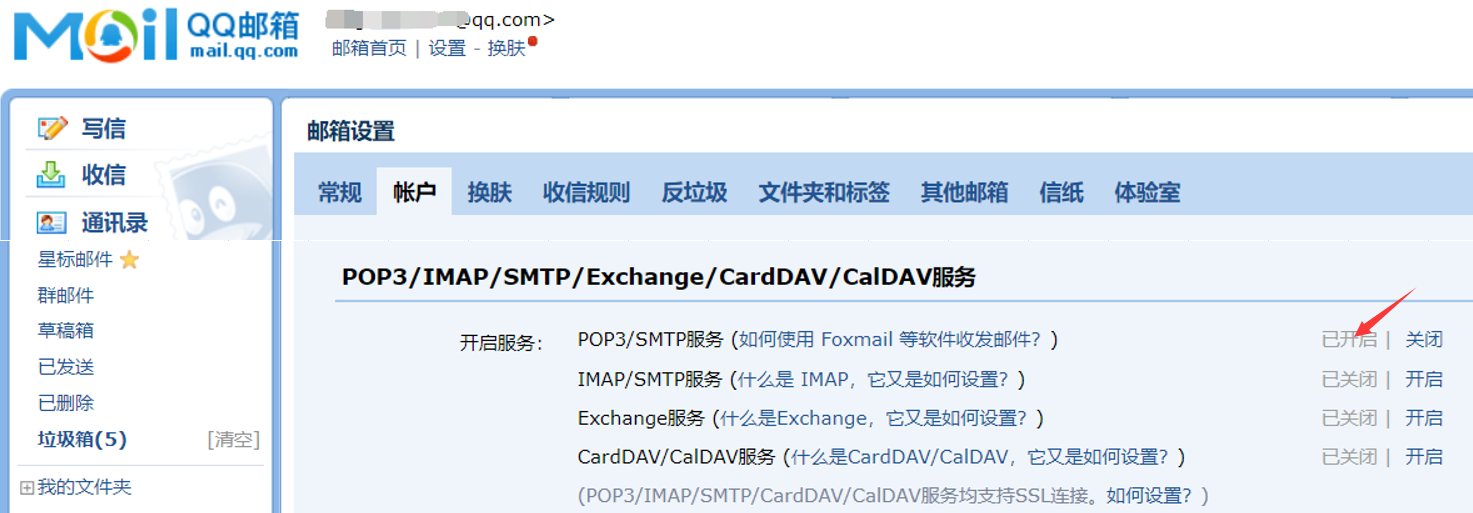
附qq邮箱设置,需要短信验证获取授权码;
5.2配置prometheus server的告警配置和rule规则
(1)配置告警规则rule.yml
root@prometheus-server1:/apps/prometheus# vi rule.yml
groups:
- name: alertmanager_pod.rules
rules:
- alert: "Pod_all_cpu_usage"
expr: (sum by(name)(rate(container_cpu_usage_seconds_total{image!=""}[5m]))*100) > 10
for: 2m
labels:
severity: critical
service: pods
annotations:
description: 容器 {{$labels.alertname}} CPU资源利用率大于10%,(current value is {{$value}})
summary: Dev CPU 负载告警
- alert: "Pod_all_memory_usage"
expr: sort_desc(avg by(name)(irate(node_memory_MemFree_bytes {name!=""}[5m]))) > 2 #内存大于2G
for: 2m
labels:
severity: critical
annotations:
description: 容器 {{$labels.alertname}} Memory资源利用率大于2G,(current value is {{$value}})
summary: Dev Memory 负载告警
- alert: "Pod_all_network_receive_usage"
expr: sum by (name)(irate(container_network_receive_bytes_total{container_name="POD"}[1m])) > 1
for: 2m
labels:
severity: critical
annotations:
description: 容器 {{$labels.alertname}} network_recevie资源利用率大于50M,(current value is {{$value}})
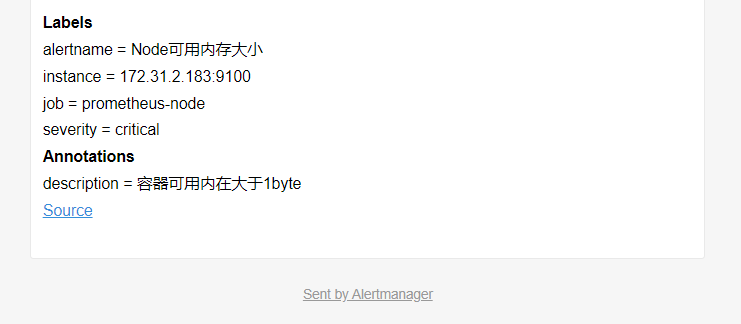
- alert: "Node可用内存大小"
expr: node_memory_MemFree_bytes > 1 #设置一个错误值触发告警
for: 2m
labels:
severity: critical
annotations:
description: 容器可用内存大于1byte
(2)配置prometheus主配置文件调用的alertmanager服务器ip和rule文件;
root@prometheus-server1:/apps/prometheus# vi /apps/prometheus/prometheus.yml
# my global config
global:
scrape_interval: 15s # Set the scrape interval to every 15 seconds. Default is every 1 minute.
evaluation_interval: 15s # Evaluate rules every 15 seconds. The default is every 1 minute.
# scrape_timeout is set to the global default (10s).
# 告警配置
# Alertmanager configuration
alerting:
alertmanagers:
- static_configs:
- targets:
- 172.31.2.182:9093
# Load rules once and periodically evaluate them according to the global 'evaluation_interval'.
rule_files:
# - "first_rules.yml"
# - "second_rules.yml"
- "/apps/prometheus/rule.yml"
(3)检查验证配置文件,重启prometheus服务;
root@prometheus-server1:/apps/prometheus# /apps/prometheus/promtool check config /apps/prometheus/prometheus.yml
Checking /apps/prometheus/prometheus.yml
SUCCESS: 1 rule files found
Checking /apps/prometheus/rule.yml
SUCCESS: 4 rules found
root@prometheus-server1:/apps/prometheus# systemctl restart prometheus.service
(4)验证是否收到邮件;
小结
prometheus-server1,172.31.2.101,prometheus-server:9090
prometheus-server2,172.31.2.102,grafana:3000
prometheus-node1,172.31.2.181,node_exporter:9100、cadvisor:8080
prometheus-node2,172.31.2.182,node_exporter:9100、alertmanager:9093[9094]
prometheus-node3,172.31.2.183,node_exporter:9100、blackbox_exporter:9115
prometheus.yml示例
# my global config
global:
  scrape_interval: 15s # Set the scrape interval to every 15 seconds. Default is every 1 minute.
  evaluation_interval: 15s # Evaluate rules every 15 seconds. The default is every 1 minute.
  # scrape_timeout is set to the global default (10s).

# 告警配置
# Alertmanager configuration
alerting:
  alertmanagers:
    - static_configs:
        - targets:
          #- 172.31.2.182:9093

# Load rules once and periodically evaluate them according to the global 'evaluation_interval'.
rule_files:
  # - "first_rules.yml"
  # - "second_rules.yml"
  #- "/apps/prometheus/rule.yml"

# 抓取数据配置
# A scrape configuration containing exactly one endpoint to scrape:
# Here it's Prometheus itself.
scrape_configs:
  # The job name is added as a label `job=<job_name>` to any timeseries scraped from this config.
  - job_name: "prometheus"

    # metrics_path defaults to '/metrics'
    # scheme defaults to 'http'.

    static_configs:
      - targets: ["localhost:9090"]

# node节点监控
  - job_name: "prometheus-node"
    static_configs:
      - targets: ["172.31.2.181:9100","172.31.2.182:9100","172.31.2.183:9100"]

# 网站http、https状态码检测
  - job_name: "blackbox_http_monitor"
    metrics_path: /probe
    params:
       module: [http_2xx]
    static_configs:
       - targets: ["https://www.jd.com","https://www.s209.com"]
         labels:
            instance: http_status
            group: web
    relabel_configs:
       - source_labels: [__address__]
         target_label: __param_target
       - source_labels: [__param_target]
         target_label: url
       - target_label: __address__
         replacement: 172.31.2.183:9115

# ICMP检测
  - job_name: "blackbox_ping_monitor"
    metrics_path: /probe
    params:
       module: [icmp]
    static_configs:
       - targets: ["114.114.114.114","www.s209.com"]
         labels:
            instance: ping_status
            group: icmp
    relabel_configs:
       - source_labels: [__address__]
         target_label: __param_target
       - source_labels: [__param_target]
         target_label: ip
       - target_label: __address__
         replacement: 172.31.2.183:9115

# TCP端口检测
  - job_name: "blackbox_tcp_port_monitor"
    metrics_path: /probe
    params:
       module: [tcp_connect]
    static_configs:
       - targets: ["172.31.2.181:9100","www.s209.com:80"]
         labels:
            instance: port_status
            group: port
    relabel_configs:
       - source_labels: [__address__]
         target_label: __param_target
       - source_labels: [__param_target]
         target_label: ip
       - target_label: __address__
         replacement: 172.31.2.183:9115

# Pod容器监控
  - job_name: "prometheus-k8s-containers"
    static_configs:
            - targets: ["172.31.7.111:8080","172.31.8.112:8080","172.31.7.113:8080"]

 浙公网安备 33010602011771号