

windows环境下安装prometheus+grafana,监控tomcat、mysql、windows
prometheus+grafana安装步骤
-
安装prometheus
官网下载安装包https://prometheus.io/download/,下载并解压prometheus-2.24.0.windows-amd64.zip。默认端口为9090,可进行修改。 -
安装grafana
官网下载安装包https://grafana.com/grafana/download,下载后安装。默认端口是3000,可进行修改。
tomcat监控
- 下载jmx_exporter
https://github.com/prometheus/jmx_exporter 下载jar包:jmx_prometheus_javaagent-0.14.0.jar - 配置tomcat.yaml, 在github上有示例:
https://github.com/prometheus/jmx_exporter/tree/master/example_configs
---
lowercaseOutputLabelNames: true
lowercaseOutputName: true
rules:
- pattern: 'Catalina<type=GlobalRequestProcessor, name=\"(\w+-\w+)-(\d+)\"><>(\w+):'
  name: tomcat_$3_total
  labels:
    port: "$2"
    protocol: "$1"
  help: Tomcat global $3
  type: COUNTER
- pattern: 'Catalina<j2eeType=Servlet, WebModule=//([-a-zA-Z0-9+&@#/%?=~_|!:.,;]*[-a-zA-Z0-9+&@#/%=~_|]), name=([-a-zA-Z0-9+/$%~_-|!.]*), J2EEApplication=none, J2EEServer=none><>(requestCount|maxTime|processingTime|errorCount):'
  name: tomcat_servlet_$3_total
  labels:
    module: "$1"
    servlet: "$2"
  help: Tomcat servlet $3 total
  type: COUNTER
- pattern: 'Catalina<type=ThreadPool, name="(\w+-\w+)-(\d+)"><>(currentThreadCount|currentThreadsBusy|keepAliveCount|pollerThreadCount|connectionCount):'
  name: tomcat_threadpool_$3
  labels:
    port: "$2"
    protocol: "$1"
  help: Tomcat threadpool $3
  type: GAUGE
- pattern: 'Catalina<type=Manager, host=([-a-zA-Z0-9+&@#/%?=~_|!:.,;]*[-a-zA-Z0-9+&@#/%=~_|]), context=([-a-zA-Z0-9+/$%~_-|!.]*)><>(processingTime|sessionCounter|rejectedSessions|expiredSessions):'
  name: tomcat_session_$3_total
  labels:
    context: "$2"
    host: "$1"
  help: Tomcat session $3 total
  type: COUNTER
- 将jmx_prometheus_javaagent-0.14.0.jar和tomcat.yaml拷贝至需要被监控tomcat的bin目录下。
Java Options中增加参数:
-javaagent:D:\Program Files\Apache Software Foundation\Tomcat 7.0_Tomcat7-SPDPRE/bin/jmx_prometheus_javaagent-0.14.0.jar=30018:D:\Program Files\Apache Software Foundation\Tomcat 7.0_Tomcat7-SPDPRE/bin/tomcat.yaml
重启tomcat后浏览器打开http://ip:33018 可进行验证。 - 在prometheus根目录下添加tomcat.yml,文件内容:
  - targets:
  - 192.168.0.139:30018
  labels:
      instance: test_tomcat
      service: tomcat
- 修改prometheus根目录下的prometheus.yml文件,添加如下配置:
- job_name: 'java'
  file_sd_configs:
  - files: [D:\Program Files\prometheus-2.24.0.windows-amd64\tomcat.yml]
    refresh_interval: 15s
- 重启prometheus,进入grafana http://ip:3000
选择菜单:create->import
输入8563,点击load加载,再点击import完成导入。
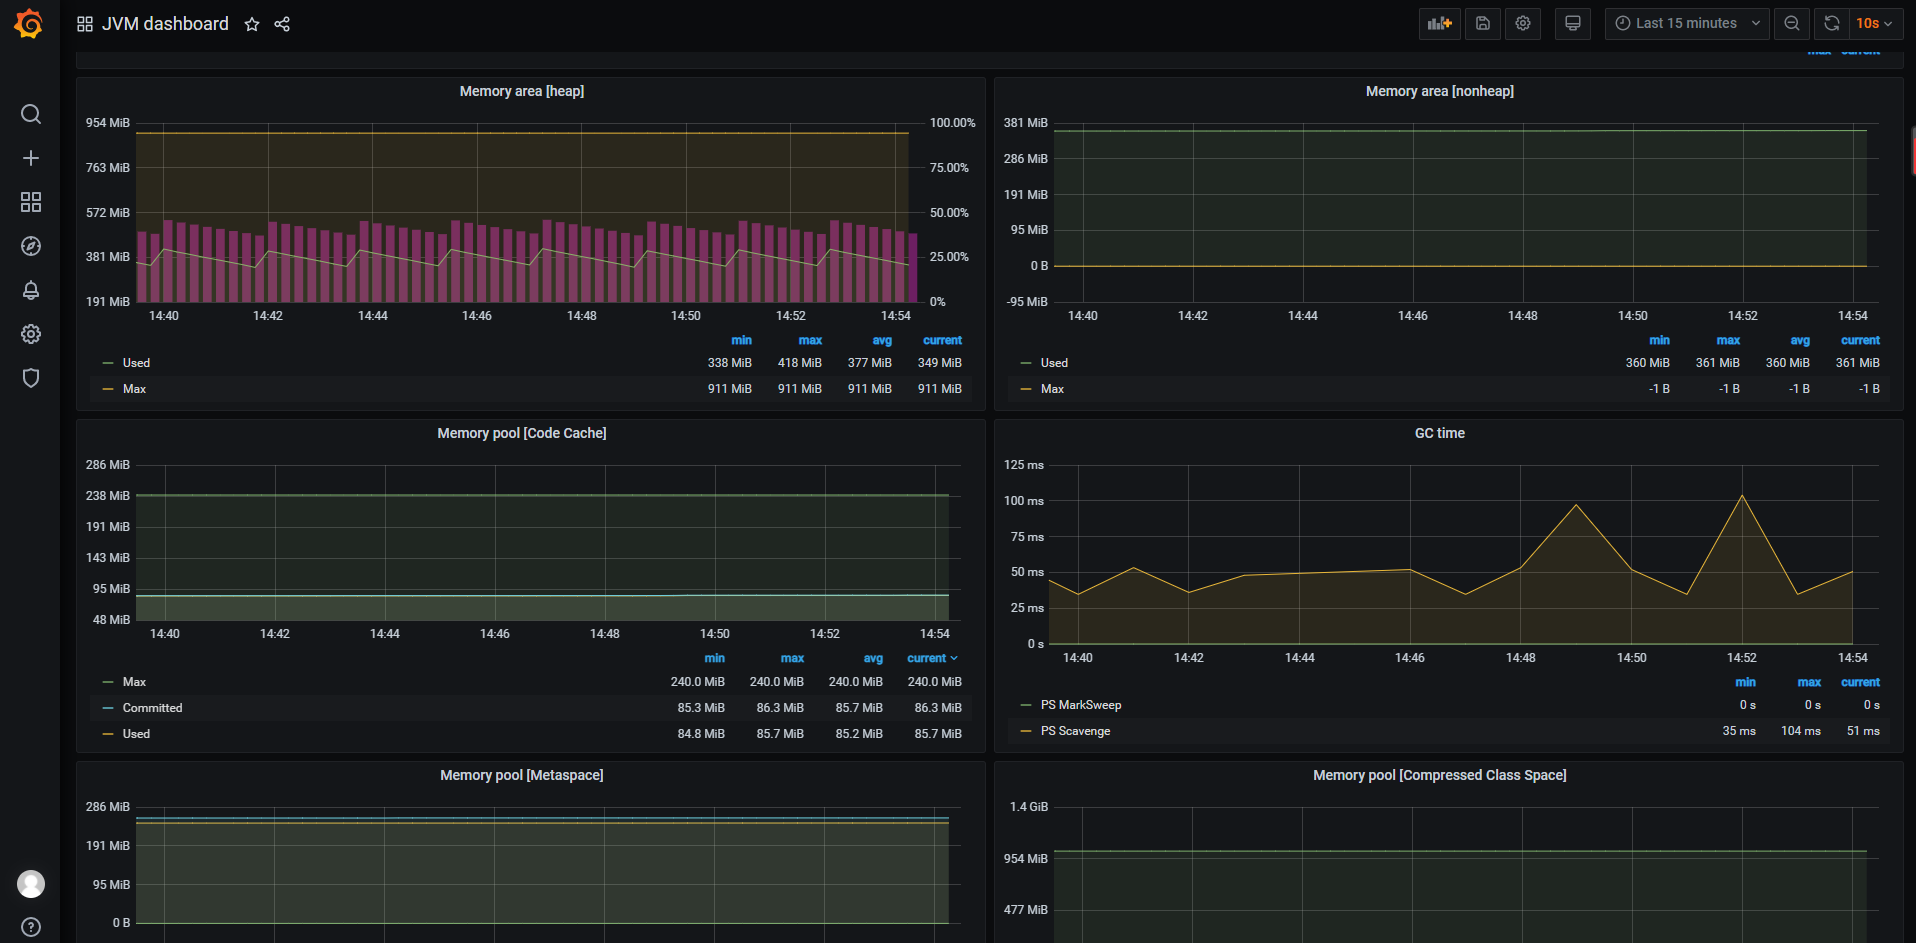
接下来就可以进入dashboard查看监控的界面了。
![]()
mysql监控
- 下载mysqld_exporter https://github.com/prometheus/mysqld_exporter/releases
(https://github.com/prometheus/mysqld_exporter/releases/download/v0.13.0-rc.0/mysqld_exporter-0.13.0-rc.0.windows-amd64.zip) - 在mysqld_exporter.exe同目录下添加.my.cnf文件,内容:
[client]
host=127.0.0.1        #mysql ip
port=3306
user=root                #账号
password=yourpassword    #密码
- 启动
cmd进入mysqld_exporter.exe目录下,运行:
mysqld_exporter.exe --config.my-cnf=.my.cnf - 验证
在浏览器打开:localhost:9104/metrics - 修改prometheus根目录下的prometheus.yml文件,添加如下配置:
  - job_name: 'Mysql'
    static_configs:
    - targets: ['192.168.0.xxx:9104']
windows监控
- 下载windows_exporter:
https://github.com/prometheus-community/windows_exporter/releases ,下载msi文件,完成安装后,会自动创建一个开机自启的服务。 - 验证
在浏览器打开:localhost:9182/metrics - 修改prometheus根目录下的prometheus.yml文件,添加如下配置:
  - job_name: 'Windows'
    static_configs:
    - targets: ['192.168.0.xxx:9182']
      labels:
        instance: Windows

 浙公网安备 33010602011771号