网站日志流量分析系统之数据清洗处理(离线分析)
网站日志流量分析系统之(日志收集)已将数据落地收集并落地至HDFS,根据网站日志流量分析系统中架构图,接下来要做的事情就是做离线分析,编写MR程序或通过手写HQL对HDFS中的数据进行清洗;由于清洗逻辑比较简单,这里我选择用Hive来对HDFS中的数据进行清洗(当然也可以用MR来清洗)。数据清洗处理过程相对较长,所以:Be patient,please!
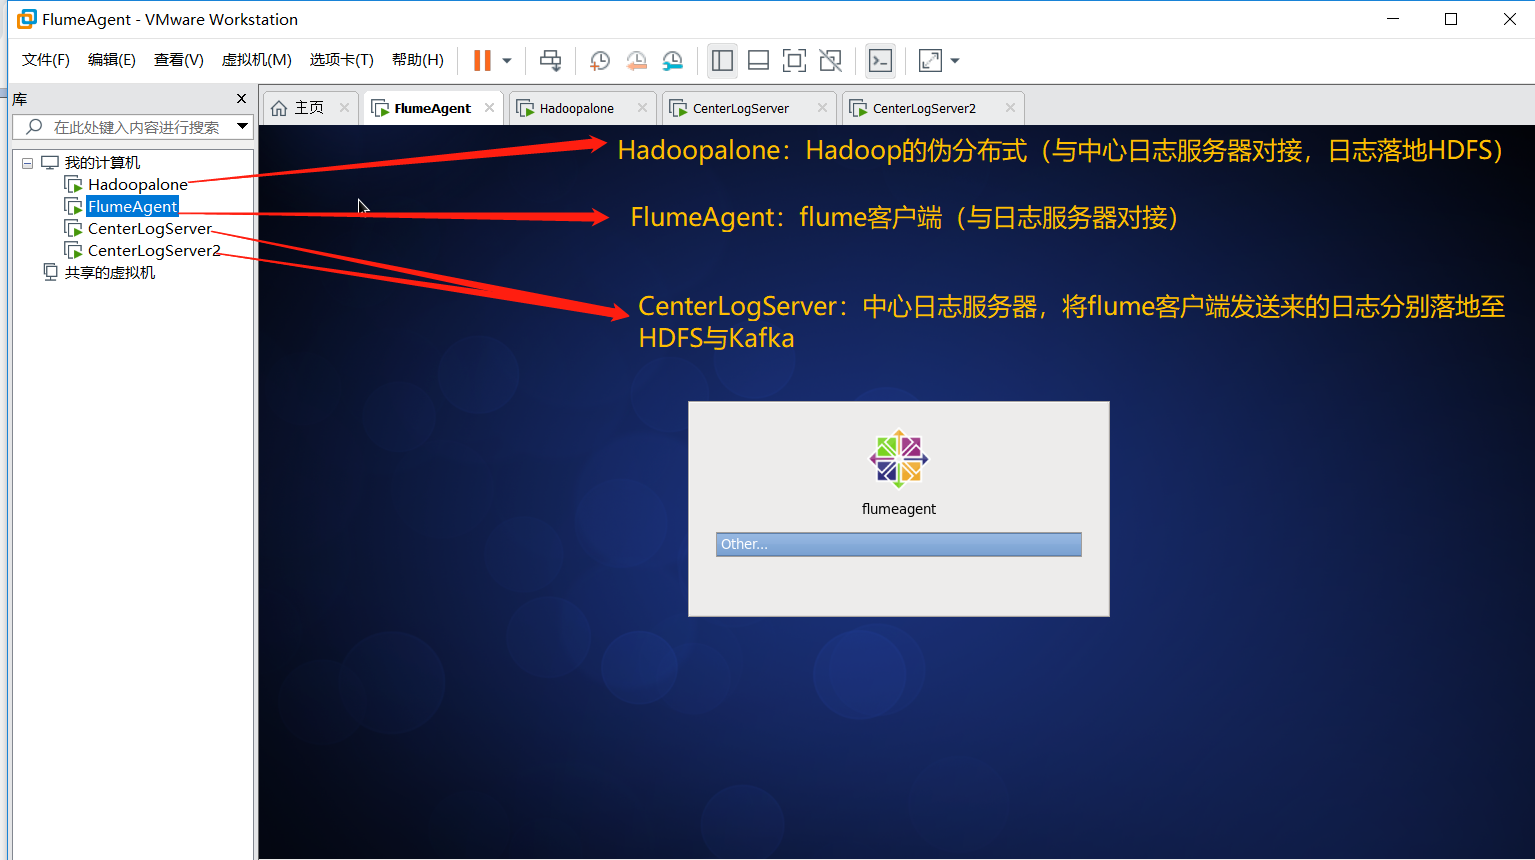
二、服务器规划
三、数据清洗
由于本次测试数据清洗逻辑较为简单,所以采用Hive来进行清洗(当然你也可以选择手写MR程序),下面操作是在hadoopalone主机操作(即安装有hadoop伪分布式)
(1)进入hive命令行模式,创建库logdb
hive> create database logdb;
(2)创建外部分区表管理数据(HDFS)
hive>use logdb;
hive> create external table logdemo
    > (url string,urlname string,title string,chset string,
    > scr string,col string,lg string,je string,ec string,
    > fv string,cn string,ref string,uagent string,
    > stat_uv string,stat_ss string,cip string)
    > partitioned by (reportTime string)  row format delimited fields
    > terminated by '|' location '/logdemo';
(3)增加今日分区
hive> alter table logdemo add partition(reportTime='2019-09-07') location '/logdemo/reportTime=2019-09-07'; //这里关联hdfs
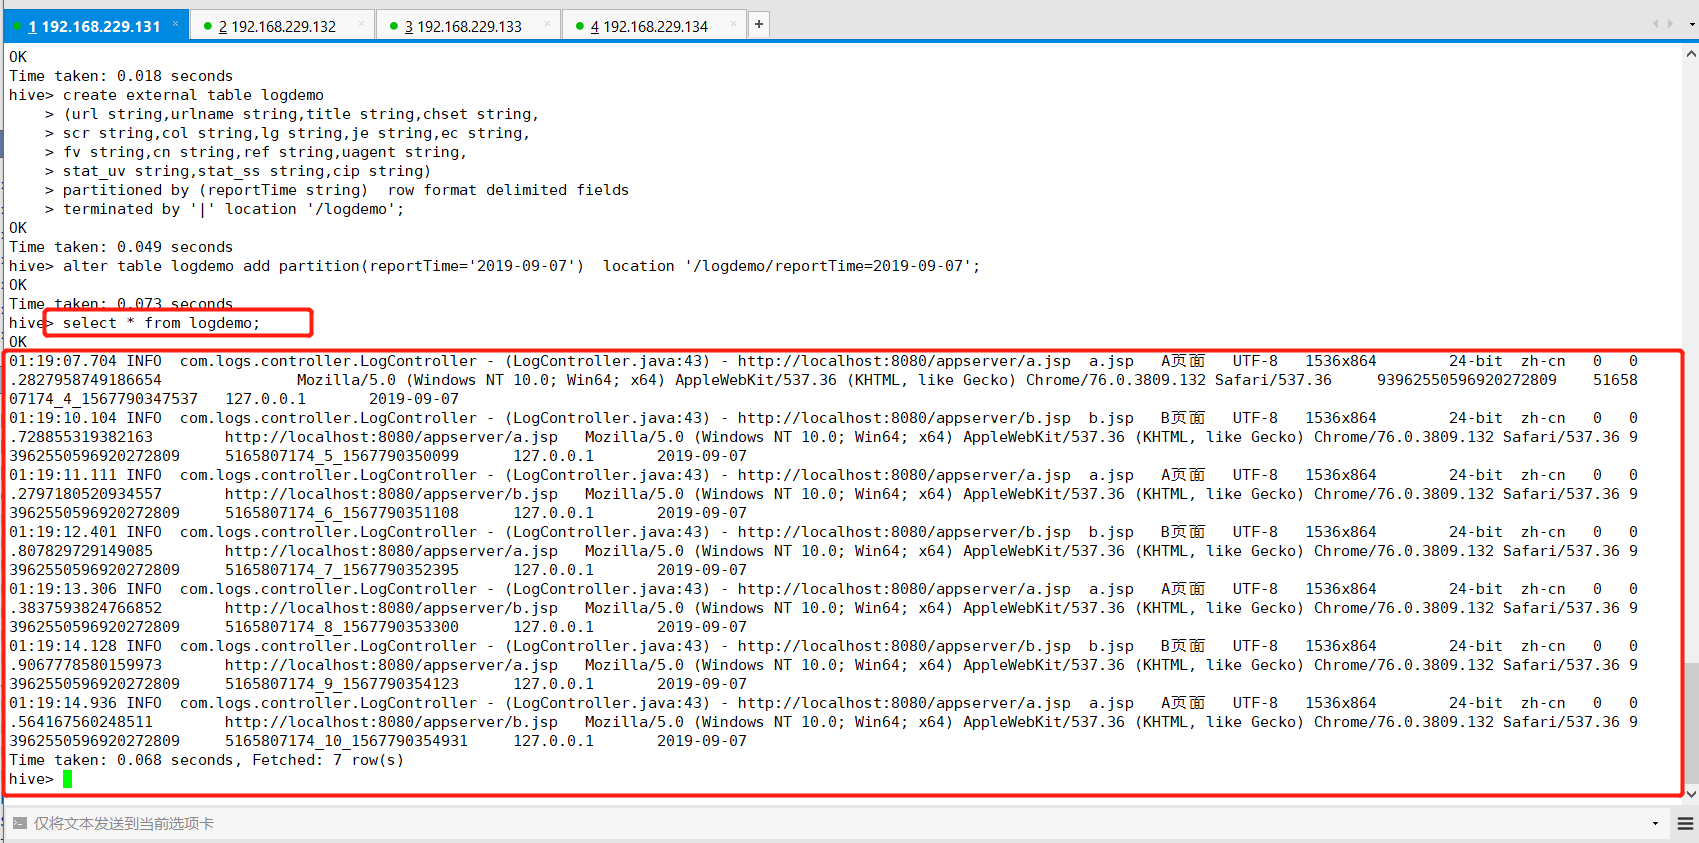
(4)查看数据
hive> select * from logdemo;
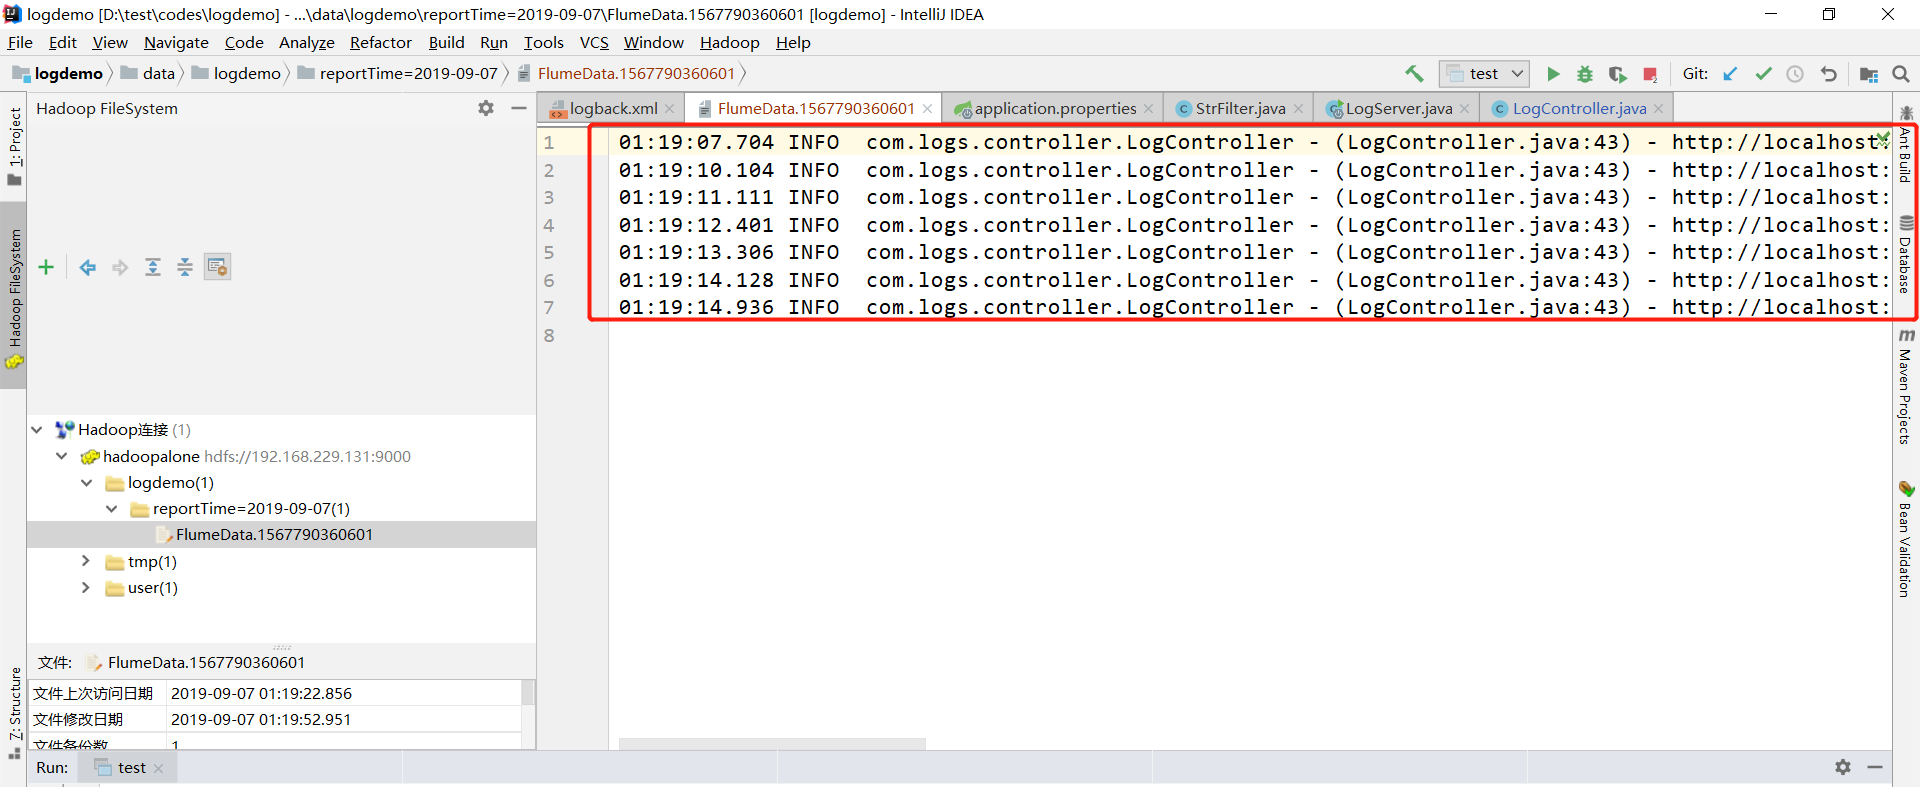
Hadoop中hdfs中的数据如下图:
(5)创建数据清洗表
hive> create table dataclear
    > (url string,urlname string,ref string,uagent string,
    > uvid string,ssid string,sscoutn string,sstime string,cip string)
    > partitioned by (reportTime string) row format delimited fields terminated by '|';
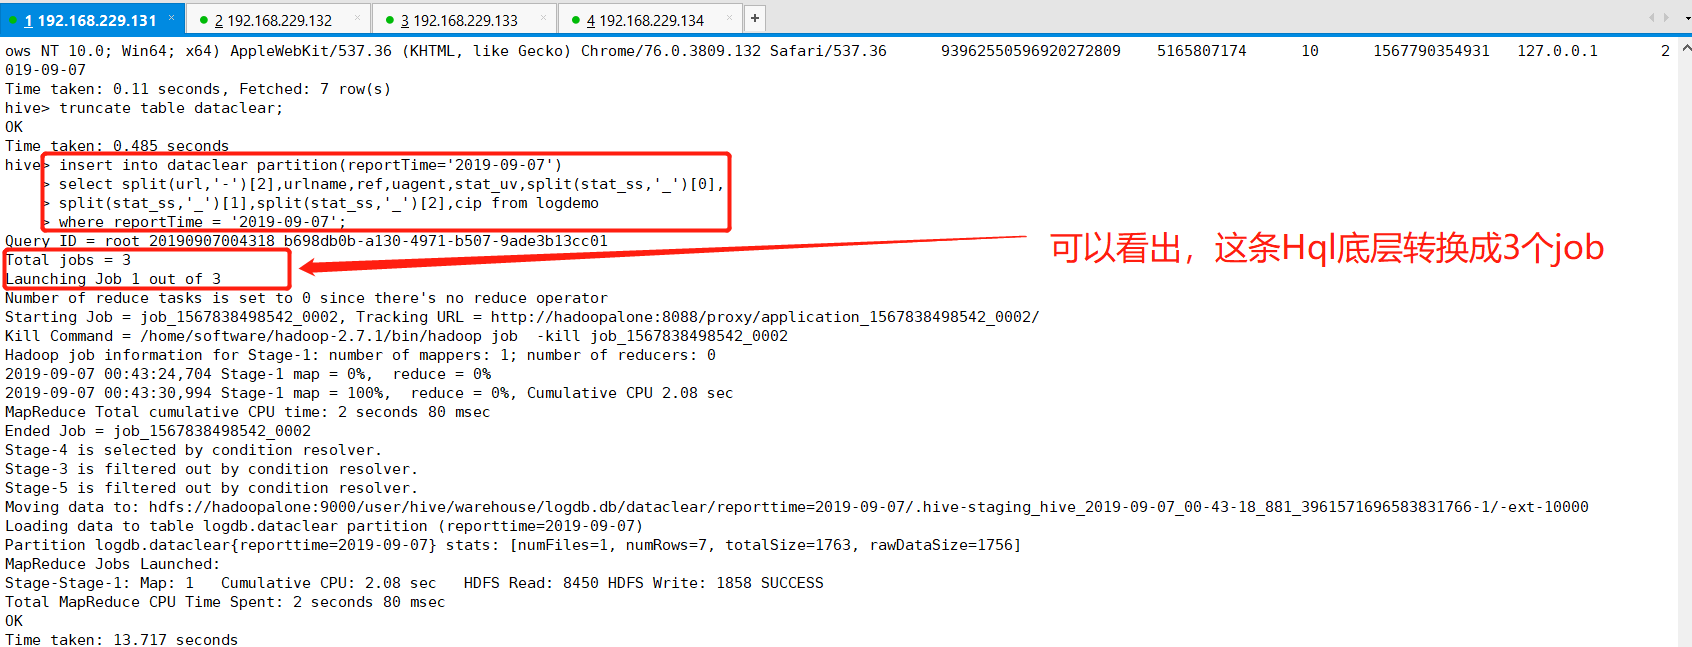
(6)将logdemo表中数据导入数据清洗表(dataclear)
hive> insert into dataclear partition(reportTime='2019-09-07')
    > select split(url,'-')[2],urlname,ref,uagent,stat_uv,split(stat_ss,'_')[0],
    > split(stat_ss,'_')[1],split(stat_ss,'_')[2],cip from logdemo
    > where reportTime = '2019-09-07';
(7)查看数据清洗表(dataclear)
hive> select * from dataclear;
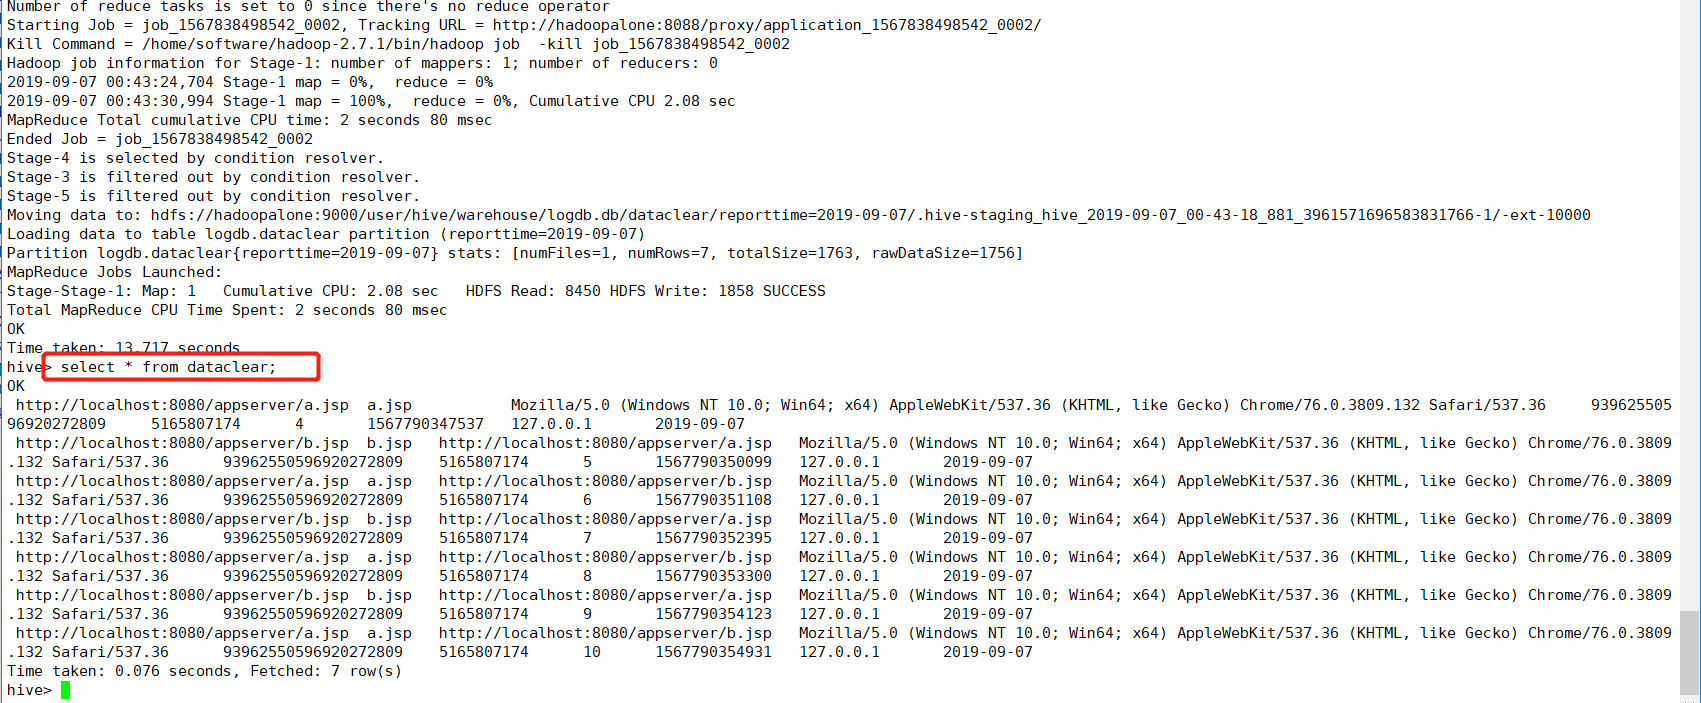
接下来就是计算相关的业务需求指标。
四、数据处理
利用Hive数据仓库工具实现业务指标的计算。
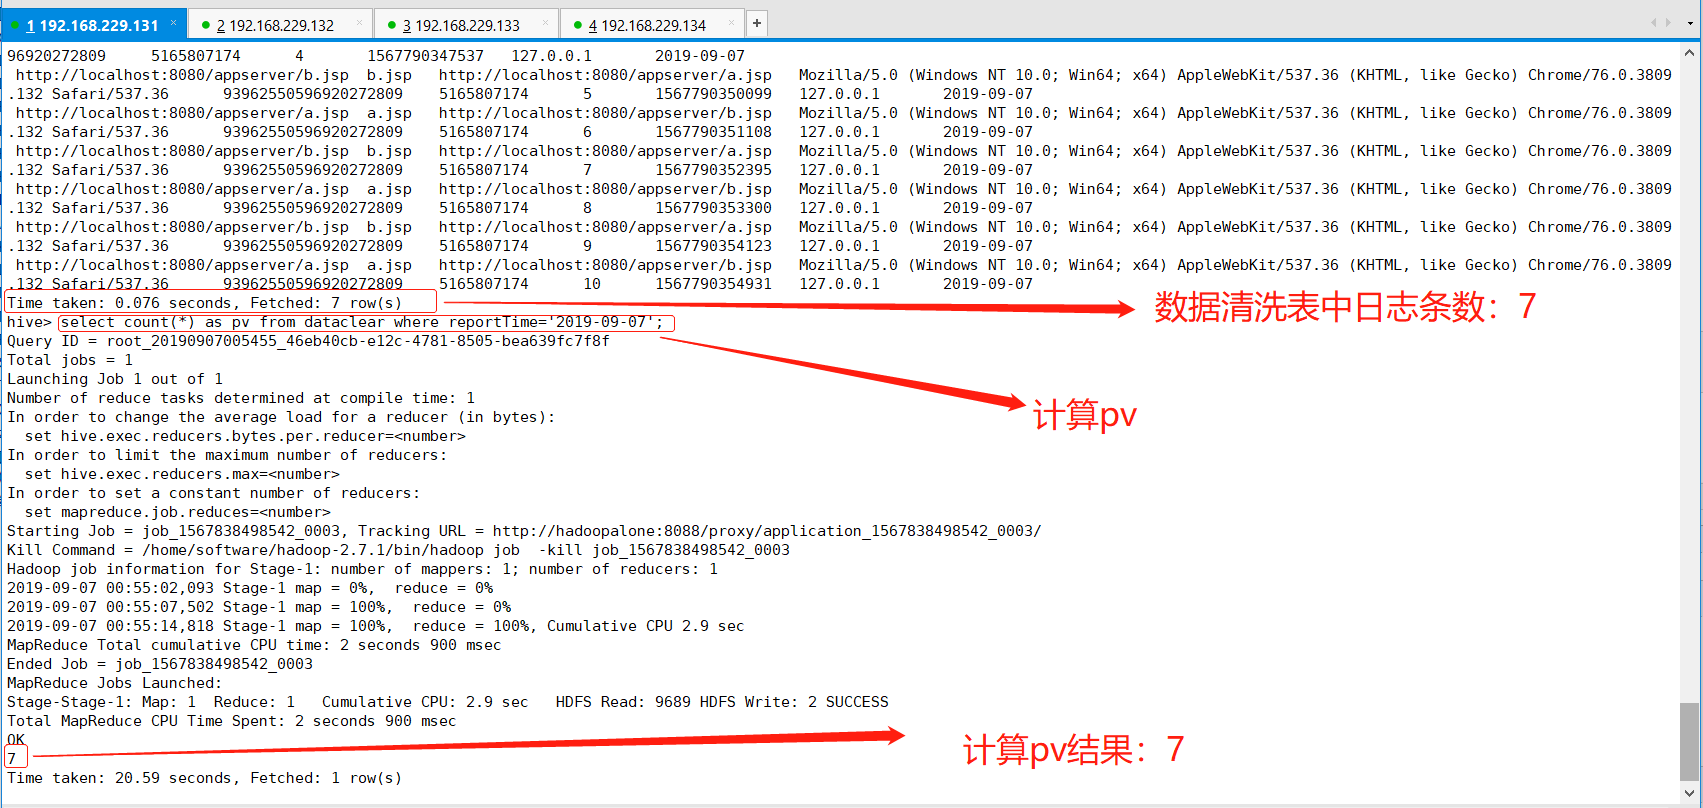
(1)pv(点击量)计算
pv:计算一天之内访问的数量,也就意味着一条日志代表一次点击量,Hql语句也就好写了,如下:
hive> select count(*) as pv from dataclear where reportTime='2019-09-07';
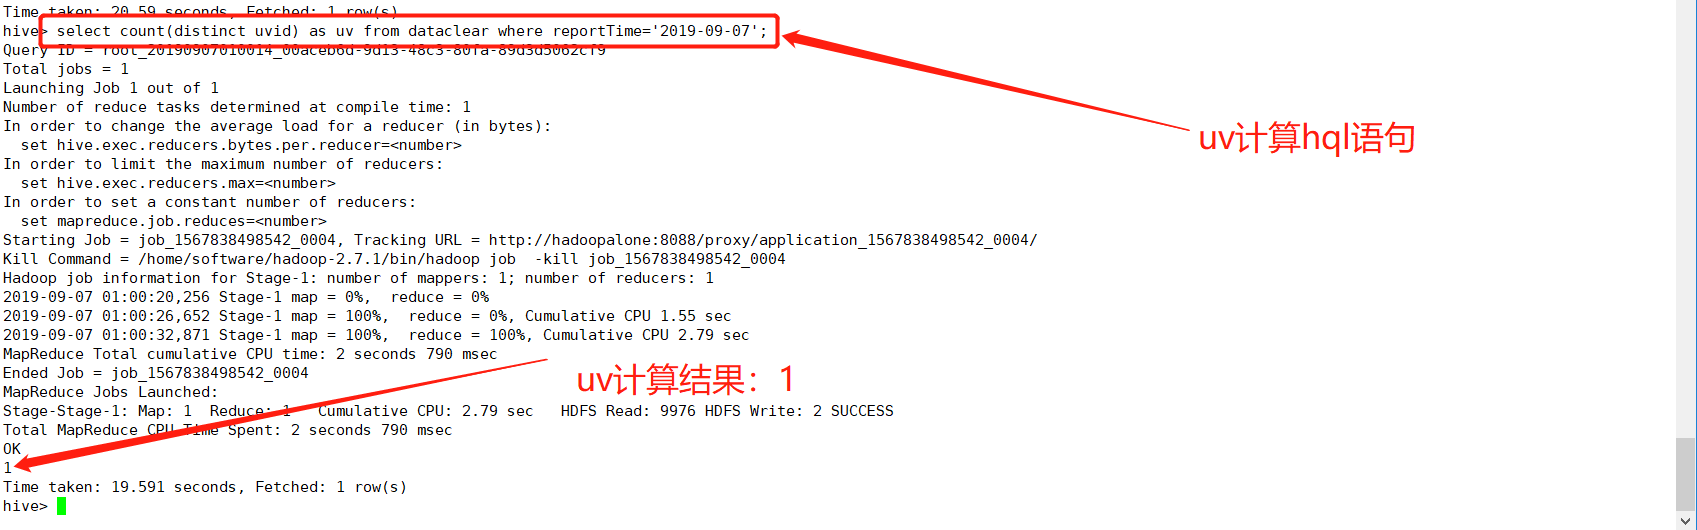
(2)uv(独立访客数)计算
uv:一天之内独立访客数量,同一个客户在一天之内多次访问只能记录一个uv,计算逻辑:当天日志uvid去重计算即可
hive> select count(distinct uvid) as uv from dataclear where reportTime='2019-09-07';
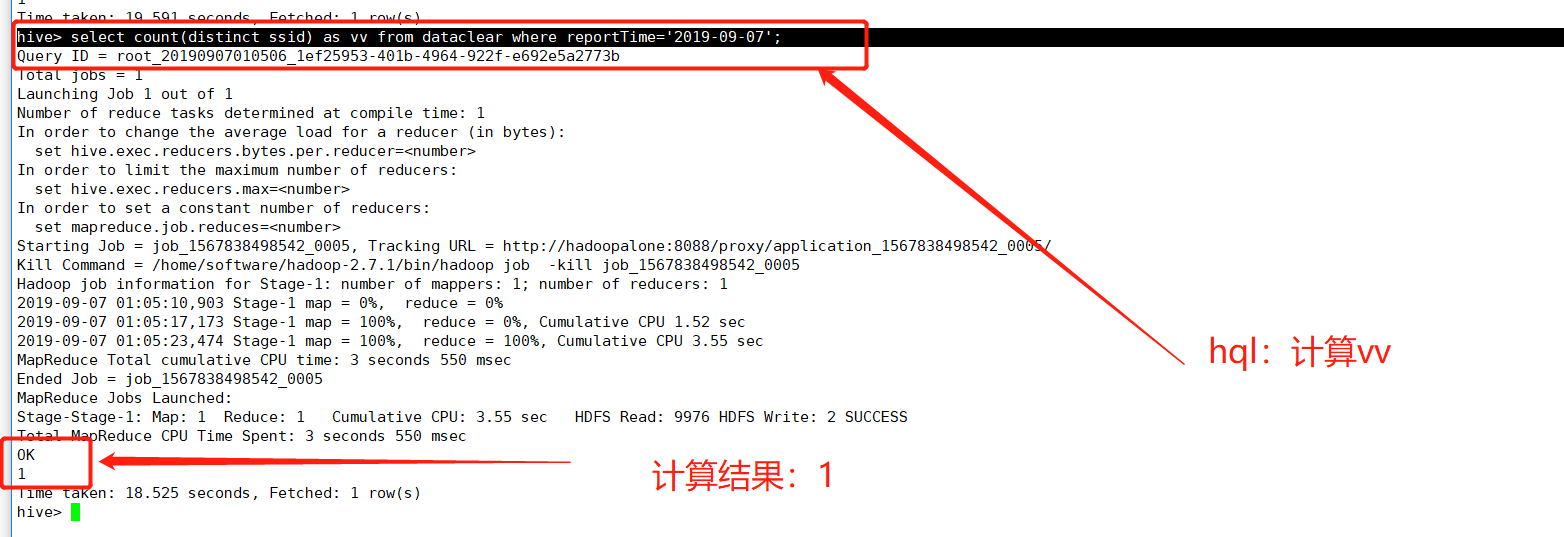
(3)vv(会话总数)计算
vv:会话总数,一天之内会话的总数量,计算逻辑:当天日志ssid去重计算即可
hive> select count(distinct ssid) as vv from dataclear where reportTime='2019-09-07';
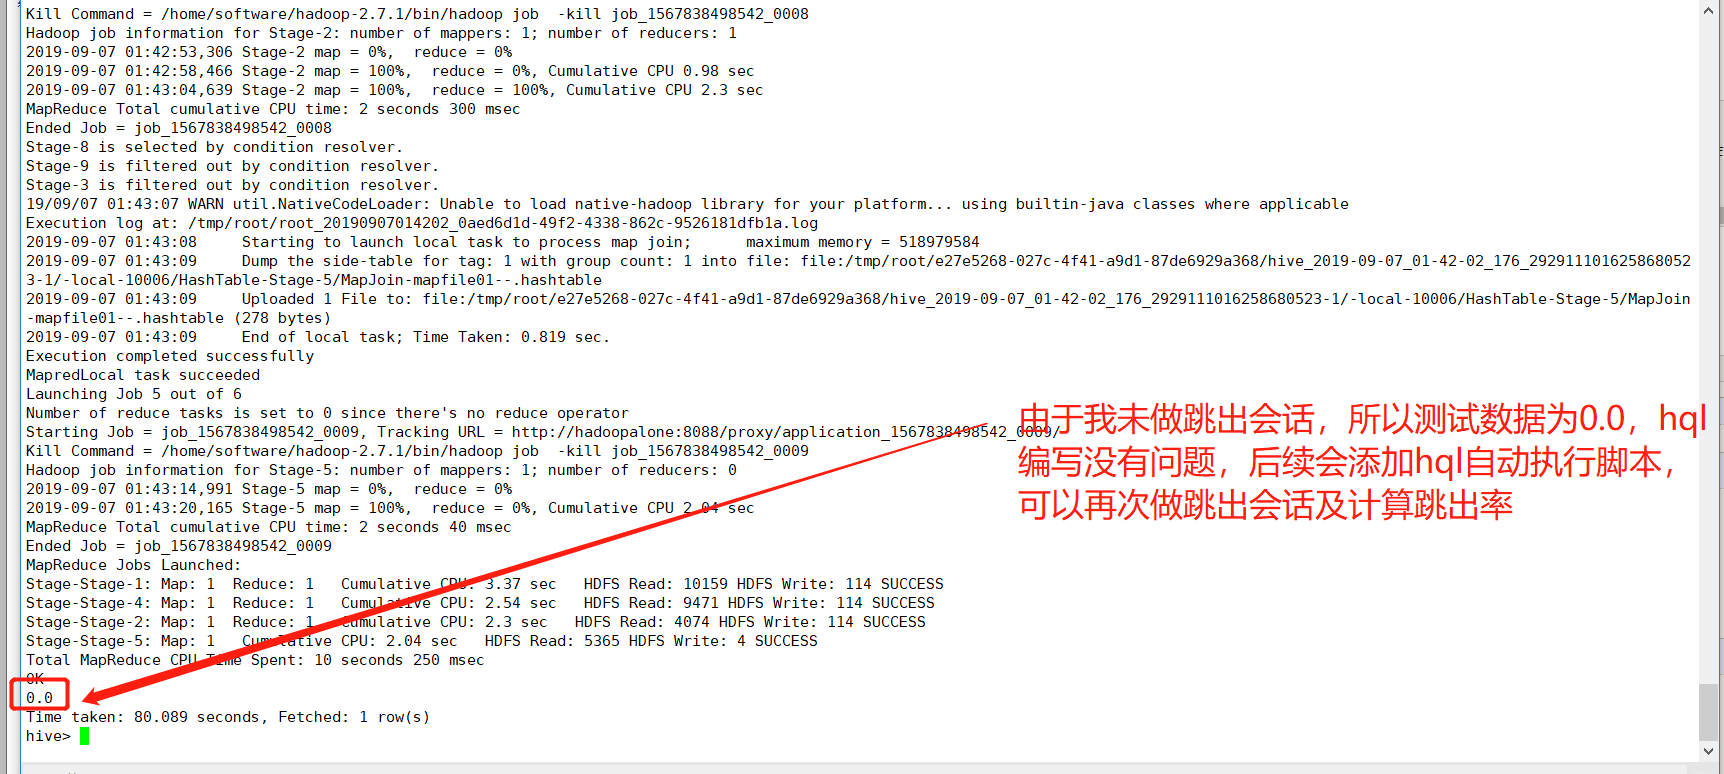
(4)br(跳出率)计算
br:跳出率,一天之内跳出的会话占总会话的比率。跳出会话:一个会话内只看过一个页面成为跳出会话。
总会话sql:select count(distinct ssid) as vv_count from dataclear where reportTime='2019-09-07'
跳出会话sql:select count(br_tab.ssid) as br_count from (select ssid from dataclear where reportTime='2019-09-07' group by ssid having count(*) = 1) as br_tab,HQL计算逻辑:跳出会话数/总会话数
hive> select round(br_left_tab.br_count / br_right_tab.vv_count,4) as br from
    > (select count(br_tab.ssid) as br_count from (select ssid from dataclear where reportTime='2019-09-07' group by ssid having count(*) = 1) as br_tab) as br_left_tab,
    > (select count(distinct ssid) as vv_count from dataclear where reportTime='2019-09-07') as br_right_tab;
(5)newip(新增ip)
newip:新增ip总数,计算逻辑:当天所有的ip去重后在历史数据中从未出现过的数量。
hive> select count(distinct dataclear.cip) as newip from dataclear
    > where dataclear.reportTime='2019-09-07'
    > and dataclear.cip not in
    > (select distinct inner_dataclear_tab.cip from dataclear as inner_dataclear_tab
    > where datediff('2019-09-07',inner_dataclear_tab.reportTime)>0)

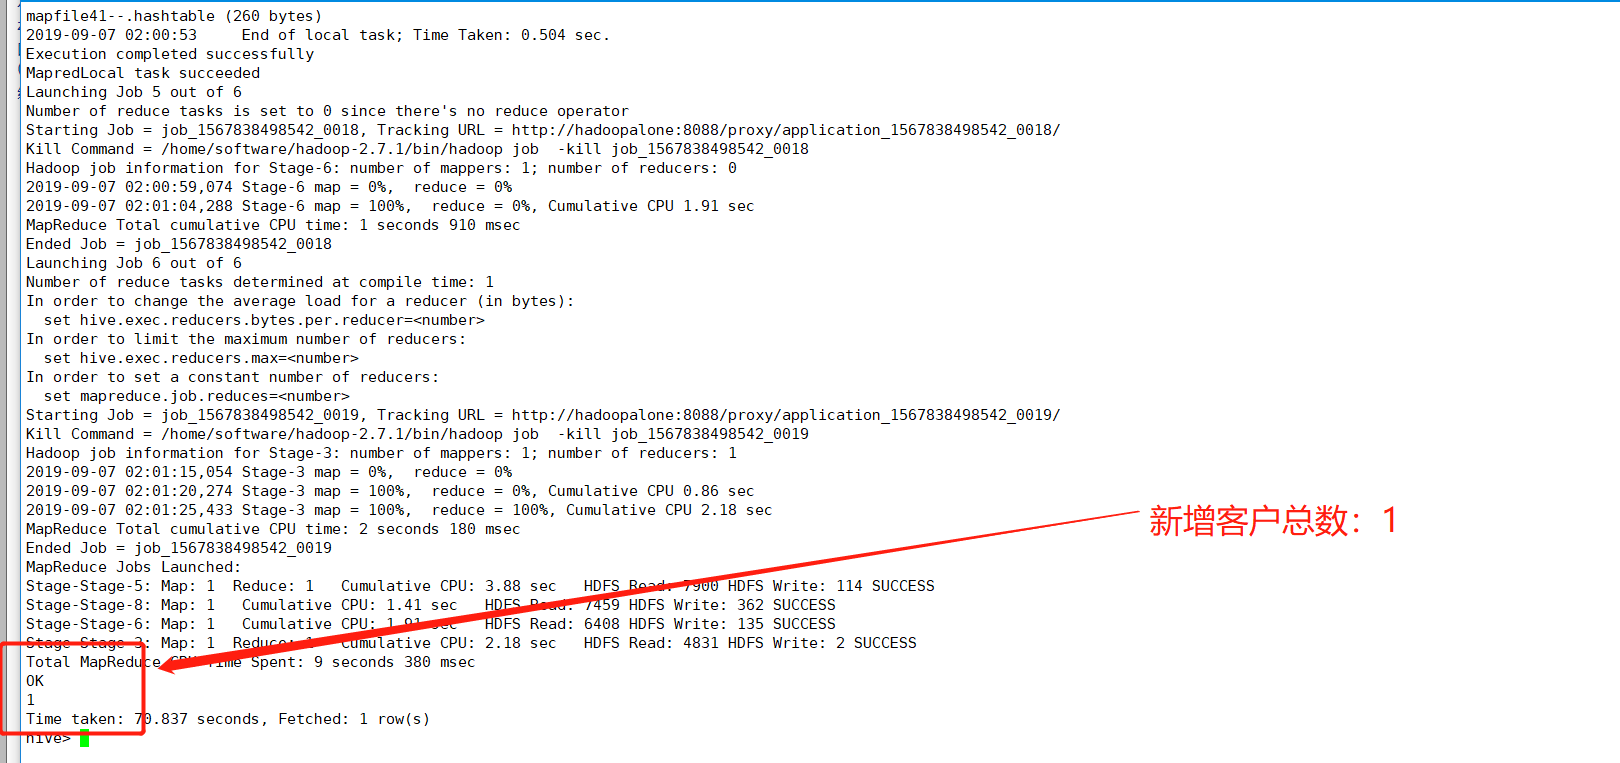
(6)newcust(新增客户总数)计算
newcust:新增客户总数,计算逻辑:今天所有uvid去重后在历史数据中从未出现过的数量
hive> select count(distinct dataclear.uvid) as newcust from dataclear
    > where dataclear.reportTime='2019-09-07'
    > and dataclear.uvid not in
    > (select inner_dataclear_tab.uvid from dataclear as inner_dataclear_tab
    > where datediff('2019-09-07',inner_dataclear_tab.reportTime)>0);
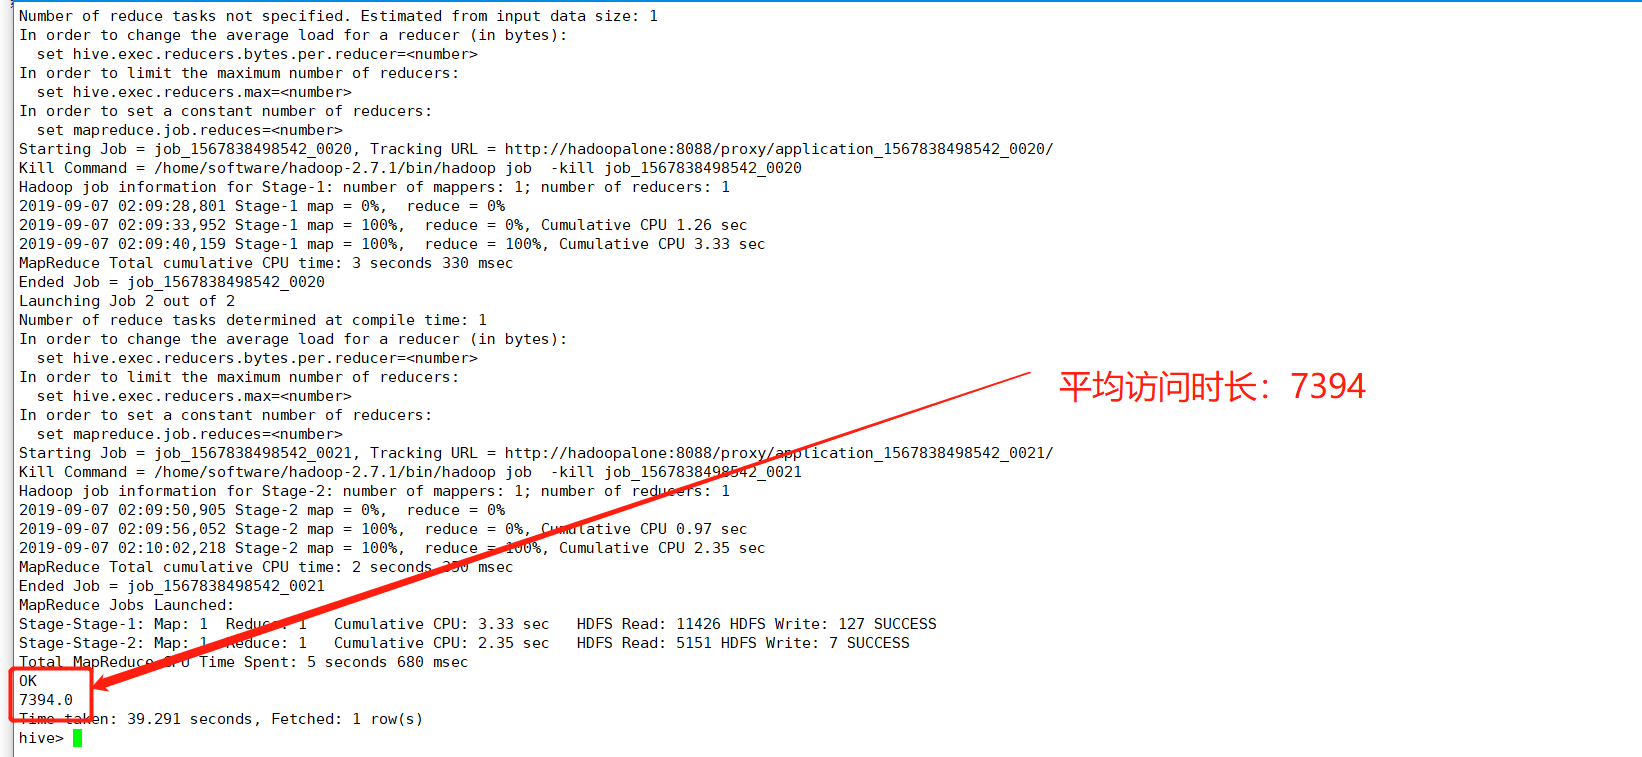
(7)avgtime(平均访问时长)
avgtime:平均访问时长,一天内所有会话的访问时长的平均值。一个会话的访问时长:这个会话最后一个页面的访问时间-第一个页面的访问时间
hive> select avg(avgtime_tab.use_time) as avgtime from
    > (select max(sstime) - min(sstime) as use_time from dataclear
    > where reportTime='2019-09-07' group by ssid) as avgtime_tab;
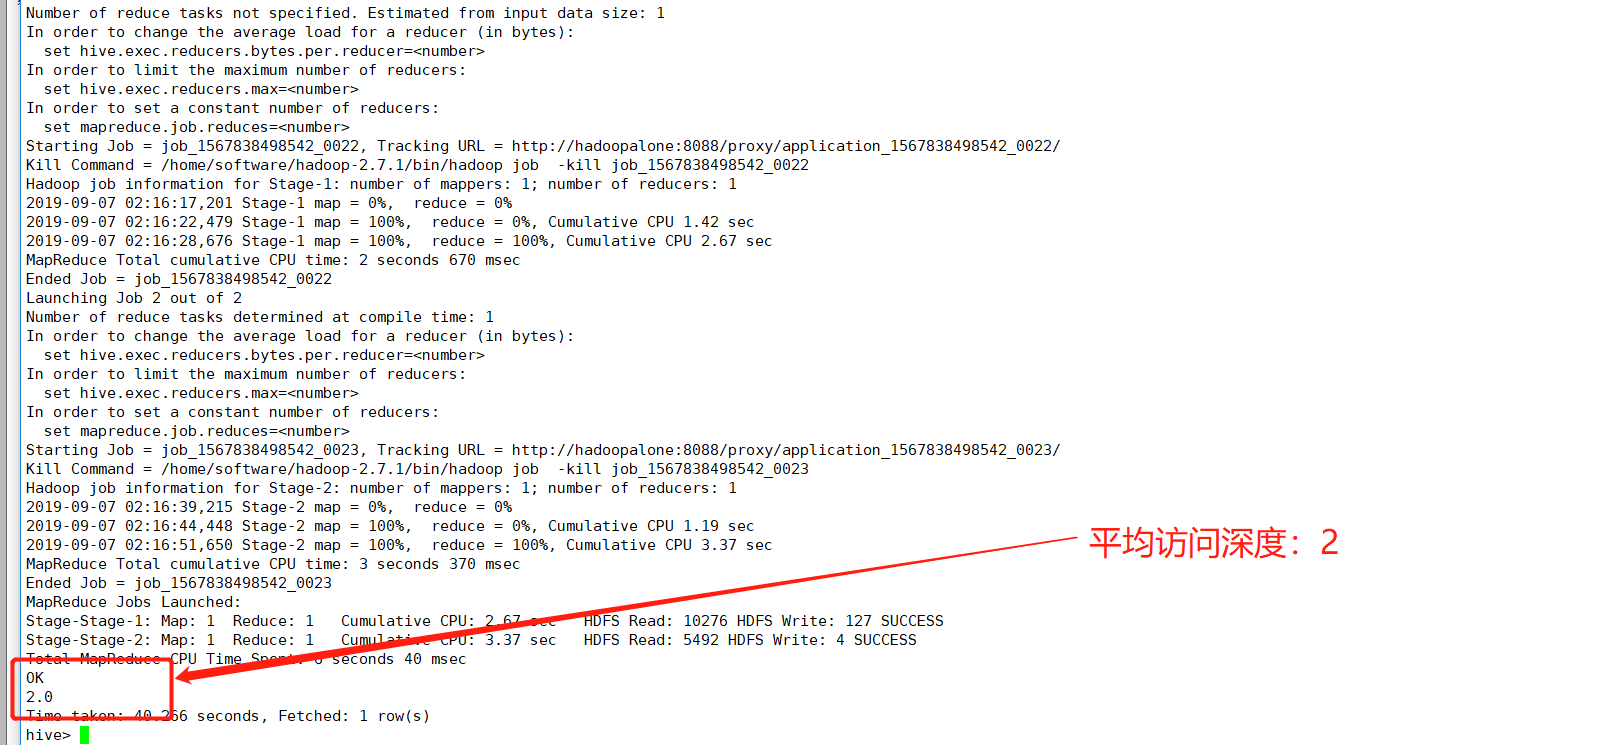
(8)avgdeep(平均访问深度)计算
avgdeep:一天内所有会话访问深度的平均值。一个会话的访问深度指的是所有地址去重后计数
hive> select round(avg(avgdeep_tab.deep),4) as avgdeep from (select count(distinct urlname) as deep from dataclear where
    > reportTime='2019-10-09' group by ssid) as avgdeep_tab;
五、业务指标计算结果写入目标表
我们的目标是将计算的8个指标(pv,uv,vv,br,newip,newcust,avgtim,avgdeep)写入目标表(tongji1表),这里有两套方案如下可以选择:
方案一:将每个指标的计算hql当成一个表来处理,也就是这个8个表做笛卡儿积查询,将结果写入tongji1表,大概hql模样如下:
insert into tongji1
select  '2019-09-07',tab1.pv,tab2.uv,tab3.vv,tab4.br,tab5.newip,tab6.newcust,tab7.avgtime,tab8.avgdeep from
(select count(*) as pv from dataclear where reportTime='2019-09-07') as tab1,
(select count(distinct uvid) as uv from dataclear where reportTime='2019-09-07') as tab2,
(select count(distinct ssid) as vv from dataclear where reportTime='2019-09-07') as tab3,
(select round(br_left_tab.br_count / br_right_tab.vv_count,4) as br from
(select count(br_tab.ssid) as br_count from (select ssid from dataclear
where reportTime='2019-09-07' group by ssid having count(*) = 1) as br_tab) as br_left_tab,
(select count(distinct ssid) as vv_count from dataclear where reportTime='2019-09-07') as br_right_tab) as tab4,
(select count(distinct dataclear.cip) as newip from dataclear
where dataclear.reportTime='2019-09-07' and dataclear.cip not in
(select distinct inner_dataclear_tab.cip from dataclear as inner_dataclear_tab
where datediff('2019-09-07',inner_dataclear_tab.reportTime)>0)) as tab5,
(select count(distinct dataclear.uvid) as newcust from dataclear
where dataclear.reportTime='2019-09-07' and dataclear.uvid not in
(select inner_dataclear_tab.uvid from dataclear as inner_dataclear_tab
where datediff('2019-09-07',inner_dataclear_tab.reportTime)>0)) as tab6,
(select avg(avgtime_tab.use_time) as avgtime from (select max(sstime) - min(sstime) as use_time from dataclear
where reportTime='2019-09-07' group by ssid) as avgtime_tab) as tab7,
(select round(avg(avgdeep_tab.deep),4) as avgdeep from
(select count(distinct url) as deep from dataclear
where reportTime='2019-09-07' group by ssid) as avgdeep_tab) as tab8;
这种方式通过连接查询,将多个查询结果插入一张tongji1表,虽然实现了效果,但是过多的表连接效率低下,且任何一个MR程序出错,整个程序都要重新计算,可靠性比较低。所以采用以下第二种方案。
方案二:借助中间临时表过渡,存储中间数据,最终将数据写入目标表(tongji1表),实现如下:
(1)创建统计表(tongji1)
hive> create table tongji1 (reportTime string,pv int,uv int,vv int,br double,newip int,newcust int,avgtime double,avgdeep double) row format delimited fields terminated by '|';
(2)创建中间表(tongji1_temp)
hive> create table tongji1_temp (reportTime string,field string,value double) row format delimited fields terminated by '|';
(3)依次将各个业务指标写入中间表(tongji1_temp)
hive> insert into tongji1_temp select '2019-09-07','pv',t1.pv from (select count(*) as pv from dataclear where reportTime='2019-09-07') as t1;
hive> insert into tongji1_temp select '2019-09-07','uv',t2.uv from (select count(distinct uvid) as uv from dataclear where reportTime='2019-09-07') as t2;
hive> insert into tongji1_temp select '2019-09-07','vv',t3.vv from (select count(distinct ssid) as vv from dataclear where reportTime='2019-09-07') as t3;
hive> insert into tongji1_temp select '2019-09-07','br',t4.br from (select round(br_left_tab.br_count / br_right_tab.vv_count,4) as br from (select count(br_tab.ssid) as br_count from (select ssid from dataclear where reportTime='2019-09-07' group by ssid having count(*) = 1) as br_tab) as br_left_tab, (select count(distinct ssid) as vv_count from dataclear where reportTime='2019-09-07') as br_right_tab) as t4;
hive> insert into tongji1_temp select '2019-09-07','newip',t5.newip from (select count(distinct dataclear.cip) as newip from dataclear where dataclear.reportTime='2019-09-07' and dataclear.cip not in (select distinct inner_dataclear_tab.cip from dataclear as inner_dataclear_tab where datediff('2019-09-07',inner_dataclear_tab.reportTime)>0)) as t5;
hive> insert into tongji1_temp select '2019-09-07','newcust',t6.newcust from (select count(distinct dataclear.uvid) as newcust from dataclear where dataclear.reportTime='2019-09-07' and dataclear.uvid not in (select inner_dataclear_tab.uvid from dataclear as inner_dataclear_tab where datediff('2019-09-07',inner_dataclear_tab.reportTime)>0)) as t6;
hive> insert into tongji1_temp select '2019-09-07','avgtime',t7.avgtime from (select avg(avgtime_tab.use_time) as avgtime from (select max(sstime) - min(sstime) as use_time from dataclear where reportTime='2019-09-07' group by ssid) as avgtime_tab) as t7;
hive> insert into tongji1_temp select '2019-09-07','avgdeep',t8.avgdeep from (select round(avg(avgdeep_tab.deep),4) as avgdeep from (select count(distinct url) as deep from dataclear where reportTime='2019-09-07' group by ssid) as avgdeep_tab) as t8;
(4)将中间表数据(tongji1_temp)数据导入最终目标表(tongji1表)


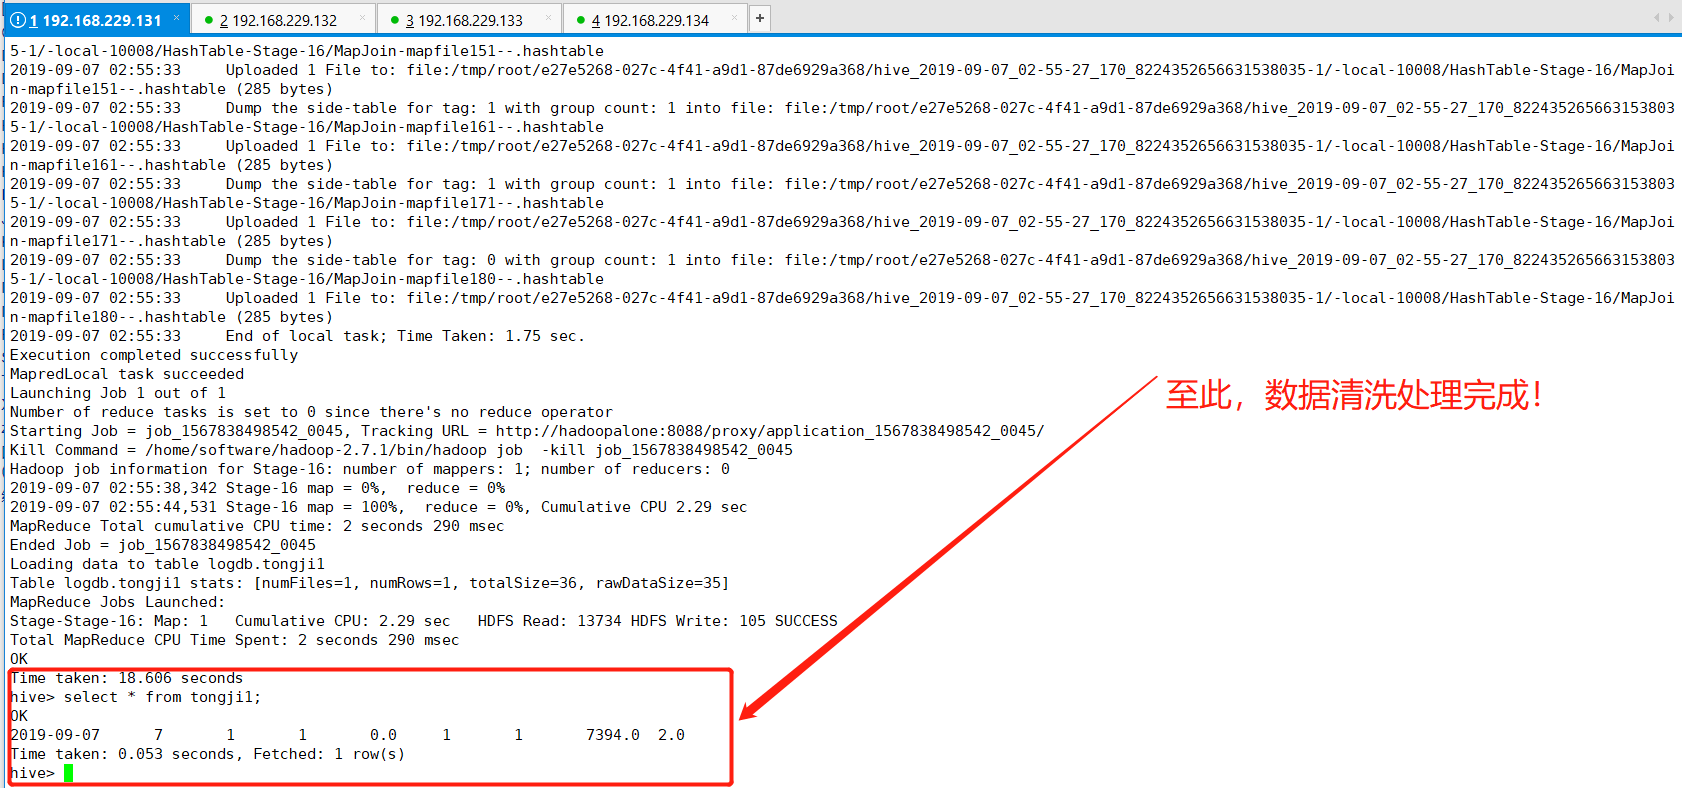
hive> insert into tongji1 select '2019-09-07',t1.pv,t2.uv,t3.vv,t4.br,t5.newip, t6.newcust, t7.avgtime, t8.avgdeep from
    > (select value as pv from tongji1_temp where field='pv' and reportTime='2019-09-07') as t1,
    > (select value as uv from tongji1_temp where field='uv' and reportTime='2019-09-07') as t2,
    > (select value as vv from tongji1_temp where field='vv' and reportTime='2019-09-07') as t3,
    > (select value as br from tongji1_temp where field='br' and reportTime='2019-09-07') as t4,
    > (select value as newip from tongji1_temp where field='newip' and reportTime='2019-09-07') as t5,
    > (select value as newcust from tongji1_temp where field='newcust' and reportTime='2019-09-07') as t6,
    > (select value as avgtime from tongji1_temp where field='avgtime' and reportTime='2019-09-07') as t7,
    > (select value as avgdeep from tongji1_temp where field='avgdeep' and reportTime='2019-09-07') as t8;
(5)查看目标表(tongji1)
hive> select * from tongji1
(6)方案总结
采用第二种方案,分别计算各个业务指标,借助中间表存放中间临时数据,再从临时表向tongji1表导入数据,降低了sql的复杂度,提升效率,此外任何一个hql语句出错,只需重新跑一遍该hql语句,无需重跑整个程序。但是这种方案也有一些缺点,比如浪费空间等。
当然,还有第三种方案,比如利用Hive的事务表,这里由于鄙人能力有限,未作了解。
六、通过Sqoop工具将数据清洗处理结果写入MySQL
(1)在mysql数据库中创建数据库logdb,表名tongji1,关键sql如下:
create database logdb;
use logdb;
create table tongji1(
        reportTime date,
        pv int,
        uv int,
        vv int,
        br double,
        newip int,
        newcust int,
        avgtime double,
        avgdeep double
);
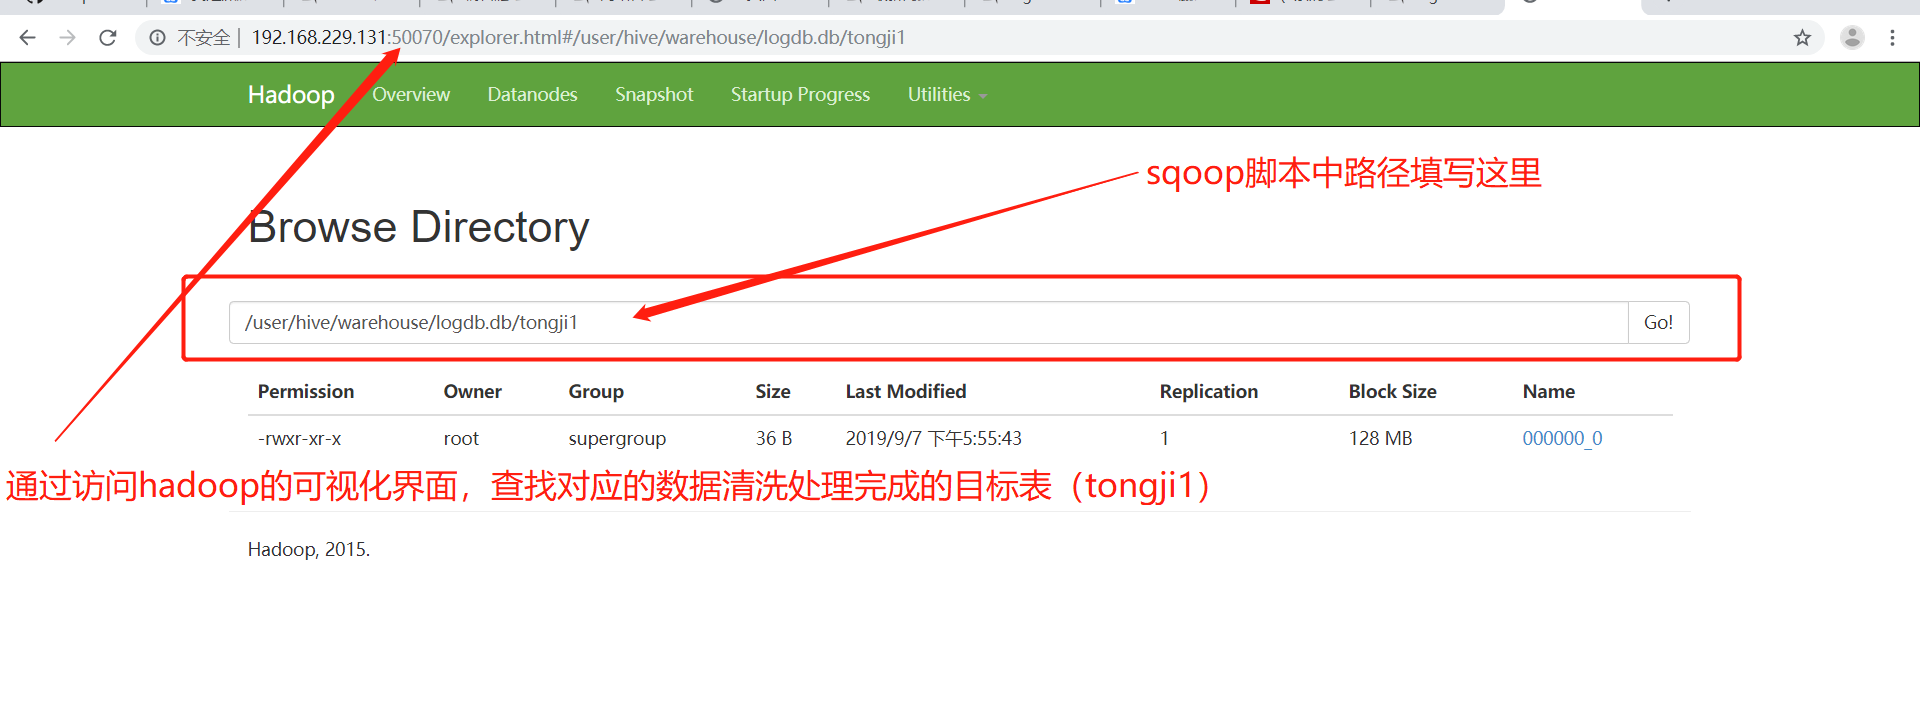
(2)进入sqoop的bin目录执行以下操作(参考sqoop的安装和基本命令使用)
[root@hadoopalone bin]# ./sqoop export --connect jdbc:mysql://hadoopalone:3306/logdb --username root --password root --export-dir '/user/hive/warehouse/logdb.db/tongji1' --table tongji1 -m 1 --fields-terminated-by '|'
注:如果提示没有mysql的驱动包,则上传一份mysql-connector-java-5.1.38-bin.jar至对应sqoop的lib目录下重新运行该脚本即可。
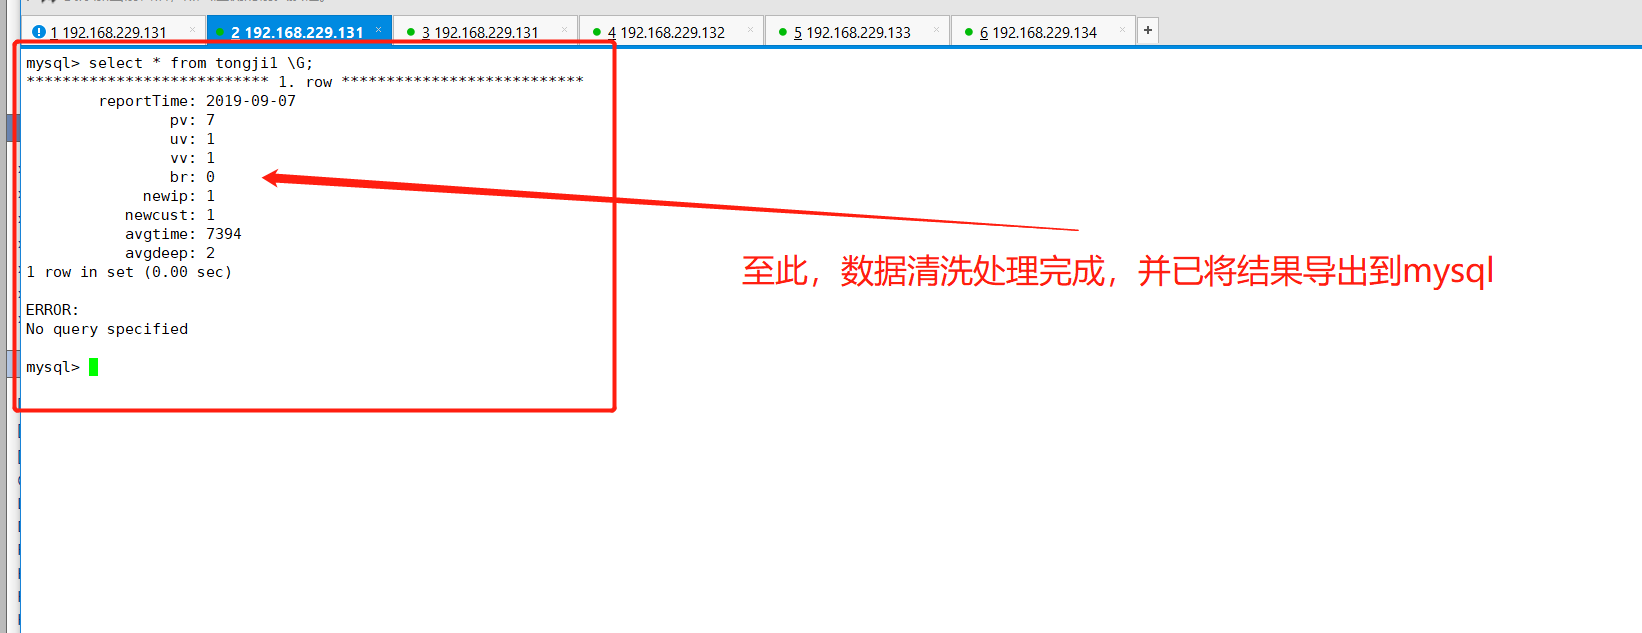
(3)查看mysql中tongji1表的数据
七、总结
至此,我们已经完成了离线分析中的数据清洗处理,并将结果通过sqoop导出至MySQL中,通过此案例方知:数据提取、清洗、处理(ETL)是大数据处理中一个非常重要的阶段,由该博文的篇章可以看出来,感谢大家能看到结束。下面就是对离线分析处理的结果进行可视化展示:网站日志流量分析系统之数据可视化展示
不知道大家有没有发现,在整篇文章中,我写到的日期都是写死的,也就是reportTime='2019-09-07',但是在实际开发中,肯定不会写的,让程序自动执行的,所以由此就会有Hql的自动化执行脚本,博主已经写好相关博文,网站日志流量分析系统之离线分析(自动化脚本),希望大家可以和我一起讨论!谢谢

 浙公网安备 33010602011771号