

jsMind使用踩坑记录与个人总结(vue2+elementui)
首先是安装包,目前版本是0.8.7
npm install jsmind
注意,如果你也是vue2,那直接引入的时候可能会失败。
import 'jsmind/style/jsmind.css' //样式
import jsMind from 'jsmind' //这个是正常引入
//import jsMind from 'jsmind/js-legacy/jsmind.js'  //引入失败的话可以试试这个,不过该方式下引入将无法使用新版选项更改样式或渲染方式之类的
如果要正常引入,则需要在vue.config.js中添加如下代码
module.exports = {
  transpileDependencies: ['jsmind'],
  ……
如果是vue3,则不会有问题。
接下来是使用,具体选项配置可查看官网文档get-started | zh | docs | jsMind
主要是几个坑:
1、绘图必须要存在实体才能进行,因此若是要用弹窗等形式展示的话,最好确保包裹的父元素出现了再进行初始化
1     handleClick(){
2       this.dialogVisbile = true //弹窗显示
3       this.jsMindLoading = true //加载
4       this.$nextTick(()=>{
5         this.jsChart = new jsMind(this.jsoptions) //初始化jsmind实例
6         this.jsChart.show(this.mind) //加载数据,渲染节点
7       })
8     },
2、jsmind不提供自带的销毁api,因此如果是在弹窗之类的进行渲染的话,再次点开会导致上一次的图还保留着,同时再次重复渲染一次(即使元素id理论上来说不能重复),所以需要手动销毁
1     handleClose() {
2       if (this.jsChart) delete this.jsChart //删除实例对象
3       const container = document.getElementById('jsmind_container')
4       while (container.firstChild) container.removeChild(container.firstChild) //获取父容器,并循环删除其下节点,如果加了el-loading的遮罩层,也可一并删除
5       this.mind.data.children = [] //这里是子节点的数据,可以在请求接口时清空,或者此时清空
6       this.dialogVisible = false
7     },
3、可以支持自定义绘制连线与节点(此处是在vue文件的script内)连线可用canvas或svg绘制,canvas方式返回的是canvas上下文,可直接调用方法进行绘制;而svg返回的是"path"这个dom对象,绘制时需要添加属性:
 1 export default {
 2   data() {
 3     const printArrow = ({ ctx, start_point, end_point }, str) =>{
 4             //获取根节点高度与宽度,因为实际终点是在根节点的中心位置,因此需要重新计算其连线的边界y值与x值。这里的nodeid就是根节点的id,也就是数据集mind.data.id
 5             let height = document.querySelector(`[nodeid=${str}]`).offsetHeight
 6             let width = document.querySelector(`[nodeid=${str}]`).offsetWidth
 7             console.log('height', height)
 8             //起点始终是子节点,终点始终是父节点,因此基础路径一致,只是箭头方向需要变化
 9             //左边的选项
10             if(start_point.x < end_point.x){
11             //左边——上边的选项
12               if(start_point.y < end_point.y){
13                 ctx.setAttribute('d', `M${start_point.x},${start_point.y}
14                 L${(start_point.x + end_point.x) / 2},${start_point.y}
15                 L${(start_point.x + end_point.x) / 2},${end_point.y - height / 2 - 4 }
16                 L${(start_point.x + end_point.x) / 2 - 3},${end_point.y - height / 2 - 4 }
17                 L${(start_point.x + end_point.x) / 2},${end_point.y - height / 2 }
18                 L${(start_point.x + end_point.x) / 2 + 3},${end_point.y - height / 2 - 4 }
19                 L${(start_point.x + end_point.x) / 2},${end_point.y - height / 2 - 4 }
20                 L${(start_point.x + end_point.x) / 2},${start_point.y}
21                 L${start_point.x},${start_point.y}`)
22               } //左边——中间的选项
23               else if(start_point.y === end_point.y) {
24                 ctx.setAttribute('d', `M${start_point.x},${start_point.y}
25                 L${end_point.x - width / 2 - 4},${start_point.y}
26                 L${end_point.x - width / 2 - 4},${start_point.y + 3}
27                 L${end_point.x - width / 2},${start_point.y}
28                 L${end_point.x - width / 2 - 4},${start_point.y - 3}
29                 L${end_point.x - width / 2 - 4},${start_point.y}
30                 L${start_point.x},${start_point.y}`)
31               } // 左边——下边的选项
32               else if(start_point.y > end_point.y){
33                 ctx.setAttribute('d', `M${start_point.x},${start_point.y}
34                 L${(start_point.x + end_point.x) / 2},${start_point.y}
35                 L${(start_point.x + end_point.x) / 2},${end_point.y + height / 2 + 8}
36                 L${(start_point.x + end_point.x) / 2 - 3},${end_point.y + height / 2 + 8}
37                 L${(start_point.x + end_point.x) / 2},${end_point.y + height / 2 + 4}
38                 L${(start_point.x + end_point.x) / 2 + 3},${end_point.y + height / 2 + 8}
39                 L${(start_point.x + end_point.x) / 2},${end_point.y + height / 2 + 8}
40                 L${(start_point.x + end_point.x) / 2},${start_point.y}
41                 L${start_point.x},${start_point.y}`)
42               }
43             } //右边的节点,统一一个方向箭头
44             else if(start_point.x > end_point.x){
45               ctx.setAttribute('d', `M${(start_point.x + end_point.x) / 2},${end_point.y}
46                 L${(start_point.x + end_point.x) / 2},${start_point.y}
47                 L${start_point.x - 4},${start_point.y}
48                 L${start_point.x - 4},${start_point.y + 3}
49                 L${start_point.x},${start_point.y}
50                 L${start_point.x - 4},${start_point.y - 3}
51                 L${start_point.x - 4},${start_point.y}
52                 L${(start_point.x + end_point.x) / 2},${start_point.y}
53                 L${(start_point.x + end_point.x) / 2},${end_point.y}`)
54             }
55             ctx.setAttribute('stroke-width', 2)
56             ctx.setAttribute('stroke', 'rgb(85,89,198)')
57             ctx.setAttribute('fill', 'rgb(85,89,198)')
58     }
59     const printRootBorder = (jm, element, node) => {
60             //jm为jsMind实例,不用
61             //element为节点元素
62             //node为节点数据
63             //返回true则意味着不再渲染该节点,取而代之使用自定义渲染;false则为默认渲染方式
64             if(['root_hardware', 'root_software'].includes(node.id)){
65               element.innerHTML = node.topic
66               element.style.border = '2px solid red'
67               return true
68             } else return false;
69     }
70     return {
71       jsoptions: {
72         container: 'jsmind_container',
73         theme: 'primary',
74         editable: true,
75         mode: 'full',
76         view: {
77           engine: 'svg',
78           custom_line_render: ({ ctx, start_point, end_point }) => printArrow({ ctx, start_point, end_point }, 'root_hardware'), //可以直接在这里用匿名函数绘制,不过如果有多个图需要绘制,而他们又拥有同样的渲染样式,那就可以抽取出来定义后使用
79           custom_node_render: printRootBorder
80         },
81     ……
82       },
83     }
84 }
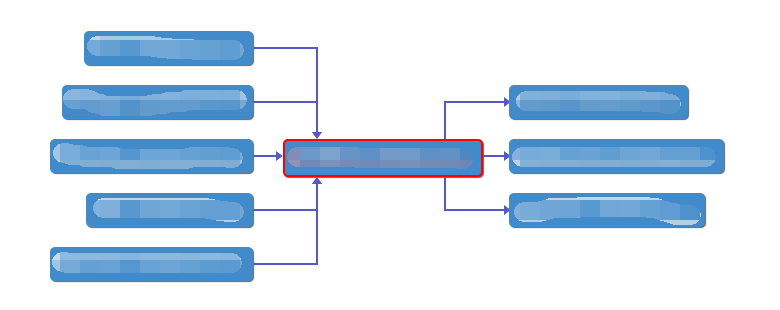
需要注意的是,开始点永远是在子节点上,而结束点是出于根节点中心位置,因此若是要绘制左右两侧的箭头,那么从左边来的连线就要获取根节点的内置高度与宽度,从而计算出连线与其交汇的位置(上面的方法实现)
如果不更改边框的话,正常来说左侧箭头的上下部分绘制时是加减相同的偏差值(即根节点一半高度+箭头本身高度),但不知为何加入了边框后,下方的箭头必须要加上两倍边框的偏差值才行,否则会被边框挡住……
同样的,因为path绘制默认会连接起点到终点部分,
如果为了美观,可以考虑怎么做成曲线连接

 浙公网安备 33010602011771号