Istio(十二):Istio问题排查
一.模块概览
本模块介绍了在使用 Istio 时可能遇到的问题的几种排查方法。
二.Envoy基础
2.1 Envoy 基础
为了排除 Istio 的问题,对 Envoy 的工作原理有一个基本的了解是很有帮助的。Envoy 配置是一个 JSON 文件,分为多个部分。我们需要了解 Envoy 的基本概念是监听器、路由、集群和端点。
这些概念映射到 Istio 和 Kubernetes 资源,Envoy 概念与 Istio 和 Kubernetes 的映射如下图所示:
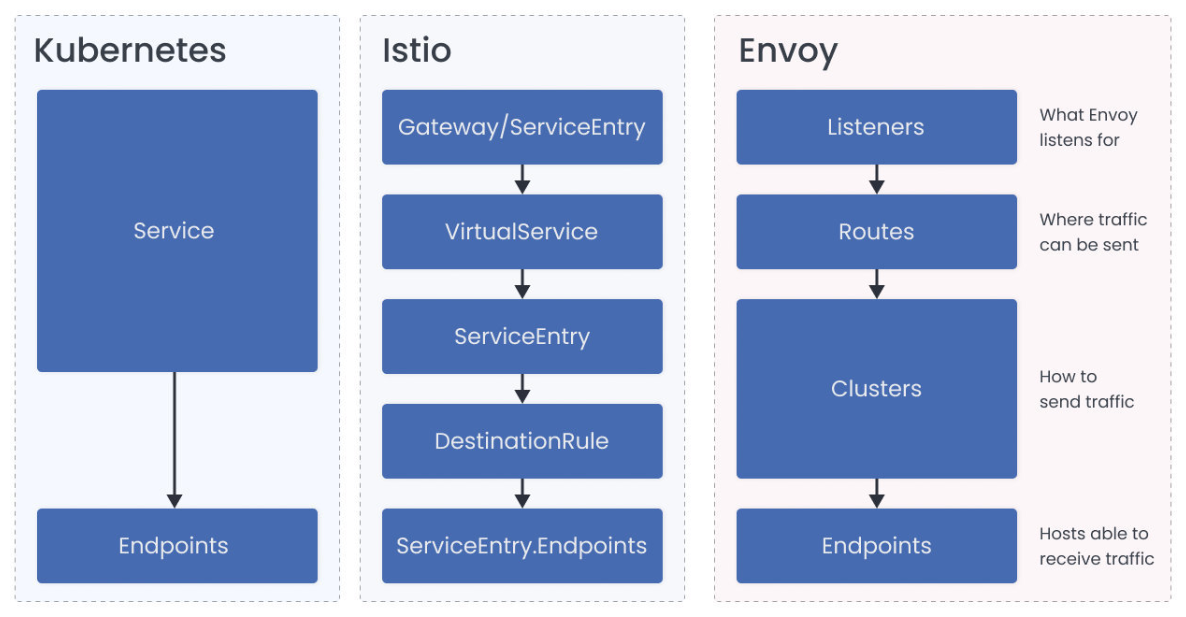
监听器是命名的网络位置,通常是一个 IP 和端口。Envoy 对这些位置进行监听,这是它接收连接和请求的地方。
每个 sidecar 都有多个监听器生成。每个 sidecar 都有一个监听器,它被绑定到 0.0.0.0:15006。这是 IP Tables 将所有入站流量发送到 Pod 的地址。第二个监听器被绑定到 0.0.0.0:15001,这是所有从 Pod 中出站的流量地址。
当一个请求被重定向(使用 IP Tables 配置)到 15001 端口时,监听器会把它交给与请求的原始目的地最匹配的虚拟监听器。如果它找不到目的地,它就根据配置的 OutboundTrafficPolicy 来发送流量。默认情况下,请求被发送到 PassthroughCluster,该集群连接到应用程序选择的目的地,Envoy 没有进行任何负载均衡。
三.Envoy示例
让我们以 Web 前端和 customers 服务为例,看看 Envoy 如何确定将请求从 Web 前端发送到 customers 服务(customers.default.svc.cluster.local)的位置。使用 istioctl proxy-config 命令,我们可以列出 web 前端 pod 的所有监听器。
 $ istioctl proxy-config listeners web-frontend-64455cd4c6-p6ft2
 ADDRESS      PORT  MATCH   DESTINATION
 10.124.0.10  53    ALL     Cluster: outbound|53||kube-dns.kube-system.svc.cluster.local
 0.0.0.0      80    ALL     PassthroughCluster
 10.124.0.1   443   ALL     Cluster: outbound|443||kubernetes.default.svc.cluster.local
 10.124.3.113 443   ALL     Cluster: outbound|443||istiod.istio-system.svc.cluster.local
 10.124.7.154 443   ALL     Cluster: outbound|443||metrics-server.kube-system.svc.cluster.local
 10.124.7.237 443   ALL     Cluster: outbound|443||istio-egressgateway.istio-system.svc.cluster.local
 10.124.8.250 443   ALL     Cluster: outbound|443||istio-ingressgateway.istio-system.svc.cluster.local
 10.124.3.113 853   ALL     Cluster: outbound|853||istiod.istio-system.svc.cluster.local
 0.0.0.0      8383  ALL     PassthroughCluster
 0.0.0.0      15001 ALL     PassthroughCluster
 0.0.0.0      15006 ALL     Inline Route: /*
 0.0.0.0      15010 ALL     PassthroughCluster
 10.124.3.113 15012 ALL     Cluster: outbound|15012||istiod.istio-system.svc.cluster.local
 0.0.0.0      15014 ALL     PassthroughCluster
 0.0.0.0      15021 ALL     Non-HTTP/Non-TCP
 10.124.8.250 15021 ALL     Cluster: outbound|15021||istio-ingressgateway.istio-system.svc.cluster.local
 0.0.0.0      15090 ALL     Non-HTTP/Non-TCP
 10.124.7.237 15443 ALL     Cluster: outbound|15443||istio-egressgateway.istio-system.svc.cluster.local
 10.124.8.250 15443 ALL     Cluster: outbound|15443||istio-ingressgateway.istio-system.svc.cluster.local
 10.124.8.250 31400 ALL     Cluster: outbound|31400||istio-ingressgateway.istio-system.svc.cluster.local
从 Web 前端到 customers 的请求是一个向外的 HTTP 请求,端口为 80。这意味着它被移交给了0.0.0.0:80的虚拟监听器。我们可以使用 Istio CLI 按地址和端口来过滤监听器。你可以添加 -o json 来获得监听器的 JSON 表示:
 $ istioctl proxy-config listeners web-frontend-58d497b6f8-lwqkg --address 0.0.0.0 --port 80 -o json
 ...
 "rds": {
    "configSource": {"ads": {},
       "resourceApiVersion": "V3"
    },
    "routeConfigName": "80"
 },
 ...
Listener 使用 RDS(路由发现服务)来寻找路由配置(在我们的例子中是 80)。路由附属于监听器,包含将虚拟主机映射到集群的规则。这允许我们创建流量路由规则,因为 Envoy 可以查看头文件或路径(请求元数据)并对流量进行路由。
路由(route)选择集群(cluster)。集群是一组接受流量的类似的上游主机 —— 它是一个端点的集合。例如,Web 前端服务的所有实例的集合就是一个集群。我们可以在一个集群内配置弹性功能,如断路器、离群检测和 TLS 配置。
使用 routes 命令,我们可以通过名称过滤所有的路由来获得路由的详细信息。
 $ istioctl proxy-config routes web-frontend-58d497b6f8-lwqkg --name 80 -o json

 [
     {
         "name": "80",
         "virtualHosts": [
             {
                 "name": "customers.default.svc.cluster.local:80",
                 "domains": [
                     "customers.default.svc.cluster.local",
                     "customers.default.svc.cluster.local:80",
                     "customers",
                     "customers:80",
                     "customers.default.svc.cluster",
                     "customers.default.svc.cluster:80",
                     "customers.default.svc",
                     "customers.default.svc:80",
                     "customers.default",
                     "customers.default:80",
                     "10.124.4.23",
                     "10.124.4.23:80"
                 ],
                 ],
                 "routes": [
                     {
                         "match": {"prefix": "/"},
                         "route": {
                             "cluster": "outbound|80|v1|customers.default.svc.cluster.local",
                             "timeout": "0s",
                             "retryPolicy": {
                                 "retryOn": "connect-failure,refused-stream,unavailable,cancelled,retriable-status-codes",
                                 "numRetries": 2,
                                 "retryHostPredicate": [
                                     {"name": "envoy.retry_host_predicates.previous_hosts"}
                                 ],
                                 "hostSelectionRetryMaxAttempts": "5",
                                 "retriableStatusCodes": [503]
                             },
                             "maxGrpcTimeout": "0s"
                         },
 ...
路由 80 配置为每个服务都有一个虚拟主机。然而,由于我们的请求被发送到 customers.default.svc.cluster.local,Envoy 会选择与其中一个域匹配的虚拟主机(customers.default.svc.cluster.local:80)。
一旦域被匹配,Envoy 就会查看路由,并选择第一个匹配请求的路由。由于我们没有定义任何特殊的路由规则,它匹配第一个(也是唯一的)定义的路由,并指示 Envoy 将请求发送到名为 outbound|80|v1|customers.default.svc.cluster.local 的集群。
注意集群名称中的
v1是因为我们部署了一个DestinationRule来创建v1子集。如果一个服务没有子集,这部分就留空:outbound|80||customers.default.svc.cluster.local。
现在我们有了集群的名称,我们可以查询更多的细节。为了得到一个清楚显示 FQDN、端口、子集和其他信息的输出,你可以省略 -o json 标志。
 $ istioctl proxy-config cluster web-frontend-58d497b6f8-lwqkg --fqdn customers.default.svc.cluster.local
 SERVICE FQDN                            PORT     SUBSET     DIRECTION     TYPE     DESTINATION RULE
 customers.default.svc.cluster.local     80       -          outbound      EDS      customers.default
 customers.default.svc.cluster.local     80       v1         outbound      EDS      customers.default
最后,使用集群的名称,我们可以查询请求最终将到达的实际端点:
 $ istioctl proxy-config endpoints web-frontend-58d497b6f8-lwqkg --cluster "outbound|80|v1|customers.default.svc.cluster.local"
 ENDPOINT            STATUS      OUTLIER CHECK     CLUSTER
 10.120.0.4:3000     HEALTHY     OK                outbound|80|v1|customers.default.svc.cluster.local
端点地址等于 customers 应用程序正在运行的 pod IP。如果我们扩展 customers 的部署,额外的端点会出现在输出中,像这样:
$ istioctl proxy-config endpoints web-frontend-58d497b6f8-lwqkg --cluster "outbound|80|v1|customers.default.svc.cluster.local"
ENDPOINT STATUS OUTLIER CHECK CLUSTER
10.120.0.4:3000 HEALTHY OK outbound|80|v1|customers.default.svc.cluster.local
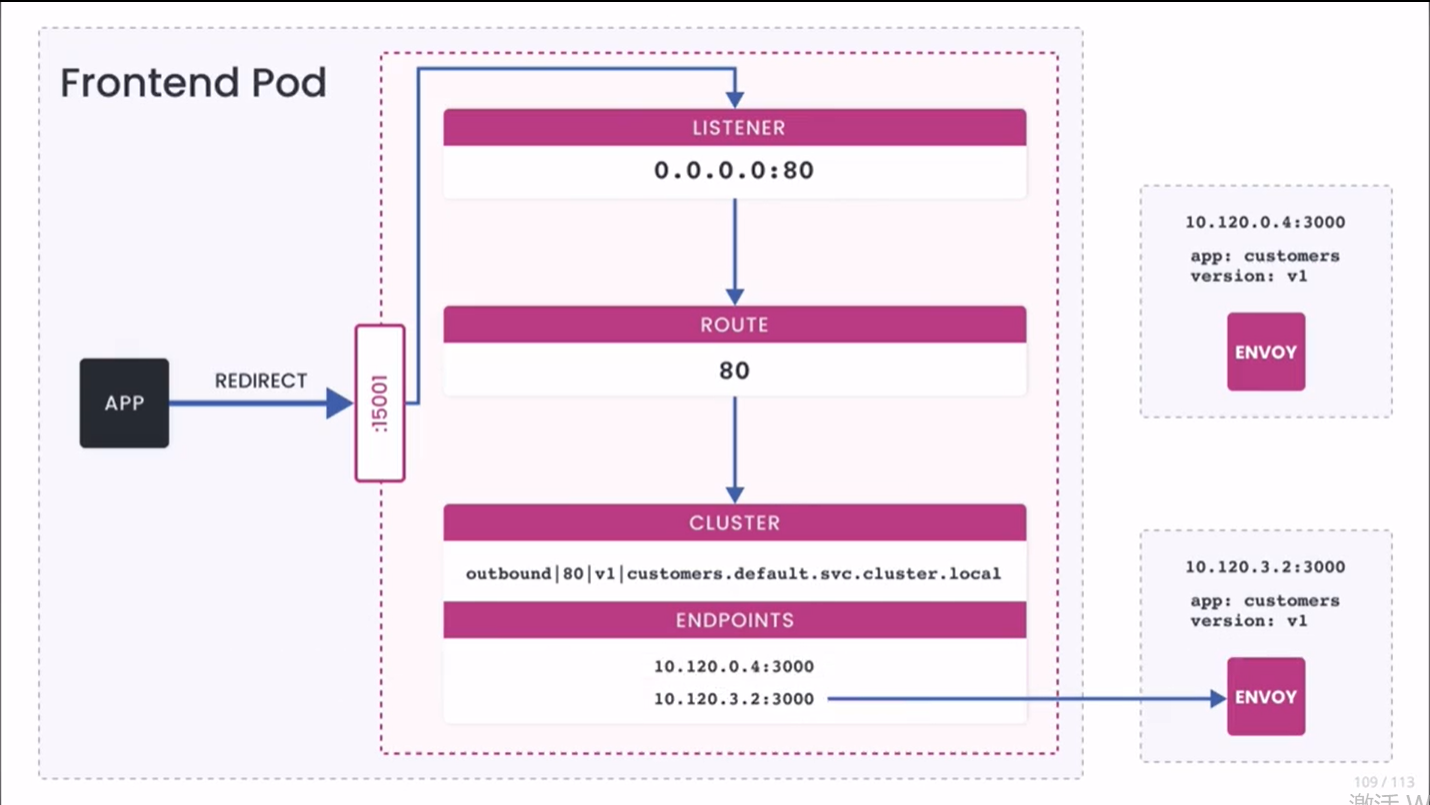
10.120.3.2:3000 HEALTHY OK outbound|80|v1|customers.default.svc.cluster.local
我们也可以用下图来形象地说明上述流程。
四.调试备忘录
每当你遇到配置问题时,你可以使用这组步骤来浏览和解决问题。在第一部分,我们要检查配置是否有效。如果配置是有效的,下一步就是看看运行时是如何处理配置的,为此,你需要对 Envoy 配置有基本的了解。
4.1 配置
1. 配置是否有效?
Istio CLI 有一个叫 validate 的命令,我们可以用它来验证 YAML 配置。YAML 最常见的问题是缩进和数组符号相关的问题。要验证一个配置,请将 YAML 文件传递给 validate 命令,像这样:
 $ istioctl validate -f myresource.yaml
 validation succeed
如果资源是无效的,CLI 会给我们一个详细的错误。例如,如果我们拼错了一个字段名:
unknown field "worloadSelector" in v1alpha3.ServiceEntry
我们可以使用另一个命令istioctl analyze。使用这个命令,我们可以检测 Istio 配置的潜在问题。我们可以针对本地的一组配置文件或实时集群运行它。同时,寻找来自 istiod 的任何警告或错误。
下面是该命令的一个输出样本,它捕捉到了目的地主机名称中的一个错字:
 $ istioctl analyze
 Error [IST0101] (VirtualService customers.default) Referenced host not found: "cusomers.default.svc.cluster.local"
 Error [IST0101] (VirtualService customers.default) Referenced host+subset in destinationrule not found: "cusomers.default.svc.cluster.local+v1"
 Error: Analyzers found issues when analyzing namespace: default.
 See https://istio.io/docs/reference/config/analysis for more information about causes and resolutions.
2. 命名是否正确?资源是否在正确的命名空间?
几乎所有的 Istio 资源都是命名空间范围的。确保它们与你正在处理的服务处于同一命名空间。将 Istio 资源放在同一命名空间中尤其重要,因为选择器也是有命名空间的。
一个常见的错误配置是在应用程序的命名空间中发布 VirtualService(例如 default),然后使用 istio: ingressgateway 选择器来绑定到 istio-system 命名空间中的 ingress 网关部署。这只有在你的 VirtualService 也在 istio-system 命名空间中时才有效。
同样地,不要在 istio-system 命名空间中部署引用应用程序命名空间中的 VirtualService 的 Sidecar 资源。相反,为每个需要入口的应用程序部署一组 Envoy 网关。
3. 资源选择器是否正确?
验证部署中的 pod 是否有正确的标签设置。正如上一步提到的,资源选择器与资源发布的命名空间绑定。
在这一点上,我们应该有理由相信,配置是正确的。接下来的步骤是进一步研究运行时系统是如何处理配置的。
4.2 运行时
Istio CLI 的一个实验性功能可以提供信息,帮助我们了解影响 Pod 或服务的配置。下面是一个针对 Pod 运行 describe 命令的例子,这个 Pod 的主机名称中有一个错字:
 $ istioctl x describe pod customers-v1-64455cd4c6-xvjzm.default
 Pod: customers-v1-64455cd4c6-xvjzm
    Pod Ports: 3000 (svc), 15090 (istio-proxy)
 --------------------
 Service: customers
    Port: http 80/HTTP targets pod port 3000
 DestinationRule: customers for "customers.default.svc.cluster.local"
    Matching subsets: v1
    No Traffic Policy
 VirtualService: customers
    WARNING: No destinations match pod subsets (checked 1 HTTP routes)
       Route to cusomers.default.svc.cluster.local
1. Envoy 是否接受(ACK)该配置?
你可以使用 istioctl proxy-status 命令来检查状态,看看 Envoy 是否接受配置。我们希望所有东西的状态都设置为 SYNCHED。任何其他值都可能表明有错误,你应该检查 Pilot 的日志。
 $ istioctl proxy-status
 NAME               CDS        LDS        EDS        RDS          ISTIOD                     VERSION
 customers-v1...    SYNCED     SYNCED     SYNCED     SYNCED       istiod-67b4c76c6-8lwxf     1.9.0
 customers-v1...    SYNCED     SYNCED     SYNCED     SYNCED       istiod-67b4c76c6-8lwxf     1.9.0
 istio-egress...    SYNCED     SYNCED     SYNCED     NOT SENT     istiod-67b4c76c6-8lwxf     1.9.0
 istio-ingress...   SYNCED     SYNCED     SYNCED     SYNCED       istiod-67b4c76c6-8lwxf     1.9.0
 web-frontend-...   SYNCED     SYNCED     SYNCED     SYNCED       istiod-67b4c76c6-8lwxf     1.9.0
列表显示所有连接到 Pilot 实例的代理。如果列表中缺少一个代理,这意味着它没有连接到 Pilot,也没有收到任何配置。如果任何一个代理被标记为STALE,可能有网络问题,或者我们需要扩展 Pilot。
如果 Envoy 接受了配置,但我们仍然看到问题,我们需要确保配置在 Envoy 中的表现符合预期。
2. 配置在 Envoy 中的表现和预期的一样吗?
我们可以使用 proxy-config 命令来检索特定 Envoy 实例的信息。请参考下面的表格,我们可以检索不同的代理配置。
| 命令 | 描述 |
|---|---|
istioctl proxy-config cluster [POD] -n [NAMESPACE] |
检索 cluster 配置 |
istioctl proxy-config bootstrap [POD] -n [NAMESPACE] |
检索 bootstrap 配置 |
istioctl proxy-config listener [POD] -n [NAMESPACE] |
检索 listener 配置 |
istioctl proxy-config route [POD] -n [NAMESPACE] |
检索 route 配置 |
istioctl proxy-config endpoints [POD] -n [NAMESPACE] |
检索 endpoint 配置 |
该命令从 Envoy 的管理端点(主要是 /config_dump)收集数据,它包含了很多有用的信息。
另外,请参考显示 Envoy 和 Istio 资源之间映射的图。例如,许多 VirtualService 规则将表现为 Envoy 路由,而 DestinationRules 和 ServiceEntries 则表现为 Cluster。
DestinationRules 不会出现在配置中,除非其主机的 ServiceEntry 首先存在。
让我们以客户的 VirtualService 为例。
 apiVersion: networking.istio.io/v1alpha3
 kind: VirtualService
 metadata:
   name: customers
 spec:
   hosts:
     - 'customers.default.svc.cluster.local'
   http:
     - route:
       - destination:
           host: customers.default.svc.cluster.local
           port:
             number: 80
           subset: v1
         weight: 80
       - destination:
           host: customers.default.svc.cluster.local
           port:
             number: 80
           subset: v2
         weight: 20
       timeout: 5s
如果你运行 istioctl proxy-config routes [POD] -o json 命令,你会看到加权目的地和超时是如何在配置中体现的:
 ..
 {
    "name": "80",
    "virtualHosts": [
       {
       "name": "customers.default.svc.cluster.local:80",
       "domains": [
          "customers.default.svc.cluster.local",
          ...
       ],
       "routes": [
          {
             "match": {"prefix": "/"},
             "route": {
                   "weightedClusters": {
                      "clusters": [
                         {
                               "name": "outbound|80|v1|customers.default.svc.cluster.local",
                               "weight": 80
                         },
                         {
                               "name": "outbound|80|v2|customers.default.svc.cluster.local",
                               "weight": 20
                         }
                      ]
                   },
                   "timeout": "5s",
 ...
当你评估 VirtualService 时,你要寻找主机名是否像你写的那样出现在 Envoy 配置中(例如customers.default.svc.cluster.local),以及路由是否存在(见输出中的 80-20 流量分割)。你也可以使用之前的例子,通过监听器、路由和集群(和端点)来追踪调用。
Envoy 过滤器会表现在你告诉 Istio 把它们放在哪里(EnvoyFilter 资源中的 applyTo 字段)。通常情况下,一个坏的过滤器会表现为 Envoy 拒绝配置(即不显示 SYNCED 状态)。在这种情况下,你需要检查 Istiod 日志中的错误。
3. Istiod(Pilot)中是否有错误?
从 Pilot 查看错误的最快方法是跟踪日志(使用 --follow 标志),然后应用配置。下面是一个来自 Pilot 的错误的例子,这是由于过滤器的内联代码中的一个错字而导致的。
2020-11-20T21:49:16.017487Z warn ads ADS:LDS: ACK ERROR sidecar~10.120.1.8~web-frontend-58d497b6f8-lwqkg.default~default.svc.cluster.local-4 Internal:Error adding/updating listener (s) virtualInbound: script load error: [string"fction envoy_on_response (response_handle)..."]:1: '=' expected near 'envoy_on_response'
如果配置根本没有出现在 Envoy 中(Envoy 没有 ACK 它),或者它是一个 EnvoyFilter 配置,那么这个配置很可能是无效的。Istio 无法从语法上验证 EnvoyFilter 内部的配置。另一个问题可能是,过滤器在 Envoy 的配置中位于错误的位置。
无论哪种情况,Envoy 都会拒绝该配置,因为它是无效的,Pilot 会记录这个错误。一般来说,你可以搜索你的资源的名称来找到错误。
在这里,你必须使用判断力来确定它是你写的配置中的错误,还是 Pilot 的错误导致它产生了一个无效的配置。
4.3 检查 Envoy 日志
要检查 Envoy 代理的日志,我们可以使用 kubectl logs 命令:
kubectl logs PODNAME -c istio-proxy -n NAMESPACE
要了解访问日志的格式和响应标志,我们可以参考 Envoy 访问日志 的内容。
最常见的响应标志。
- NR:没有配置路由,检查 DestinationRule 或 VirtualService。
- UO:上游溢出并断路。检查 DestinationRule 中的断路器配置。
- UF:上游连接失败,如果使用 Istio 认证,检查 mTLS 配置。
- UH:没有健康的上游主机。
4.4 配置 istiod 日志
我们可以使用 ControlZ 仪表板,通过 Logging Scopes 菜单配置堆栈跟踪级别和日志级别。
要打开仪表板,请运行:
istioctl dashboard controlz $(kubectl -n istio-system get pods -l app=istiod -o jsonpath='{.items [0].metadata.name}').istio-system
仪表板打开后,点击 Logging Scopes 选项,调整日志级别和堆栈跟踪级别。

 浙公网安备 33010602011771号