

机器学习3kmeans
2.*自主编写K-means算法 ,以鸢尾花花瓣长度数据做聚类,并用散点图显示。(加分题)
kmeans算法主体
from sklearn.datasets import load_iris
from sklearn.model_selection import train_test_split
from sklearn.naive_bayes import GaussianNB
from sklearn.neighbors import KNeighborsClassifier
import numpy as np

#1初始化数据
iris=load_iris()
x=iris["data"]
x1=x[:,2]
#取出重复值

#数据二维化
x=x1.reshape(-1,1)
type(x)
# x=np.array([[1,1,1,1],[2,2,2,2],[3,3,2,3],[4,4,3,4],[5,5,3,5]])
n=len(x)
k=3
#1 选中心
#随机选点,防止选取到的中心点的值相同
center=np.random.choice(np.array(list(set(x1))).reshape(-1,1)[:,0],k).reshape(-1,1)
# center=x[10:13,:]
#统计迭代次数
count=0;
while True:
    #存放个花瓣到每个中心点的欧氏距离,第四项用于存储归类后属于第几个聚类中心
    dist = np.zeros([n, k + 1])
    #存放新的中心点
    center_new = np.zeros([k, x.shape[1]])
    #2 求距离
    for i in range(n):
        for j in range(k):
            dist[i,j]=np.sqrt(sum((x[i,:]-center[j,:])**2))
        #归类
        dist[i,k]=np.argmin(dist[i,:k])
    #3 求新类中心
    for i in range(k):
        index = dist[:, k] == i
        #计算新的聚类中心
        center_new[i, :] = np.mean(x[index, :],axis=0)
    #4 判定
    if(np.all(center==center_new)):
        break
        #print("end")
    else:
        print(center_new)
        count = count + 1
        center=center_new
print("分类结束")

import matplotlib.pyplot as plt
plt.rcParams['font.sans-serif'] = 'SimHei'# 设置中文显示
plt.rcParams['axes.unicode_minus'] =False
p2 = plt.figure(figsize=(6,6))
colors=["red","blue","yellow"]
labels1=["聚类1","聚类2","聚类3"]
labels2=["聚类中心1","聚类中心2","聚类中心3"]
for i in range(0,3):
    print(i)
    index = dist[:, k] == i
    # plt.grid()
    plt.scatter(x[index,0],x[index,0],c=colors[i],cmap="rainbow",s=50,label=labels1[i])
    plt.scatter(center[i], center[i], c=colors[i], edgecolors="black", label=labels2[i],cmap="rainbow", s=50)
plt.legend()
plt.show()
数据结果可视化
import matplotlib.pyplot as plt
plt.rcParams['font.sans-serif'] = 'SimHei'# 设置中文显示
plt.rcParams['axes.unicode_minus'] =False
p2 = plt.figure(figsize=(6,6))
colors=["red","blue","yellow"]
labels1=["聚类1","聚类2","聚类3"]
labels2=["聚类中心1","聚类中心2","聚类中心3"]
for i in range(0,3):
    print(i)
    index = dist[:, k] == i
    # plt.grid()
    plt.scatter(x[index,0],x[index,0],c=colors[i],cmap="rainbow",s=50,label=labels1[i])
    plt.scatter(center[i], center[i], c=colors[i], edgecolors="black", label=labels2[i],cmap="rainbow", s=50)
plt.legend()
plt.show()
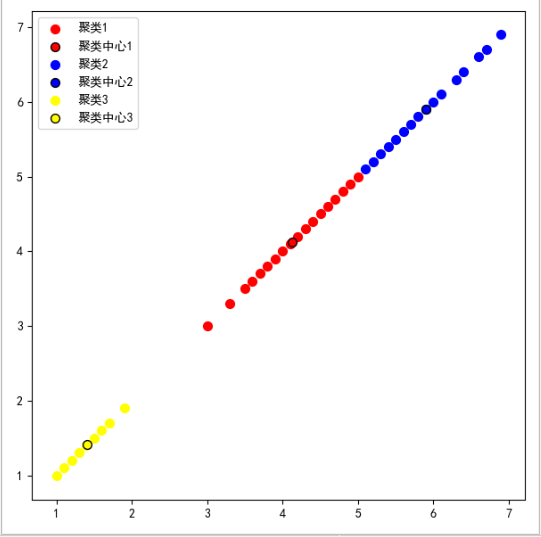
图1
3.. 用sklearn.cluster.KMeans,鸢尾花花瓣长度数据做聚类,并用散点图显示.
from sklearn.datasets import load_iris
from sklearn.cluster import  KMeans

#数据初始化
iris=load_iris()
x=iris["data"]
x=x[:,2]
#数据二维化
x=x.reshape(len(x),1)
#设置聚类中心个数为3
km_model=KMeans(n_clusters=3)
km_model.fit(x)
print("该聚类结果为\n",km_model.labels_)
print("该聚类中心为\n",km_model.cluster_centers_)

#散点图
import matplotlib.pyplot as plt
plt.rcParams['font.sans-serif'] = 'SimHei'# 设置中文显示
plt.rcParams['axes.unicode_minus'] =False
p2 = plt.figure(figsize=(6,6))
plt.scatter(x[:,0],x[:,0],c=km_model.labels_,cmap="rainbow",s=50)
plt.show()
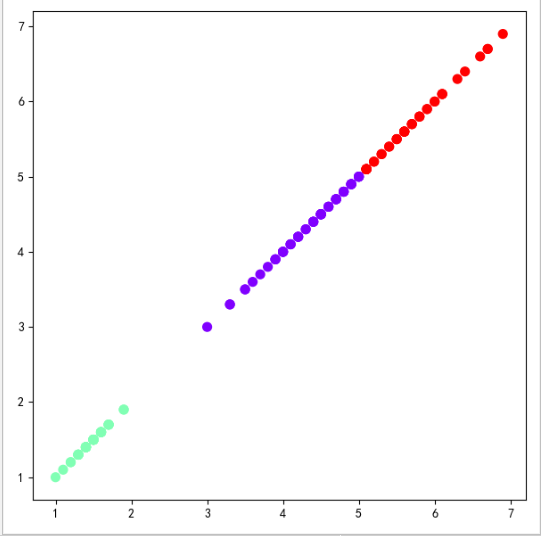
图2
4. 鸢尾花完整数据做聚类并用散点图显示.
#数据初始化
iris=load_iris()
x=iris["data"]
#设置聚类中心个数为3
km_model=KMeans(n_clusters=3)
km_model.fit(x)
print("该聚类结果为\n",km_model.labels_)
print("该聚类中心为\n",km_model.cluster_centers_)

#散点图
import matplotlib.pyplot as plt
plt.rcParams['font.sans-serif'] = 'SimHei'# 设置中文显示
plt.rcParams['axes.unicode_minus'] =False
p2 = plt.figure(figsize=(6,6))
plt.scatter(x[:,2],x[:,3],c=km_model.labels_,cmap="rainbow",s=50)
plt.show()
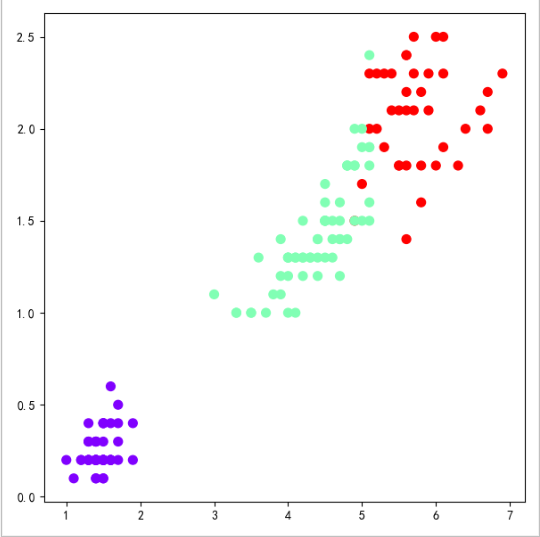
图3
5.想想k均值算法中以用来做什么
利用K均值算法实现图像压缩,所谓图像压缩指的是在图像像素方面的处理。

 浙公网安备 33010602011771号