
批量监控关键业务站点nginx的http状态码
一些业务站点比较关键,比如API接口或者web站点,需要对出现的访问http状态码进行监控,比如监控10分钟以内,或者最近的1000次访问,当出现的50x状态码过多时触发告警,可以让一些问题暴露出来及时处理
1.编写脚本
# cat /usr/local/zabbix_agents_3.2.0/scripts/web_nginx_code.sh
#!/bin/bash
# function:monitor store nginx access error code

web_domain_discovery () {
WEB_DOMAIN=($(cat  /usr/local/zabbix_agents_3.2.0/scripts/web_site.txt|grep -v "^#"))
        printf '{\n'
        printf '\t"data":[\n'
for((i=0;i<${#WEB_DOMAIN[@]};++i))
    {
    num=$(echo $((${#WEB_DOMAIN[@]}-1)))
        if [ "$i" != ${num} ];
            then
        printf "\t\t{ \n"
        printf "\t\t\t\"{#SITENAME}\":\"${WEB_DOMAIN[$i]}\"},\n"
            else
                printf  "\t\t{ \n"
                printf  "\t\t\t\"{#SITENAME}\":\"${WEB_DOMAIN[$num]}\"}]}\n"
        fi
    }
}

# 统计nginx access log中的50x代码个数
error_code_count () {
    web_site=$1
    if [ ${web_site} == 'store.chinasoft.jp' ];then
        #/usr/bin/cat /data/www/logs/nginx_log/access/${web_site}.access.log |awk '{print $1" "$10" "$11}'|grep 'HTTP/1.1" 50'|uniq |wc -l
        tail -n 1000 /data/www/logs/nginx_log/access/${web_site}.access.log |awk '{print $1" "$10" "$11}'|grep 'HTTP/1.1" 50'|uniq |wc -l
        exit 0
    fi
    #/usr/bin/cat /data/www/logs/nginx_log/access/${web_site}_access.log |awk '{print $1" "$10" "$11}'|grep 'HTTP/1.1" 50'|uniq |wc -l
    tail -n 1000 /data/www/logs/nginx_log/access/${web_site}_access.log |awk '{print $1" "$10" "$11}'|grep 'HTTP/1.1" 50'|uniq |wc -l
}

last10_mins_error_code_count () {
    web_site=$1
    if [ ${web_site} == 'store.chinasoft.jp' ];then
        /usr/bin/cat /data/www/logs/nginx_log/access/${web_site}.access.log |awk '{print $1" "$10" "$11}'|grep 'HTTP/1.1" 50'|uniq |wc -l
        exit 0
    fi
    #/usr/bin/cat /data/www/logs/nginx_log/access/${web_site}_access.log |awk '{print $1" "$10" "$11}'|grep 'HTTP/1.1" 50'|uniq |wc -l
    # 统计最近 10 分钟的 50x 错误
    /usr/bin/tac /data/www/logs/nginx_log/access/${web_site}_access.log| awk 'BEGIN{ "date -d \"-10 minute\" +\"%H:%M:%S\"" | getline min10ago } { if (substr($4, 14) > min10ago) print $0;else exit }' | tac| awk '{print $1" "$10" "$11}' | grep 'HTTP/1.1" 50'|uniq|wc -l
}


case "$1" in
    web_domain_discovery)
        web_domain_discovery
    ;;
    error_code_count)
        error_code_count $2
    ;;
        last10_mins_error_code_count)
                last10_mins_error_code_count $2
        ;;
*)

echo "Usage:$0 {web_web_discovery|error_code_count|last10_mins_error_code_count}"
;;
esac
站点的读取文件格式
# cat /usr/local/zabbix_agents_3.2.0/scripts/web_site.txt
account.chinasoft.cn
distriapi.chinasoft.cn
innerapi.chinasoft.cn
masterapi.chinasoft.cn
mm.chinasoft.cn
userapi.chinasoft.cn
2.编写监控配置
# cat /usr/local/zabbix_agents_3.2.0/conf/zabbix_agentd/web_nginx_code_discovery.conf
UserParameter=web.domain.discovery,/usr/local/zabbix_agents_3.2.0/scripts/web_nginx_code.sh web_domain_discovery
UserParameter=web.domain.code[*],/usr/local/zabbix_agents_3.2.0/scripts/web_nginx_code.sh error_code_count $1
UserParameter=web.domain.10mins.code[*],/usr/local/zabbix_agents_3.2.0/scripts/web_nginx_code.sh last10_mins_error_code_count $1
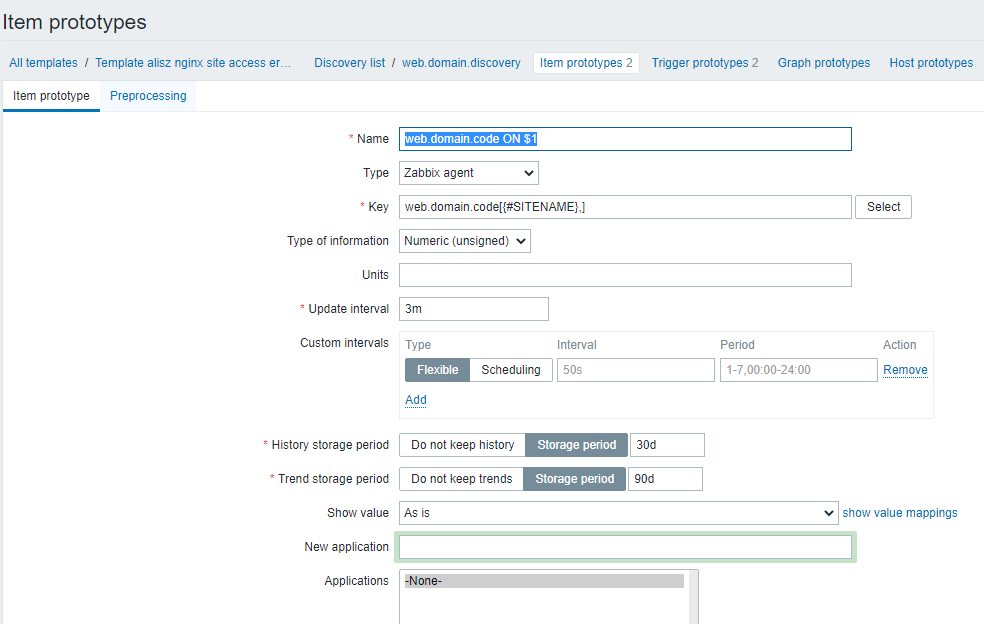
3.创建监控项
name和key都是:web.domain.discovery

监控项
10分钟内的状态码
name: web.domain.10mins.code ON $1
key: web.domain.10mins.code[{#SITENAME},]

监控项
name:web.domain.code ON $1
key: web.domain.code[{#SITENAME},]
触发器
name: {#SITENAME} last 10 minutes nginx 50x great than 10
表达式
{Template alisz nginx site access error_code count:web.domain.10mins.code[{#SITENAME},].last()}>50
10分钟超过50个50x就报警

最近的1000个访问超过200触发报警
name:{#SITENAME} nginx 50x code great than 20%
触发器:
{Template alisz nginx site access error_code count:web.domain.code[{#SITENAME},].last()}>200


 浙公网安备 33010602011771号